A Practical Guide to Setting Up Molecular Dynamics Simulations in GROMACS: From Fundamentals to Advanced Applications
This guide provides a comprehensive, structured approach for researchers, scientists, and drug development professionals to set up and execute molecular dynamics (MD) simulations using GROMACS.
A Practical Guide to Setting Up Molecular Dynamics Simulations in GROMACS: From Fundamentals to Advanced Applications
Abstract
This guide provides a comprehensive, structured approach for researchers, scientists, and drug development professionals to set up and execute molecular dynamics (MD) simulations using GROMACS. It covers foundational concepts, step-by-step methodologies, advanced optimization techniques, and rigorous validation protocols. By integrating the latest features from GROMACS 2025 releases, such as GPU-accelerated free-energy perturbation and automated physical validation, this article equips users with the knowledge to perform efficient and reliable simulations for biomedical research, including structure-based drug design and protein-ligand interaction studies.
Understanding GROMACS: Core Concepts and System Preparation
Molecular dynamics (MD) is a computational technique that simulates the physical movements of atoms and molecules over time. By iteratively solving Newton's equations of motion for a system of interacting particles, MD provides insights into dynamic processes at the atomic level that are often inaccessible through experimental methods alone [1] [2]. This approach allows researchers to follow the time evolution of molecular systems, capturing structural changes, conformational transitions, and interaction patterns that underlie biological function and molecular recognition.
GROMACS (GROningen MAchine for Chemical Simulations) is a highly optimized software package designed to perform molecular dynamics simulations, particularly focused on biomolecular systems such as proteins, lipids, and nucleic acids [1]. Renowned for its exceptional performance and scalability, GROMACS has consistently ranked among the fastest molecular dynamics codes available, making it a preferred tool in both academic and industrial research settings [3]. The engine performs two primary types of calculations: molecular dynamics simulations to model system behavior over time, and energy minimization to identify stable low-energy configurations [1].
In the broader context of computational chemistry, GROMACS occupies an important position between quantum mechanical methods that provide high accuracy for small systems, and coarser-grained approaches that can handle larger systems but with reduced atomic detail [1]. This positioning makes it particularly valuable for studying biologically relevant macromolecules in aqueous environments, where the balance between computational efficiency and atomic resolution is crucial for addressing scientifically meaningful questions.
Theoretical Foundation of Molecular Dynamics
Fundamental Principles
The mathematical foundation of molecular dynamics in GROMACS centers on Newton's equations of motion for a system of N interacting atoms. The core equation governing atomic movements is expressed as:
[mi \frac{\partial^2 \mathbf{r}i}{\partial t^2} = \mathbf{F}_i, \;i=1 \ldots N]
where (mi) represents the mass of atom i, (\mathbf{r}i) its position, and (\mathbf{F}i) the force acting upon it [1]. These forces are derived as negative gradients of a potential energy function (V(\mathbf{r}1, \mathbf{r}2, \ldots, \mathbf{r}N)) that describes how atoms interact with each other:
[\mathbf{F}i = - \frac{\partial V}{\partial \mathbf{r}i}]
The potential energy function encompasses various contributions including bond stretching, angle bending, torsional rotations, and non-bonded interactions (van der Waals and electrostatic forces) [1]. By numerically integrating these equations of motion in small time steps (typically 1-2 femtoseconds), GROMACS generates trajectories that depict how atomic positions and velocities evolve over time, effectively creating a "computational microscope" that reveals molecular behavior at picosecond to microsecond timescales.
Practical Considerations and Limitations
While powerful, molecular dynamics simulations employing GROMACS operate under several important approximations that users must acknowledge. First, the simulations are fundamentally classical, treating atomic motion according to Newtonian mechanics rather than quantum mechanics [1]. This approximation works well for many heavier atoms at physiological temperatures but becomes problematic for light atoms like hydrogen, where quantum effects such as tunneling may be significant. High-frequency vibrations (particularly bond stretches involving hydrogen atoms) exceed the classical treatment's validity at room temperature, necessitating correction methods or constraint algorithms [1].
Second, the Born-Oppenheimer approximation is applied, assuming electrons remain in their ground state during atomic motions [1]. This prevents the simulation of electron transfer processes or electronically excited states. Third, GROMACS utilizes empirical force fields that are inherently approximate and typically pair-additive, meaning they represent many-body effects like polarizability through effective pair potentials [1]. Finally, computational efficiency requires truncating long-range interactions using cut-off distances, though sophisticated algorithms like Particle Mesh Ewald (PME) help mitigate artifacts from this approximation [1] [2].
Table 1: Key Approximations in GROMACS Molecular Dynamics
| Approximation | Description | Consequences | Common Mitigation Strategies |
|---|---|---|---|
| Classical Mechanics | Treats atomic motion classically using Newton's equations | Fails for light atoms/high-frequency vibrations; no quantum effects | Constrain bonds; apply quantum corrections to energies |
| Born-Oppenheimer | Electrons remain in ground state during nuclear motion | Cannot simulate electron transfer or excited states | Use specialized methods for reactive systems |
| Empirical Force Fields | Parameterized potential functions | Accuracy limited by parameterization; pair-additivity | Choose appropriate force field; validate against experimental data |
| Truncated Interactions | Long-range interactions cut off at finite distance | Potential artifacts from missing long-range contributions | Use PME for electrostatics; larger cut-offs where feasible |
GROMACS Workflow: From Structure to Analysis
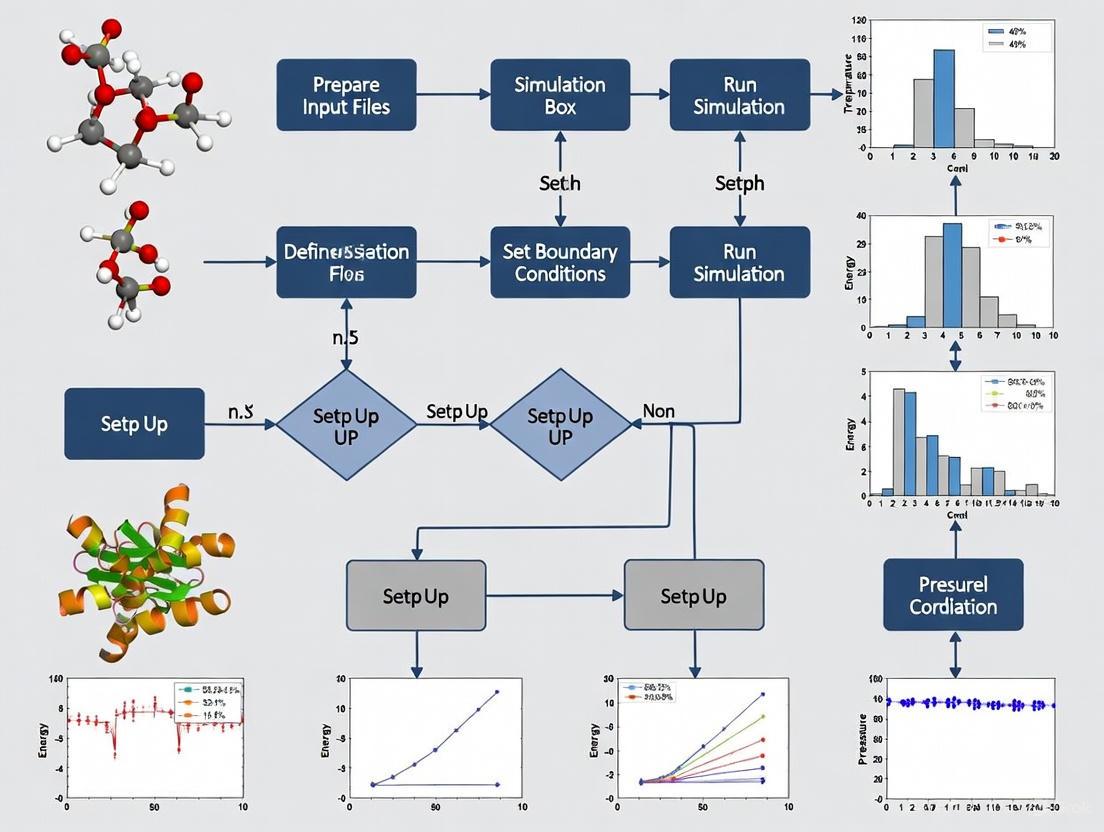
A complete molecular dynamics simulation in GROMACS follows a structured workflow with distinct stages, each serving a specific purpose in ensuring a physically meaningful and stable simulation [4] [2]. The schematic representation below illustrates this comprehensive process:
System Preparation and Solvation
The initial stage involves preparing the molecular system for simulation. This begins with obtaining or generating a starting structure, typically from experimental sources like X-ray crystallography or NMR, or through homology modeling [2]. The structure must be "cleaned" by removing non-protein components such as water molecules and ions that will be systematically reintroduced later [2]. GROMACS then generates a topology describing how atoms interact by assigning atom masses, bond parameters, and partial charges based on the selected force field [2].
The force field selection (e.g., OPLS/AA, AMBER, CHARMM) determines the mathematical forms and parameters used to calculate potential energies [2]. Following topology generation, the protein is centered in a simulation box, with common box types including rectangular boxes and more efficient rhombic dodecahedra that minimize solvent molecules while maintaining minimum image convention [2]. Finally, the system is solvated with water molecules (using models such as SPC, SPC/E, or TIP3P) and ions are added to neutralize the system's net charge and achieve physiological salt concentrations [2].
Energy Minimization and Equilibration
With a fully assembled system, energy minimization addresses any residual steric clashes or unusual geometry that would create artificially high energy states [2]. This step employs algorithms like steepest descent or conjugate gradient to find the nearest local energy minimum, effectively "relaxing" the structure before dynamics begin [1] [2]. The minimization proceeds until the maximum force falls below a specified tolerance (e.g., 1000 kJ/mol/nm) [2].
Following minimization, the system undergoes a two-stage equilibration process to gradually introduce dynamics while maintaining stability. First, NVT equilibration (constant Number of particles, Volume, and Temperature) allows the solvent to reorganize around the protein while restraining protein atomic positions, bringing the system to the target temperature (typically 300K) using thermostats like Berendsen or velocity rescaling [2]. Second, NPT equilibration (constant Number of particles, Pressure, and Temperature) adjusts the system density to the target pressure (usually 1 bar) using barostats like Parrinello-Rahman, allowing the box size to fluctuate appropriately [2].
Production Simulation and Analysis
The production phase follows equilibration, continuing the simulation without positional restraints and using parameters identical to the final equilibration stage [2]. This phase collects the trajectory data used for subsequent analysis, with duration dependent on the scientific question and available computational resources. While short simulations (nanoseconds) may suffice for studying local flexibility, longer simulations (microseconds to milliseconds) are often necessary for capturing large-scale conformational changes or binding events.
Finally, trajectory analysis extracts scientifically meaningful information from the simulated dynamics. GROMACS includes numerous built-in analysis tools for calculating properties such as root-mean-square deviation (RMSD) to monitor structural stability, radius of gyration to measure compactness, radial distribution functions to study solvation, and hydrogen bonding patterns to investigate molecular interactions [4] [5]. Additional analyses might include principal component analysis to identify essential dynamics, clustering to group similar conformations, and free energy calculations to quantify binding affinities or conformational preferences [3].
The Scientist's Toolkit: Essential GROMACS Components
Successful molecular dynamics simulations require careful selection of various computational "reagents" that define the physical model and simulation parameters. The table below outlines key components researchers must consider when designing GROMACS simulations:
Table 2: Essential Research Reagents for GROMACS Simulations
| Component | Function | Common Options | Selection Considerations |
|---|---|---|---|
| Force Field | Defines potential energy function and parameters | OPLS/AA, AMBER, CHARMM, GROMOS | Compatibility with biomolecule type; validation against relevant experimental data |
| Water Model | Represents solvent water properties | SPC, SPC/E, TIP3P, TIP4P | Matching to force field; dielectric properties; computational cost |
| Temperature Coupling | Maintains constant temperature during simulation | Berendsen, velocity rescaling, Nose-Hoover | Stability vs. accurate ensemble generation |
| Pressure Coupling | Maintains constant pressure during simulation | Berendsen, Parrinello-Rahman | Stability during equilibration; accurate fluctuation reproduction |
| Electrostatic Treatment | Handles long-range electrostatic interactions | PME, Cut-off, Reaction-field | Accuracy; computational requirements; system size |
| Constraint Algorithms | Manage high-frequency bond vibrations | LINCS, SHAKE | Enable longer time steps; maintain molecular geometry |
Advanced Features and Specialized Applications
Enhanced Sampling and Free Energy Calculations
Beyond conventional molecular dynamics, GROMACS supports advanced sampling techniques that accelerate rare events and enable free energy calculations [3]. Umbrella sampling applies positional restraints along a reaction coordinate to reconstruct potential of mean force (PMF) profiles, useful for studying processes like ligand unbinding or conformational transitions [3]. Free energy perturbations gradually transform one molecular species into another through alchemical pathways, allowing calculation of relative binding affinities or solvation free energies [3]. These methods expand GROMACS applications to drug design challenges where quantifying interaction strengths is essential.
Tabulated Interaction Functions
For researchers requiring specialized potential functions beyond standard force fields, GROMACS offers tabulated interaction functions [6]. Users can define custom potential functions for non-bonded interactions according to:
[V(r{ij}) = \frac{qi qj}{4 \pi\epsilon0} f(r{ij}) + C6 g(r{ij}) + C{12} h(r_{ij})]
where (f), (g), and (h) are user-defined functions specifying electrostatic, dispersion, and repulsive interactions respectively [6]. The software employs cubic spline interpolation with optimized coefficients to ensure smooth potential and force evaluation during simulation [6]. This flexibility enables simulations with novel functional forms or specific modifications to standard potentials for methodological development or specialized applications.
Performance Optimization Features
GROMACS incorporates sophisticated algorithms to maximize simulation performance while maintaining accuracy. The Verlet cut-off scheme uses neighbor searching with buffered pair lists that are updated intermittently, significantly reducing computational overhead [7]. Dynamic pair list pruning further optimizes performance by removing particle pairs that remain outside the interaction cut-off during the list's lifetime [7]. The software also implements cluster-based non-bonded kernels that process multiple particle interactions simultaneously, efficiently utilizing modern SIMD and SIMT hardware architectures in CPUs and GPUs [7]. These optimizations make GROMACS exceptionally performant, enabling researchers to simulate larger systems for longer time scales within practical computational constraints.
Protocol: Lysozyme Simulation in Water
To illustrate a complete GROMACS workflow, this protocol outlines the simulation of hen egg white lysozyme in aqueous solution, a common benchmark system [3] [2]. The process assumes GROMACS is installed and properly configured on the computing environment.
System Setup
Obtain and prepare the initial structure: Download the lysozyme structure (PDB code 1AKI) from the Protein Data Bank and remove non-protein atoms:
Generate topology and define simulation box:
Solvate and add ions:
Energy Minimization
Prepare input parameters (create em.mdp file with following content):
Run energy minimization:
Check minimization success by verifying the maximum force is below the specified tolerance (1000 kJ/mol/nm):
System Equilibration
NVT Equilibration (create nvt.mdp with appropriate parameters):
NPT Equilibration (create npt.mdp with appropriate parameters):
Monitor equilibration by checking temperature and pressure stability:
Production Simulation and Analysis
Run production MD:
Analyze trajectory for basic properties:
This protocol produces a stable, equilibrated lysozyme simulation suitable for investigating structural dynamics, flexibility, and solvation properties. The resulting trajectory serves as the foundation for more specialized analyses depending on research objectives.
GROMACS represents a sophisticated yet accessible platform for biomolecular simulation, offering researchers the ability to probe atomic-scale dynamics critical to understanding biological function and facilitating drug discovery. Its careful balance between physical accuracy and computational efficiency, coupled with extensive analysis capabilities, has established it as a cornerstone tool in computational chemistry and structural biology. The systematic workflow outlined in this article—from initial system preparation through production simulation and analysis—provides a robust framework for researchers to implement molecular dynamics studies addressing diverse scientific questions. As force fields continue to improve and computational resources expand, GROMACS simulations will offer increasingly detailed insights into complex biological processes, bridging the gap between static structural information and dynamic functional understanding.
Molecular dynamics (MD) simulations have become an indispensable tool in computational biology, chemistry, and drug development, enabling researchers to study the structure, dynamics, and function of biomolecular systems. Among the various MD software packages available, GROMACS has consistently remained one of the most popular and high-performance choices, distinguished by its exceptional speed and comprehensive feature set. For researchers embarking on MD projects, particularly those new to the field, effectively navigating the extensive documentation and diverse community resources can be a daunting yet critical task for successful simulation outcomes. This guide provides a structured pathway through the GROMACS ecosystem, framed within the broader context of setting up and conducting molecular dynamics research, enabling both novice and experienced users to efficiently locate information and leverage community support.
The GROMACS Resource Ecosystem
GROMACS provides a multi-faceted support ecosystem comprising official documentation, interactive learning platforms, and community-driven forums. Understanding the purpose and interrelation of these components is the first step toward efficient problem-solving.
Table: Core Components of the GROMACS Resource Ecosystem
| Resource Type | Key Access Points | Primary Function | Target Audience |
|---|---|---|---|
| Official Documentation | manual.gromacs.org [8] [9] [10] | Comprehensive technical reference, installation guides, and user manuals | All users, from beginners to advanced developers |
| Interactive Tutorials | tutorials.gromacs.org [11]; mdtutorials.com/gmx/ [3] | Hands-on, step-by-step learning for specific simulation types | Beginners and users exploring new simulation methods |
| Community Support | gromacs.bioexcel.eu [12] | Q&A forum for troubleshooting and knowledge sharing | Users encountering specific problems or seeking advice |
| Official Website | www.gromacs.org [13] | News, release announcements, and central resource hub | All users tracking updates and general information |
The following diagram illustrates the recommended pathway for a researcher to navigate these resources, from initial setup to advanced problem-solving:
Official Documentation and Version Control
The official GROMACS documentation serves as the authoritative source for all technical information. The documentation is version-specific, ensuring instructions and parameters align with your installed software. The current version as of 2025 is the 2025 series, with documentation readily available online [8] [13]. The documentation is systematically organized into several key sections:
- Installation Guide: Provides comprehensive instructions for compiling and installing GROMACS on various platforms, including crucial guidance for enabling GPU acceleration via CUDA, which can dramatically speed up calculations [8] [14].
- User Guide: Offers introductory material and practical advice for performing effective simulations, making it an excellent starting point for beginners [10].
- Reference Manual: Delves into the theoretical background, algorithms, and implementation details for users who need a deeper understanding [8] [10].
- How-To Guides: Contain short, focused articles for accomplishing specific tasks [8].
A critical best practice is to always use the documentation that matches your specific GROMACS version, as commands and acceptable parameters can change between releases. The official documentation portal provides access to the documentation for all maintained versions, including the recent 2025, 2024, and 2023 series [9]. The GROMACS development team maintains a clear policy, typically keeping only the two most recent major versions under active maintenance. For instance, when the 2023 series was released, the 2021 series entered a state of limited, conservative maintenance [9]. This policy underscores the importance of using an up-to-date version for your research to ensure access to the latest features and critical bug fixes.
Interactive Tutorials and Learning Pathways
For researchers new to GROMACS or tackling a new type of simulation system, interactive tutorials provide the most effective learning pathway. These resources translate theoretical knowledge into practical, step-by-step protocols.
- Official GROMACS Tutorials: Hosted at
tutorials.gromacs.org, these are provided as interactive Jupyter notebooks that can be run directly in a web browser. This platform is regularly used in official training workshops and provides a uniform, accessible learning environment [11]. - Justin Lemkul's Tutorials: Available at
mdtutorials.com/gmx/, these are among the most widely used and respected tutorials in the community. They are meticulously designed to progress from fundamental to advanced topics and are being updated for GROMACS 2025 [3]. The sequence of learning is logically structured:- Lysozyme in Water: Covers the complete workflow for a standard soluble protein, including system preparation, solvation, energy minimization, equilibration, and production MD [3].
- Membrane Proteins (KALP15 in DPPC): Introduces the complexities of simulating lipid bilayers and embedded proteins [3].
- Protein-Ligand Complexes: Focuses on the critical steps of parameterizing and handling non-standard small molecules [3].
- Free Energy Calculations: Guides users through advanced techniques for calculating binding affinities and solvation free energies [3].
These tutorials are not just collections of commands; they provide crucial scientific context, explain the rationale behind each step, and offer troubleshooting advice, making them invaluable for a researcher's thesis work.
Community Engagement and Support
When documentation and tutorials are insufficient to resolve a problem, the GROMACS user community becomes an essential resource. The primary official forum for user support is the BioExcel GROMACS Forum (gromacs.bioexcel.eu) [12]. This platform hosts several dedicated categories:
- User Discussions: This is the main forum for asking and answering usage and troubleshooting questions. With thousands of posts, it is a rich repository of solved issues [12].
- Announcements: A channel for official news from the development team, including patch releases and security notices [12].
- Third-Party Tools: A curated space for sharing and discussing external tools, force fields, and scripts that complement GROMACS [12].
- Development Discussions: A forum for conversations about the internal codebase and future development of GROMACS [12].
Before posting a new question, it is considered good practice to thoroughly search the forum archives, as many common issues have already been addressed in detail. For example, a user inquiring about the availability of Accelerated Molecular Dynamics (aMD) would discover that it is not currently a standard feature in GROMACS, leading them to consider alternative enhanced sampling methods [14]. When asking a question, providing a clear description of your system, the exact commands used, relevant portions of your input files, and the associated error messages will significantly increase the likelihood of receiving a helpful response.
Experimental Protocol: A Standard MD Workflow
To contextualize the use of these resources, below is a generalized MD setup protocol for a protein, adapted from peer-reviewed literature and community tutorials [15] [3]. This workflow exemplifies the practical steps where a researcher would need to consult the specific resources detailed in previous sections.
Research Reagent Solutions
Table: Essential Materials and Software for a Typical GROMACS Simulation
| Item | Function/Description | Source |
|---|---|---|
| Protein Structure (PDB File) | Initial 3D coordinates of the biomolecule to be simulated. | Protein Data Bank (RCSB PDB) [15] |
| Force Field | A set of mathematical functions and parameters describing interatomic forces. Examples include CHARMM, AMBER, and GROMOS families. | Chosen during the pdb2gmx step; common ones are bundled with GROMACS [15] [3] |
| Molecular Topology File (.top) | Describes the molecular system (atoms, bonds, angles, charges, etc.) in the language of the force field. | Generated by pdb2gmx and updated in subsequent steps [15] |
| Parameter File (.mdp) | A set of all the control parameters that define the conditions of the simulation (e.g., temperature, pressure, timestep). | GROMACS documentation website or tutorial examples [15] |
| Water Model | Defines the explicit solvent molecules (e.g., SPC, TIP3P, TIP4P) to solvate the protein. | Added during the solvate step [15] [3] |
| Counter Ions | Ions (e.g., Na⁺, Cl⁻) added to neutralize the total charge of the system. | Added during the genion step [15] |
Computational Procedure
The logical flow of a simulation, from initial structure to production run, can be visualized as a series of preparation and simulation stages. This workflow is foundational to most research projects involving molecular dynamics in GROMACS.
System Preparation
- Obtain and pre-process protein structure: Download a PDB file and remove extraneous molecules like crystallographic water and unknown ligands unless they are critical to your study. Visualize the structure with a tool like RasMol [15].
- Generate topology and structure file: Use the
pdb2gmxcommand to create the topology (*.top) and GROMACS format structure (*.gro) files. This step requires selecting an appropriate force field (e.g.,ffG53A7was recommended for GROMACS v5.1 with explicit solvent; consult current tutorials for up-to-date recommendations). - Define the simulation box: Use
editconfto place the protein in a periodic box (e.g., cubic, dodecahedron) with sufficient margin (e.g., 1.0-1.4 nm) from the edges. - Solvate the system: Use
solvateto fill the box with water molecules. This automatically updates your topology file. - Neutralize the system: First, generate a binary input file (
*.tpr) usinggromppwith a simple parameter file (*.mdp). Then, usegenionto replace water molecules with counter ions to achieve a net zero charge.
Simulation Execution
- Energy Minimization: Run a steepest descent or conjugate gradient algorithm to remove any steric clashes and bad contacts in the initial structure. This is a critical step before heating the system.
- System Equilibration: This is a two-stage process to slowly bring the system to the desired thermodynamic state.
- NVT Ensemble: Equilibrate the system at constant Number of particles, Volume, and Temperature (e.g., 300 K) for about 50-100 ps, restraining the heavy atoms of the protein to their initial positions.
- NPT Ensemble: Further equilibrate the system at constant Number of particles, Pressure (e.g., 1 bar), and Temperature for another 50-100 ps, typically with weaker or no restraints.
- Production MD: This is the final, unrestrained simulation from which data is collected for analysis. The length of this simulation (nanoseconds to microseconds) depends on the biological process being studied [15] [3].
Trajectory Analysis
Mastering the landscape of GROMACS documentation and community resources is a foundational skill for any researcher employing molecular dynamics in their work. A strategic approach—starting with the official documentation for reference, progressing through structured tutorials for practical experience, and engaging with the community forum for targeted problem-solving—will significantly accelerate the learning curve and enhance the quality and reliability of simulation results. As GROMACS continues to evolve, with the 2025 series representing the current state-of-the-art, these resources remain dynamic, continually updated to incorporate new methodologies and best practices. By integrating these resources into a standardized simulation workflow, as outlined in the general protocol, researchers and drug development professionals can build a solid foundation for conducting robust and scientifically impactful molecular dynamics investigations.
Force Fields, Periodic Boundary Conditions, and Integrators
In molecular dynamics (MD) simulations with GROMACS, three foundational concepts form the essential framework for accurate and efficient modeling of biomolecular systems: force fields, periodic boundary conditions (PBC), and integrators. These components work synergistically to describe interatomic interactions, minimize finite-size artifacts, and numerically solve equations of motion. For researchers in drug development and structural biology, understanding the precise implementation and appropriate selection of these elements is critical for generating reliable simulation data that can inform experimental work and rational drug design. This protocol details the practical application of these concepts within the GROMACS environment, providing structured guidance for setting up robust MD simulations.
Force Fields: The Rulebook for Atomic Interactions
A force field is a mathematical expression and associated parameter set that describes the potential energy of a system of particles as a function of their nuclear coordinates [16]. In GROMACS, the potential functions are distinct from the parameters used within those functions, and care must be taken to use consistent sets validated together [16]. The functional form typically divides interactions into bonded terms (connecting atoms via chemical bonds) and non-bonded terms (describing interactions between all atoms, typically modeled with Lennard-Jones and Coulomb potentials) [17].
Table 1: Major Force Field Families Available in GROMACS
| Force Field | Type | Key Characteristics | Recommended Use Cases |
|---|---|---|---|
| AMBER (e.g., AMBER99SB-ILDN) [16] [18] | All-atom | Includes correction maps (CMAP) for improved backbone torsion; parameters suitable for proteins and nucleic acids. | All-atom simulation of proteins; requires -nocmap with pdb2gmx to disable CMAP if undesired. |
| CHARMM (e.g., CHARMM36) [16] [18] | All-atom | Extensive validation for proteins, lipids, nucleic acids; uses CMAP corrections. | Membrane proteins; lipid bilayers; requires specific non-bonded settings (e.g., force-switch modifier). |
| GROMOS (e.g., 54A7) [16] [18] | United-atom | Parametrized with twin-range cut-off; aliphatic hydrogens are not explicitly represented. | United-atom setups; use with caution with modern integrators due to potential density deviations [16]. |
| OPLS/AA [16] [18] | All-atom | Optimized for liquid simulations; transferable parameters. | Organic molecules; condensed phase systems. |
Application Protocol: Force Field Selection and Implementation
Protocol 1: Selecting and Implementing a Force Field in GROMACS
- Assess System Requirements: Choose a force field appropriate for your biomolecular system and the properties of interest. For general all-atom simulations, AMBER99SB-ILDN or CHARMM36 are recommended starting points [16]. Consistency between the force field's intended use and your simulation conditions is paramount.
- Obtain Topology: Use
gmx pdb2gmxto process your initial coordinate file (.pdb) and generate a molecular topology using your selected force field. For molecules not recognized by pdb2gmx, utilize specialized tools such as the Automated Topology Builder (ATB) for GROMOS, SwissParam for CHARMM, or antechamber/acpype for AMBER GAFF parameters [19]. - Verify Compatibility: Ensure your simulation parameters (.mdp settings) match the force field's intended use. For example:
- CHARMM36: Requires specific non-bonded settings:
constraints = h-bonds,cutoff-scheme = Verlet,vdwtype = cutoff,vdw-modifier = force-switch,rlist = 1.2,rvdw = 1.2,rvdw-switch = 1.0,coulombtype = PME,rcoulomb = 1.2, andDispCorr = no(for bilayers) [18]. - GROMOS-96: Was parametrized with a Lennard-Jones cut-off of at least 1.4 nm; ensure
rvdwis set to at least this value [16].
- CHARMM36: Requires specific non-bonded settings:
- Avoid Force Field Mixing: Never mix parameters from different force field families, as this leads to unphysical results and unreliable data [17].
Periodic Boundary Conditions: Simulating an Infinite System
Periodic boundary conditions (PBC) are employed to minimize edge effects in a finite simulation system [20]. The atoms are placed in a space-filling unit cell (the "box"), which is surrounded by translated copies of itself, creating an infinite periodic lattice that eliminates vacuum interfaces [20]. GROMACS uses the minimum image convention, meaning that for short-range non-bonded interactions, each atom only interacts with the single closest image of any other atom in the periodic lattice [20]. The program supports general triclinic boxes, which include special cases like cubes, rhombic dodecahedra, and truncated octahedra [20].
Table 2: Common Box Types and Their Properties in GROMACS
| Box Type | Image Distance | Relative Volume | Box Vectors | Application |
|---|---|---|---|---|
| Cubic | (d) | (d^3) (100%) | (ax=ay=a_z=d); Angles=90° | Simple systems; crystals. |
| Rhombic Dodecahedron (xy-square) | (d) | (\frac{1}{\sqrt{2}}d^3 \approx 0.71\,d^3) (71%) | (ax=d, ay=d, a_z=\frac{\sqrt{2}}{2}d); Angles=90° | Spherical solutes (e.g., globular proteins in water); minimizes number of solvent atoms. |
| Truncated Octahedron | (d) | (\frac{4}{9}\sqrt{3}d^3 \approx 0.77\,d^3) (77%) | Complex vector definitions [20] | Spherical solutes; slightly more isotropic than rhombic dodecahedron. |
Application Protocol: Implementing Periodic Boundary Conditions
Protocol 2: Setting Up Periodic Boundary Conditions
- Box Shape Selection: For simulating a approximately spherical solute (like a protein) in solution, use a rhombic dodecahedron box to reduce the number of required solvent molecules by approximately 29% compared to a cubic box, significantly lowering computational cost [20].
- Box Size Determination: The box must be large enough so that the cut-off radius (Rc) satisfies: [ Rc < \frac{1}{2} \min(\|\mathbf{a}\|, \|\mathbf{b}\|, \|\mathbf{c}\|) ] to prevent atoms from interacting with multiple images of the same particle [20]. Furthermore, the box length in any direction should exceed the length of the macromolecule in that direction plus twice the cut-off radius to prevent a solvent molecule from "seeing" both sides of the macromolecule [20].
- Box Creation and Solvation:
- Use
gmx editconfto define a box of appropriate size and shape around your solute molecule. - Use
gmx solvateto fill the box with solvent molecules (e.g., water).
- Use
- Trajectory Visualization and Analysis: Be aware that GROMACS stores particle coordinates within a brick-shaped volume for efficiency, even when using a triclinic box. Use
gmx trjconvto convert the trajectory for visualization or analysis in the desired unit-cell representation [20].
Integrators: The Engine of Molecular Dynamics
Integrators are numerical algorithms that solve Newton's equations of motion to update particle positions and velocities over time [21] [7]. The choice of integrator and its associated parameters (notably the time step dt) dictates the stability, accuracy, and efficiency of the simulation [21]. GROMACS offers a variety of integrators for different types of simulations, including dynamics, energy minimization, and other specialized calculations [21].
Table 3: Key Integrators and Energy Minimization Algorithms in GROMACS
| Algorithm | Type | Key Features | Typical Application |
|---|---|---|---|
| md (leap-frog) [21] | Dynamics (Integrator) | Default; efficient; sufficient accuracy for most production simulations. | Standard production MD. |
| md-vv (velocity Verlet) [21] | Dynamics (Integrator) | More accurate for Nose-Hoover/Parrinello-Rahman coupling; slightly more expensive. | Advanced sampling; NVE simulations. |
| sd (stochastic dynamics) [21] | Dynamics (Integrator) | Leap-frog stochastic dynamics; acts as a thermostat; friction set by tau-t. |
Simulating canonical ensemble (NVT). |
| steep (steepest descent) [21] [22] | Energy Minimization | Robust; follows the direction of the negative gradient. | Initial energy minimization. |
| cg (conjugate gradient) [21] [22] | Energy Minimization | More efficient than steepest descent for later minimization stages. | Refined energy minimization. |
Application Protocol: Configuring the Integrator
Protocol 3: Setting Up the Integrator for MD Simulation
- Select Integration Algorithm: For standard production MD, use
integrator = md(leap-frog) [21]. For constant NVE simulations or with advanced thermostats/barostats, considerintegrator = md-vv(velocity Verlet) for improved accuracy [21]. - Choose Time Step (
dt):- The time step is limited by the fastest motions in the system, typically bond vibrations involving hydrogen atoms.
- A safe rule of thumb is to set
dtto 1-2 fs for all-atom simulations with bond constraints applied to hydrogen-heavy atom bonds (constraints = h-bonds) [17]. - To enable a larger time step (e.g., 4 fs),
mass-repartition-factorcan be used to scale the masses of the lightest atoms (typically hydrogens), though this modifies the dynamics [21].
- Set Simulation Length (
nsteps):- The total simulated time is
nsteps * dt. - Plan
nstepsbased on the biological process of interest (e.g., nanoseconds for local side-chain motions, microseconds to milliseconds for large conformational changes).
- The total simulated time is
- Remove Center-of-Mass Motion:
- Energy Minimization:
Table 4: Key Research Reagent Solutions for GROMACS Simulations
| Reagent/Resource | Function/Purpose | Implementation Notes |
|---|---|---|
| Molecular Topology (.top) [23] | Defines all interactions (bonded, non-bonded) for molecules in the system. | Generated by gmx pdb2gmx or external tools (ATB, CHARMM-GUI, acpype). Uses #include statements to incorporate force field and molecule definitions. |
| Molecular Structure (.gro/.pdb) [23] | Contains initial atomic coordinates, velocities, and box vectors. | The .gro format is native to GROMACS and can store velocities. |
| MD Parameters (.mdp) [23] | Configuration file specifying all simulation parameters (integrator, temperature, pressure, cut-offs, etc.). | A sample mdp file is provided in the GROMACS documentation as a starting point. |
| Run Input File (.tpr) [23] | Portable binary containing all information needed to run a simulation. | Generated by gmx grompp, which processes the .gro, .top, and .mdp files. This is the input for gmx mdrun. |
GROMACS Distribution share/top dir [19] |
Contains force field parameter files (.itp), atom type definitions, and default parameters (e.g., vdwradii.dat). |
Files can be customized by placing a modified copy in the working directory, which overrides the default. |
The foundation of a reliable molecular dynamics (MD) simulation in GROMACS lies in the meticulous preparation of initial structures. This protocol provides a standardized, step-by-step methodology for converting experimental Protein Data Bank (PDB) files into simulation-ready coordinate and topology files. The procedures outlined herein cover structure preprocessing, force field selection, topology generation, system solvation, and ion neutralization—critical steps ensuring physical accuracy and simulation stability. Designed for researchers and drug development professionals, this guide establishes a robust workflow for preparing biomolecular systems, forming an essential component of a comprehensive MD simulation framework.
Molecular dynamics simulations serve as a powerful computational tool for studying biomolecular structure, dynamics, and function at atomic resolution. The initial setup phase, particularly the preparation of accurate coordinate and topology files, profoundly influences simulation outcomes and their biological relevance [15]. The process transforms experimental structural data from PDB files into a computational model that incorporates appropriate atomic interactions through empirically-derived force fields.
The GROMACS simulation package, renowned for its computational efficiency and comprehensive toolset, requires specific file formats and system definitions to function optimally [24]. This protocol addresses the conversion pipeline, emphasizing the critical decisions researchers must make regarding force field selection, protonation states, and system neutralization—factors that collectively determine the physical fidelity of the resulting simulation.
Table 1: Essential computational tools and files for MD system preparation
| Resource Type | Specific Examples | Function/Purpose |
|---|---|---|
| Structure Files | PDB (.pdb), GROMACS format (.gro) | Store atomic coordinates and system structural information [23] |
| Topology Files | GROMACS topology (.top), Include topology (.itp) | Define molecular parameters, bonding, force field, and atomic charges [15] |
| Simulation Parameters | Molecular Dynamics Parameter file (.mdp) | Specify simulation conditions and algorithms [15] |
| Visualization Software | RasMol, Avogadro | Visual inspection of protein structure and graphics rendering [15] |
| Text Editors | Gedit, vi, emacs | Edit PDB files, update topology files, and modify input parameter files [15] |
| Force Field Databases | AMBER, CHARMM, OPLS-AA, GROMOS | Provide parameter sets for bonded and non-bonded interactions [25] |
Theoretical Framework: Molecular Dynamics and Force Fields
Molecular Dynamics Fundamentals
MD simulations numerically solve Newton's equations of motion for all atoms in the system: [ mi\frac{d^2 \mathbf{r}i}{dt^2} = -\frac{\partial V}{\partial \mathbf{r}i} = \mathbf{F}i ] where (mi) is the mass of atom (i), (\mathbf{r}i) its position, and (\mathbf{F}_i) the force acting upon it derived from the potential energy function (V) [7]. The velocity Verlet algorithm typically integrates these equations, progressing the system through discrete time steps (usually 1-2 fs) [17].
Force Field Composition
The potential energy function (V) (force field) encompasses both bonded and non-bonded interactions [17]:
[
V = V{\text{bonded}} + V{\text{non-bonded}}
]
[
V{\text{bonded}} = \sum{\text{bonds}} kb(r - r0)^2 + \sum{\text{angles}} k\theta(\theta - \theta0)^2 + \sum{\text{dihedrals}} k\phi[1 + \cos(n\phi - \delta)]
]
[
V{\text{non-bonded}} = \sum{i
Table 2: Common force fields available in GROMACS and their applications
| Force Field | Best Applications | Water Model Compatibility |
|---|---|---|
| AMBER99SB-ILDN | Proteins, nucleic acids | TIP3P, SPC/E |
| CHARMM27 | Proteins, lipids, nucleic acids | TIP3P (modified) |
| OPLS-AA | Organic molecules, proteins | TIP4P, SPC |
| GROMOS 54A7 | Biomolecular condensed phases | SPC |
Diagram 1: Complete workflow for preparing simulation-ready structures in GROMACS
Detailed Experimental Protocol
Initial Structure Acquisition and Preprocessing
Procedure:
- Obtain protein coordinates from the RCSB Protein Data Bank (http://www.rcsb.org/) [15]:
- Visually inspect the structure using molecular visualization software (e.g., RasMol) to identify non-protein components, structural anomalies, and missing residues.
- Remove heteroatoms and crystallographic water molecules that may interfere with subsequent solvation: Note: Waters are removed at this stage since the system will be explicitly solvated later in the protocol [24].
Force Field Selection and Topology Generation
Procedure:
- Execute the
pdb2gmxcommand to generate topology and processed coordinate files: - Select an appropriate force field when prompted. For proteins, AMBER99SB-ILDN or CHARMM27 are generally recommended [24] [17].
- Choose a water model consistent with the selected force field (e.g., TIP3P for AMBER, TIP4P for OPLS-AA) [25].
- Specify protonation states for histidine, aspartic acid, glutamic acid, and other residues with titratable groups. The
-interflag enables interactive selection [25]. - Verify the output files:
conf.gro: Processed coordinates in GROMACS formattopol.top: System topology with force field parametersposre.itp: Position restraint file (if needed)
System Solvation and Neutralization
Procedure:
- Define simulation box using
editconf: Note: The-d 1.4flag creates a 1.4 nm buffer between the protein and box edge, while-ccenters the protein [15]. - Solvate the system with water molecules using
solvate: - Generate preprocessed run input file for ion addition:
- Neutralize system charge by adding counterions:
Note: The
-neutralflag automatically adds sufficient ions to neutralize the system net charge [15].
Critical Parameters and Troubleshooting
Table 3: Troubleshooting common issues during structure preparation
| Problem | Potential Cause | Solution |
|---|---|---|
pdb2gmx fails with"atom not found" |
Missing atoms in input structure or non-standard residues | Use -missing flag to bypass or manually add missing atoms to PDB file [25] |
| System has net charge | Lack of counterions for charged biomolecules | Ensure gmx genion is executed with -neutral flag to add appropriate counterions [15] |
| Unphysical energiesduring minimization | Atom overlaps, incorrect protonation states, or inappropriate force field parameters | Verify protonation states, check for steric clashes, and ensure force field compatibility with molecule type [26] |
| Water moleculesinside hydrophobic core | Incomplete removal of crystallographic waters before solvation | Remove all HOH records from original PDB before running pdb2gmx [24] |
Expected Outcomes and Validation
Upon successful completion of this protocol, researchers will obtain the following essential files for GROMACS simulations:
- Final coordinate file (
protein_ions.gro): Contains the fully solvated and neutralized system with proper periodic boundary conditions. - Complete topology file (
topol.top): Includes all force field parameters, molecular definitions, and interaction potentials for the system. - Position restraint file (
posre.itp): Optional file for restraining heavy atoms during equilibration.
The resulting system should be characterized by zero net charge, appropriate dimensions to prevent artificial periodicity artifacts, and physically realistic protonation states at the desired simulation pH. The topology should correctly represent all bonded and non-bonded interactions according to the selected force field.
Applications in Drug Development
For drug development professionals, this structure preparation protocol enables the investigation of protein-ligand interactions through MD simulations. Proper topology generation is particularly crucial when incorporating small molecule therapeutics, which often require specialized parameterization using tools like CGenFF for CHARMM force fields or Antechamber for AMBER force fields [27]. The resulting simulation systems facilitate binding affinity calculations, allosteric mechanism studies, and structure-based drug design—all dependent on the initial structural accuracy established through this protocol.
Defining the Simulation Box and Solvation Models
In molecular dynamics (MD) simulations using GROMACS, proper system preparation is a critical foundation for obtaining physically meaningful and reliable results. Two of the most fundamental steps in this process are defining the simulation box and solvating the system. The simulation box establishes the periodic boundary conditions that mimic a continuous environment from a finite system, while solvation places the solute molecule in a biologically relevant solvent environment, typically water. These steps significantly impact simulation stability, computational cost, and the accuracy of subsequent analyses. This Application Note provides detailed protocols and quantitative guidance for researchers, scientists, and drug development professionals to correctly implement these crucial procedures within the GROMACS framework.
Theoretical Background
The Role of Periodic Boundary Conditions
Molecular dynamics simulations employ periodic boundary conditions (PBC) to avoid edge effects and simulate a more natural, infinite environment [28]. Under PBC, the simulation box is replicated infinitely in all directions. When a particle exits the central box through one face, it simultaneously re-enters through the opposite face [28]. This approach ensures that the number of particles remains constant and eliminates vacuum interfaces that would otherwise create unnatural forces.
The simulation box shape and dimensions must be carefully selected to balance computational efficiency with biological relevance. For globular proteins, the box should provide sufficient solvent padding around the solute to prevent artificial interactions between periodic images. For membrane proteins or elongated structures, box dimensions must accommodate the specific architecture while minimizing unnecessary solvent that increases computational burden.
Solvation Principles and Solvent Models
Solvation involves immersing the solute molecule in solvent particles to create a biologically relevant environment. The gmx solvate tool in GROMACS performs this operation by filling the simulation box with solvent molecules, typically water, while removing any that clash with the solute atoms [29]. The program identifies clashes by comparing interatomic distances against a database of van der Waals radii (vdwradii.dat), which are scaled by a factor (default: 0.57) to achieve proper density [29].
GROMACS supports various 3-site water models, with Simple Point Charge (SPC) water as the default [29]. The program uses coordinates from $GMXLIB/spc216.gro, which can also serve as a starting point for other 3-site water models after brief equilibration [29]. The solvation process can also incorporate ions to neutralize system charge or achieve specific physiological concentrations.
Research Reagent Solutions
Table 1: Essential Components for Simulation Box Setup and Solvation
| Component | Description | Function |
|---|---|---|
| GROMACS Suite | Molecular dynamics simulation package | Provides all necessary tools (gmx solvate, gmx editconf) for system preparation [29] |
| Solvent Coordinate File | Pre-equilibrated solvent system (e.g., spc216.gro) |
Supplies pre-configured solvent molecules for solvation [29] |
| Force Field | Parameter set defining molecular interactions (e.g., OPLS/AA) | Determines van der Waals radii, atomic charges, and bonding parameters [2] |
| vdwradii.dat | Database of van der Waals radii | Contains atomic radii used for clash detection during solvation [29] |
| Topology File | Molecular structure definition (.top) | Defines molecular composition and connectivity; updated with solvent molecule count [29] |
Quantitative Parameters for System Setup
Table 2: Critical Parameters for gmx solvate Command
| Parameter | Default Value | Recommended Range | Description | Impact on Simulation |
|---|---|---|---|---|
| -scale | 0.57 | 0.5-0.6 | Scale factor for van der Waals radii from vdwradii.dat [29] | Lower values increase solvent density; 0.57 yields ~1000 g/L for proteins in water [29] |
| -radius | 0.105 [nm] | 0.1-0.15 [nm] | Default van der Waals distance for atoms not in database [29] | Affects solvent placement and system density |
| -shell | 0 [nm] | 0.8-1.5 [nm] | Thickness of water layer around solute [29] | Thicker layers reduce periodicity artifacts but increase system size |
| -maxsol | 0 (unlimited) | ≥0 | Maximum number of solvent molecules to add [29] | Non-zero values create voids; generally avoid for complete solvation |
| -box | (0 0 0) | Variable | Box size vector in nm [29] | Determines system volume; set explicitly or from solute coordinate file |
Experimental Protocols
Workflow for System Preparation
Figure 1: Comprehensive workflow for preparing a solvated system in GROMACS, beginning with a solute structure and progressing through topology generation, boxing, solvation, and equilibration.
Protocol 1: Defining the Simulation Box
Objective: Create an appropriately sized and shaped simulation box around a solute molecule.
Materials:
- Input structure file (GRO format) from
gmx pdb2gmxor similar - GROMACS installation with
gmx editconftool
Method:
- Center the solute: Use
gmx editconfto center the molecule in the box: The-cflag centers the structure in the box [29].
Define box dimensions and type: Select an appropriate box type and size:
- Box type (
-bt): Common choices include:cubic: Simple cubic box (default)dodecahedron: Rhombic dodecahedron (most efficient for globular proteins) [2]octahedron: Truncated octahedron
- Distance (
-d): Set the minimum distance (nm) between the solute and box edge [2]. For most proteins, 1.0-1.5 nm is sufficient.
- Box type (
Alternative explicit box dimensions: For specific dimension requirements:
This creates a rectangular box of specified dimensions (x, y, z in nm).
Troubleshooting:
- For elongated molecules, use rectangular boxes with custom dimensions
- For membrane simulations, ensure box dimensions match lipid bilayer dimensions
- Verify box size using
gmx checkor visualization tools
Protocol 2: System Solvation
Objective: Fill the simulation box with solvent molecules while removing clashes with solute atoms.
Materials:
- Boxed solute structure (GRO format)
- Topology file (TOP format)
- Solvent coordinate file (default:
spc216.gro)
Method:
- Basic solvation command:
-cp: Input solute coordinate file-cs: Input solvent coordinate file (uses SPC water by default) [29]-p: Topology file (will be updated with solvent molecule count)-o: Output solvated coordinate file
Advanced solvation with hydration shell:
The
-shellparameter adds a water layer of specified thickness (nm) around the solute, which is particularly useful for spherical systems [29].Custom van der Waals parameters:
Validation:
- Check the solvation log file for the number of solvent molecules added
- Verify the topology file has been updated with the correct solvent count
- Visually inspect the solvated system using molecular visualization software
- Run a brief energy minimization to resolve any remaining steric clashes
Protocol 3: Aqueous Solvation with Ion Addition
Objective: Solvate the system and add ions to neutralize charge and achieve physiological concentration.
Materials:
- Solvated system (GRO and TOP files)
- Ion topology parameters (included in force field)
- GROMACS
gmx geniontool
Method:
- Prepare input for ion addition:
- Replace solvent molecules with ions:
-pname/-nname: Specify positive and negative ion names (force field dependent)-neutral: Add ions to neutralize system charge [2]-conc: Add additional ions to achieve specific molar concentration (e.g., 0.15 M for physiological saline)
Considerations:
- For systems with net charge, additional counterions will be added automatically during neutralization
- Select ion names compatible with your chosen force field (e.g., NA+/CL- for OPLS/AA)
- The program will prompt for a group to replace with ions; typically select "SOL"
Applications in Drug Development
Proper solvation protocols are particularly crucial in pharmaceutical applications where accurate representation of molecular interactions directly impacts predictive capabilities. In drug delivery research, MD simulations help optimize carrier systems like functionalized carbon nanotubes, chitosan-based nanoparticles, and human serum albumin (HSA) by providing atomic-level insights into drug encapsulation, stability, and release processes [30]. Accurate solvation ensures reliable prediction of solubility, permeation, and binding affinities for anticancer drugs including Doxorubicin (DOX), Gemcitabine (GEM), and Paclitaxel (PTX) [30].
For drug binding studies, sufficient solvent padding (typically ≥1.0 nm) prevents artificial interactions between periodic images of the protein-ligand complex. The choice of water model (SPC, SPC/E, TIP3P, TIP4P) should align with the selected force field to maintain consistency with parameterization assumptions. These considerations significantly impact the accuracy of binding free energy calculations and residence time predictions used in rational drug design.
A Step-by-Step GROMACS Simulation Workflow: From Energy Minimization to Production
In molecular dynamics (MD) simulations, the topology defines the system's physical structure and potential energy surface. It comprehensively describes the molecules within the system, including their atomic composition, chemical connectivity, and the force field parameters governing their interactions. This document provides a detailed protocol for constructing molecular topologies and defining force field parameters within the GROMACS MD package, forming a critical step in accurate simulation setup.
Force Field Selection
The force field provides the mathematical functions and parameters used to calculate the potential energy of the system. GROMACS includes numerous pre-parameterized force fields, each with specific strengths and intended applications [31].
Table 1: Standard Force Fields Distributed with GROMACS [31]
| Force Field Family | Specific Versions | Typical Application Domain |
|---|---|---|
| AMBER | AMBER03, AMBER94, AMBER96, AMBER99, AMBER99SB, AMBER99SB-ILDN | Proteins, nucleic acids, general biomolecules |
| CHARMM | CHARMM27 | All-atom simulations, proteins, lipids, nucleic acids (includes CMAP for proteins) |
| GROMOS | 43a1, 43a2, 45a3, 53a5, 53a6, 54a7 | United-atom simulations, lipids, biomolecular condensed phases |
| OPLS | OPLS-AA/L | All-atom simulations, liquid systems, proteins |
Selecting an appropriate force field is a foundational decision. The choice should be guided by the system's composition (e.g., protein, DNA, membrane) and the properties of interest, ensuring compatibility with the chosen water model [32]. Researchers are encouraged to consult the literature for force fields validated for their specific type of molecule or phenomenon.
Topology Construction Workflow
The process of building a system topology involves translating a molecular structure from coordinates into a GROMACS-readable description of molecules and their interactions. The following diagram illustrates the logical workflow for this process.
Generating Topologies for Standard Molecules
For standard biomolecules like proteins and nucleic acids, the pdb2gmx tool automates topology generation.
- Preprocess Input Structure: Clean your initial PDB file by removing crystallographic waters, ions, or other non-essential molecules. For example, to remove waters, use:
- Execute
pdb2gmx: During execution, the program will interactively prompt you to select a force field and a water model from the available options [24]. This ensures self-consistent parameter sets. - Analyze Outputs:
pdb2gmxgenerates three key files:topol.top: The main topology file containing molecule definitions and force field inclusions.processed.gro: The processed coordinates in GROMACS format.posre.itp: A file containing position restraints for the heavy atoms, which can be used during equilibration.
Handling Non-Standard Molecules and Ligands
Molecules not defined in the force field's residue database (e.g., drugs, cofactors, novel linkers) require manual parametrization. The general principle is to use small model compounds and piece the larger topology together, rather than parametrizing a huge molecule in one step [33].
- Obtain Initial Structure: Acquire or draw the 3D structure of your ligand (e.g., in MOL2 format).
- Generate Parameters: Use specialized external tools such as:
- CGenFF: For the CHARMM force field family.
- ACPYPE (AnteChamber PYthon Parser interfacE) or antechamber: For the AMBER force field family.
- Automated Topology Builder (ATB): For the GROMOS force field family.
- Incorporate Parameters: Manually integrate the generated parameters into your system topology. This typically involves:
- Adding new
[ atomtypes ]if needed. - Including a new
.itpfile for the ligand molecule. - Adding the ligand to the
[ molecules ]directive in the main.topfile.
- Adding new
Topology File Structure and Parameter Definition
The GROMACS topology file is highly structured. Understanding its components is essential for verification and modification.
Anatomy of a Topology File
A typical .top file, as generated by pdb2gmx, contains the following sections [34] [24]:
#include "forcefield.itp": This statement imports all the core parameters for the chosen force field [31].[ moleculetype ]: Defines a molecule and the number of bonds (nrexcl) for non-bonded neighbor exclusion.[ atoms ]: Lists every atom in the molecule, specifying its type, residue, charge, and mass.[ bonds ],[ angles ],[ dihedrals ]: Define the covalent connectivity and associated parameters.[ system ]and[ molecules ]: Declare the name of the entire system and list the constituent molecules and their counts.
Modifying and Adding Parameters
Force field parameters are not static; they can be modified or extended to improve accuracy or cover new chemical species.
Changing Existing Bonded Parameters: To alter parameters for specific interactions, add the new parameter definition after the force field inclusion in the topology. GROMACS uses the last definition it encounters [31].
Adding New Atom Types: New atom types can be defined in an extra
[ atomtypes ]section following the force field inclusion. After defining the type, additional[ nonbond_params ]can be specified [31].Defining Non-Bonded Interactions: The interpretation of the
VandWparameters in[ atomtypes ]and[ nonbond_params ]depends on the combination rule defined in the[ defaults ]section [35]. For combination rule 1,Vis C6 andWis C12, whereas for rules 2 and 3,Vis σ andWis ε.
Table 2: Key File Types in Force Field Directories [31] [35]
| Filename | Purpose and Content |
|---|---|
forcefield.itp |
Main file; includes other files and sets default non-bonded rules. |
ffnonbonded.itp |
Contains [ atomtypes ] and [ nonbond_params ] for van der Waals interactions. |
ffbonded.itp |
Contains [ bondtypes ], [ angletypes ], [ dihedraltypes ], etc. |
.rtp (Residue Topology) |
Contains standardized building blocks (residues) used by pdb2gmx. |
.atp |
Atom type database containing masses. |
.hdb |
Hydrogen database for adding hydrogens during pdb2gmx execution. |
Table 3: Research Reagent Solutions for Topology Construction
| Tool / Resource | Type | Primary Function |
|---|---|---|
gmx pdb2gmx |
GROMACS Module | Generates topologies and processed coordinates for standard proteins/nucleic acids from PDB files [24]. |
| CHARMM-GUI | Web Server | Prepares complex simulation systems, including membranes and solutions, with CHARMM/AMBER force fields [32]. |
| Automated Topology Builder (ATB) | Web Server | Provides and validates molecular topologies for the GROMOS force field family [32]. |
| ACPYPE | Software Tool | Converts AMBER force field parameters (from antechamber) into GROMACS-compatible .itp files [32]. |
| CGenFF | Web Server/Software | Generates parameters for drug-like molecules within the CHARMM force field ecosystem [36]. |
vdwradii.dat |
Database File | Contains van der Waals radii for atom types; used by solvate and other tools. Can be customized by user [32]. |
A correctly constructed topology is the bedrock of a meaningful and stable MD simulation. This protocol has outlined the critical steps: from selecting a validated force field, to generating topologies for standard and non-standard molecules, and finally to understanding the topology file structure for manual verification and modification. Meticulous attention at this preparatory stage prevents common simulation failures and ensures the physical realism of the computed trajectories, thereby laying the groundwork for robust scientific conclusions.
In molecular dynamics (MD) simulations, the initial configuration of a system, often derived from experimental structures, may contain steric clashes or inappropriate geometry due to discrete atom placement, preceding mutations, or other manipulations [37]. These structural imperfections result in excessively high potential energy, which, if unaddressed, can cause simulation instability and integration failure [38]. Energy minimization (EM) serves as the critical first computational step to relieve these strains by iteratively adjusting atomic coordinates to find a local energy minimum on the potential energy surface [39]. This process removes all kinetic energy, providing a low-energy, stable starting configuration essential for subsequent simulation steps, including equilibration and production MD [38]. Performing EM is a foundational practice within the GROMACS MD workflow, ensuring the system's mechanical stability before introducing thermal motion.
Theoretical Foundation of Energy Minimization
Energy minimization algorithms operate by searching for configurations where the net force on each atom approaches zero. The potential energy ( V ) of a system is a function of the coordinates of all ( N ) atoms, ( \mathbf{r}1, \mathbf{r}2, \ldots, \mathbf{r}N ). The force on each atom ( i ) is the negative gradient of this potential: ( \mathbf{F}i = - \frac{\partial V}{\partial \mathbf{r}_i} ) [38]. The minimization is considered successful when the maximum absolute value of any force component in the system falls below a user-specified tolerance, ( \epsilon ) [39]. A reasonable value for ( \epsilon ) can be estimated from the root mean square force of a harmonic oscillator at a given temperature. For a weak oscillator at 1 K, this force is approximately 7.7 kJ mol⁻¹ nm⁻¹, thus a practical ( \epsilon ) value is typically between 1 and 1000 kJ mol⁻¹ nm⁻¹, depending on the desired precision and the system's intended purpose [39].
Table 1: Core Algorithms for Energy Minimization in GROMACS
| Algorithm | Key Principle | Advantages | Limitations | Typical Use Case |
|---|---|---|---|---|
| Steepest Descent [39] | Moves atoms in the direction of the negative gradient (force). The step size is adjusted heuristically. | Robust, easy to implement, effective for initial steps away from high-energy structures. | Slow convergence near the energy minimum. | Initial relaxation of systems with steric clashes. |
| Conjugate Gradient [39] | Uses a sequence of non-interfering (conjugate) directions for successive steps. | More efficient than Steepest Descent closer to the minimum. | Cannot be used with constraints (e.g., rigid water models). | Minimization prior to normal-mode analysis. |
| L-BFGS [39] | A quasi-Newton method that approximates the inverse Hessian matrix from a history of previous steps. | Fastest convergence for large systems in practice. | Not yet parallelized; requires more memory per step. | General-purpose minimization for large biomolecular systems. |
Practical Implementation in GROMACS
Parameter Selection in the MDP File
The control parameters for energy minimization in GROMACS are defined in the molecular dynamics parameter (mdp) file. The choice of algorithm is specified via the integrator directive [21]. Key parameters common to all minimizers include emtol, the force tolerance for convergence (default: 10.0 kJ mol⁻¹ nm⁻¹), and nsteps, the maximum number of steps allowed (default: -1, meaning no limit) [21]. For the Steepest Descent algorithm, the emstep parameter defines the initial maximum displacement (in nm) [39] [21].
Table 2: Key MDP Parameters for Energy Minimization
| Parameter | Value for Steepest Descent | Value for Conjugate Gradient | Value for L-BFGS | Description |
|---|---|---|---|---|
integrator |
steep |
cg |
l-bfgs |
Selects the minimization algorithm [21]. |
emtol |
10.0 | 10.0 | 10.0 | Force tolerance for convergence (kJ mol⁻¹ nm⁻¹) [21]. |
nsteps |
-1 | -1 | -1 | Maximum number of minimization steps [21]. |
emstep |
0.01 | N/A | N/A | Initial maximum step size for Steepest Descent (nm) [21]. |
nstcgsteep |
N/A | 1000 | N/A | Frequency of steepest descent steps within CG [21]. |
Executing the Minimization
The minimization run is executed using the mdrun program. The command and associated steps are consistent across different types of simulations.
This will produce output files including em.gro (minimized structure), em.trr (trajectory), em.edr (energy file), and em.log (log file).
Analysis of Results and Convergence Criteria
A successful energy minimization is characterized by convergence, where the potential energy reaches a stable, negative value and the maximum force in the system (Fmax) falls below the specified emtol [37]. For a typical protein in water, the potential energy (Epot) should be negative and on the order of 10⁵–10⁶ kJ/mol, a value that scales with the system size and the number of water molecules [37]. The log file (em.log) reports the Fmax and Epot at each step and upon completion, which must be checked to verify success.
It is possible for the minimization to reach the maximum number of steps (nsteps) with a reasonable Epot but with Fmax still above emtol. This indicates non-convergence and suggests the system may be unstable for subsequent equilibration. In such cases, the minimization should be continued by using the output structure (em.gro) as a new starting point, potentially with an increased nsteps or a adjusted step size [37].
The following diagram illustrates the decision-making workflow for performing and validating energy minimization, integrating the choice of algorithm and convergence checks.
The Scientist's Toolkit: Essential Materials and Reagents
Table 3: Key Research Reagent Solutions for Energy Minimization
| Item | Function/Description | Example/Format |
|---|---|---|
| Initial Coordinate File | Defines the initial 3D atomic structure of the system. | GRO file, PDB file [37]. |
| Topology File | Defines the chemical makeup, connectivity, and force field parameters of the molecules in the system. | TOP file [21]. |
| Molecular Dynamics Parameters (MDP) File | A text file specifying all control parameters for the simulation, including the choice of integrator and convergence criteria. | MDP file [21]. |
| Force Field | A set of mathematical functions and parameters defining the potential energy of the system. Examples include CHARMM, AMBER, and GROMOS. | Included in topology and parameter files [38]. |
| GROMACS Executables | The software suite used to preprocess the input (gmx grompp) and run the minimization (gmx mdrun). |
GROMACS installation [13]. |
In molecular dynamics (MD) simulations, the process of equilibration is critical for achieving stable, production-ready systems that accurately represent physiological or experimental conditions. Equilibration involves bringing a system to a desired thermodynamic state before data collection begins. This process typically occurs in two sequential phases: first under the NVT ensemble (constant Number of particles, Volume, and Temperature), followed by the NPT ensemble (constant Number of particles, Pressure, and Temperature). The NVT ensemble, also known as the canonical ensemble, allows the system to thermally relax and stabilize at the target temperature. The subsequent NPT ensemble, or isothermal-isobaric ensemble, allows the system density to adjust while maintaining constant pressure, which most closely resembles experimental conditions [40]. Proper execution of both equilibration phases is essential for preventing non-physical behavior, corrupted trajectories, or complete simulation failure [41].
Theoretical Foundation of Ensemble Equilibration
The NVT (Canonical) Ensemble
The NVT ensemble maintains a constant number of particles (N), fixed volume (V), and constant temperature (T). During NVT equilibration, the system's temperature is stabilized through the application of thermostats that modulate atomic velocities. The temperature in MD simulations is computed from the total kinetic energy of the system using the equipartition theorem [42]. The role of a thermostat is not to maintain a perfectly constant temperature at every timestep, but rather to ensure the system achieves the correct average temperature with appropriate fluctuations around this average [42]. For a protein simulation in aqueous solution, typical NVT equilibration periods range from 50-100 picoseconds, though larger or more complex systems may require longer timescales [43] [41].
The NPT (Isothermal-Isobaric) Ensemble
The NPT ensemble maintains a constant number of particles (N), constant pressure (P), and constant temperature (T). This phase typically follows NVT equilibration and allows the system density to stabilize. Pressure in MD is calculated from both the kinetic energy and the virial contribution [42]. Similar to temperature, pressure exhibits significant fluctuations in MD simulations, and instantaneous pressure values are essentially meaningless. The pressure coupling algorithm (barostat) ensures the system maintains the correct average pressure over time [40]. This phase generally requires longer simulation time than NVT equilibration because pressure relaxation occurs more slowly than temperature stabilization [40].
Essential Parameters for Equilibration Protocols
Integration and Control Parameters
Table 1: Key Molecular Dynamics Parameters for System Equilibration
| Parameter Category | Specific Parameter | NVT Value/Range | NPT Value/Range | Function |
|---|---|---|---|---|
| Integrator | integrator |
md (leap-frog) |
md (leap-frog) |
Algorithm for integrating equations of motion |
| Time Parameters | dt |
0.001-0.002 ps | 0.001-0.002 ps | Integration time step |
nsteps |
50,000-100,000 | 250,000-500,000 | Number of integration steps | |
| Temperature Coupling | tcoupl |
V-rescale | V-rescale | Thermostat algorithm |
tau-t |
0.5-1.0 ps | 0.5-1.0 ps | Thermostat time constant | |
ref-t |
300 K (or target) | 300 K (or target) | Reference temperature | |
tc-grps |
Protein Non-Protein | Protein Non-Protein | Groups for temperature coupling | |
| Pressure Coupling | pcoupl |
No | C-rescale | Barostat algorithm |
tau-p |
- | 1.0-2.0 ps | Barostat time constant | |
ref-p |
- | 1.0 bar | Reference pressure | |
compressibility |
- | 4.5×10⁻⁵ bar⁻¹ | System compressibility | |
| Constraint Algorithm | constraints |
h-bonds | h-bonds | Bond constraint algorithm |
| Continuation | continuation |
No | Yes | Continue from previous simulation |
| Velocity Handling | gen_vel |
Yes | No | Generate initial velocities |
The Scientist's Toolkit: Essential Research Reagents and Materials
Table 2: Key Research Reagent Solutions for GROMACS Equilibration
| Reagent/Material | Function | Example Choices | Application Notes |
|---|---|---|---|
| Force Fields | Defines potential energy functions and parameters | GROMOS-96, OPLS-AA/L, CHARMM36, AMBER [44] [16] | Select based on system composition; GROMOS-96 for united-atom, OPLS-AA/L for all-atom simulations |
| Water Models | Solvation environment | SPC, TIP3P, TIP4P | TIP3P common for biomolecular systems; affects density (expected ~986 kg/m³ for pure TIP3P water) [40] |
| Thermostats | Temperature control | V-rescale, Nosé-Hoover, Berendsen | V-rescale recommended for correct fluctuations; avoid Berendsen for production runs [42] |
| Barostats | Pressure control | C-rescale, Parrinello-Rahman, Berendsen | C-rescale provides correct ensemble; Berendsen for initial equilibration only |
| Ion Parameters | System neutralization and physiological concentration | Na⁺, Cl⁻, K⁺, Mg²⁺, Ca²⁺ | Include appropriate ions for biological systems; affects electrostatic interactions |
| Position Restraints | Maintain protein structure during initial equilibration | posre.itp |
Applied to protein heavy atoms; force constants typically 1000 kJ/mol/nm² |
Detailed Experimental Protocols
NVT Equilibration Workflow
The following diagram illustrates the sequential workflow for NVT equilibration:
Step 1: Input Preparation
Begin with a properly energy-minimized system. The input structure is typically provided as a GRO file from the previous minimization step. Use the GROMACS grompp module to preprocess the simulation data:
The -r flag provides reference coordinates for position restraints, which are typically applied to protein heavy atoms during initial equilibration to maintain structural integrity while allowing solvent relaxation [43].
Step 2: Parameter Configuration Configure the NVT parameters in the molecular dynamics parameter (mdp) file. Key settings include:
integrator = md(leap-frog algorithm)dt = 0.002(2-fs time step, can be extended to 4-fs with hydrogen mass repartitioning)nsteps = 50000(100 ps simulation for 2-fs time step)gen_vel = yes(generate initial Maxwell-Boltzmann velocity distribution)gen_temp = 300(temperature for initial velocity generation)constraints = h-bonds(constrain bonds involving hydrogen atoms) [21]
Step 3: Temperature Coupling Setup Apply temperature coupling using the velocity-rescale (v-rescale) thermostat, which provides correct fluctuations and is robust for systems of various sizes [42]. Configure with:
tcoupl = v-rescaletau_t = 0.5-1.0(coupling time constant in ps)ref_t = 300(target temperature in Kelvin)tc-grps = Protein Non-Protein(couple protein and non-protein groups separately)
For systems with sufficient atoms, coupling the entire system as one group (tc-grps = System) is acceptable. However, for protein-water systems, separate coupling of protein and non-protein groups helps prevent the "hot solvent/cold solute" problem [42].
Step 4: Simulation Execution
Execute the NVT equilibration using the mdrun module:
The -deffnm option specifies the base filename for all input and output files. During execution, monitor the log file for any warnings or errors.
Step 5: Temperature Stability Analysis
After completion, analyze the temperature progression using the energy module:
Select the appropriate temperature term at the prompt. The resulting plot should show temperature fluctuations around the target value (e.g., 300 K) with a running average that plateaus. If the temperature has not stabilized, extend the NVT equilibration by running additional steps using the final output as the new input [43] [41].
NPT Equilibration Workflow
The following diagram illustrates the sequential workflow for NPT equilibration:
Step 1: Input Preparation Use the final coordinates from NVT equilibration and include the checkpoint file to maintain velocity continuity:
The -t nvt.cpt flag includes the checkpoint file from NVT equilibration, which preserves the system state including velocities [40].
Step 2: Parameter Configuration Configure the NPT parameters with additions for pressure coupling:
continuation = yes(continue from previous simulation)gen_vel = no(read velocities from trajectory)pcoupl = C-rescale(barostat algorithm)tau_p = 1.0-2.0(pressure coupling time constant)ref_p = 1.0(reference pressure in bar)compressibility = 4.5e-5(isothermal compressibility of water in bar⁻¹)
Maintain the temperature coupling parameters from the NVT simulation [40] [21].
Step 3: Simulation Execution Execute the NPT equilibration:
This phase typically requires 2-5 times longer than NVT equilibration (e.g., 500 ps) because pressure and density equilibration occurs more slowly than temperature stabilization [40].
Step 4: Pressure and Density Analysis Analyze both pressure and density to confirm equilibration:
For pressure, select the appropriate pressure term. The pressure will fluctuate widely (hundreds of bar for small systems), but the running average should converge to the reference pressure. Statistically, the average pressure should not be significantly different from the reference value when considering the standard deviation [40]. For a system of 216 water molecules, fluctuations of 500-600 bar are normal, decreasing with the square root of system size [42].
For density, the average value should stabilize. Note that the density of a protein-water system will differ from pure water (approximately 1000 kg/m³ for real water, 986 kg/m³ for TIP3P model water) [40]. The important criterion is stabilization of the density, not necessarily matching pure water values exactly.
Troubleshooting and Quality Assessment
Common Equilibration Issues and Solutions
Temperature instability: If the system temperature does not stabilize during NVT equilibration, extend the simulation time. For large systems or those with complex components, equilibration may require longer than 100 ps [41].
Excessive pressure fluctuations: Pressure naturally exhibits large fluctuations in MD simulations. For a small water box (216 molecules), fluctuations of 500-600 bar are standard. These decrease with system size (e.g., 50-60 bar for 21,600 water molecules) [42]. Focus on the running average rather than instantaneous values.
Non-physical density values: The simulated system density may not match experimental values exactly, particularly when non-water components are present. A protein-water system will naturally have a higher density than pure water [40]. The key metric is stabilization, not exact matching to reference values.
Simulation "blow-up": This occurs when excessively large forces cause integrator failure. This can result from improper prior minimization, incorrect parameters, or bad contacts. Return to energy minimization and ensure proper system setup [42].
Validation Metrics for Successful Equilibration
- Temperature: Running average fluctuates around reference value with reasonable variance [43] [41]
- Pressure: Average value matches reference within statistical uncertainty (e.g., -3 ± 11 bar matching 1 bar reference) [40]
- Density: Stable running average, though exact value depends on system composition [40]
- Potential energy: Stable without drifts or abrupt changes
- Root mean square deviation (RMSD): Protein backbone RMSD begins to plateau, indicating structural relaxation
Integration with Production Simulations
Upon successful completion of both NVT and NPT equilibration phases, the system is prepared for production MD simulation. The production run typically continues using the same NPT ensemble to maintain constant temperature and pressure, with coordinates and velocities taken from the final equilibrated system:
The equilibration protocol outlined here provides a robust foundation for generating thermodynamically stable systems capable of producing physically meaningful trajectory data for scientific analysis.
Launching the production MD run with 'mdrun'
This application note provides a detailed protocol for launching a production molecular dynamics (MD) simulation using the gmx mdrun engine within GROMACS. It is intended for researchers conducting MD simulations as part of structural biology or drug discovery projects.
Coremdruncommand execution
The gmx mdrun command is the primary computational engine in GROMACS for performing Molecular Dynamics simulations, Stochastic Dynamics, Energy Minimization, and other calculations [45].
Basic command syntax and essential options
The fundamental syntax for launching a production run is:
Commonly used options for production simulations are summarized in the table below [45].
Table 1: Essential gmx mdrun options for production simulations
| Option | Argument Type | Default Value | Description |
|---|---|---|---|
-s |
File (.tpr) |
topol.tpr |
Input run input file (portable xdr format) |
-cpi |
File (.cpt) |
state.cpt |
Input checkpoint file to continue simulation |
-deffnm |
String | (None) | Set default filename for all file options |
-v |
Flag | -nov |
Turn on verbose mode for more detailed output |
-cpt |
Real | 15 | Checkpoint interval (minutes) |
-maxh |
Real | (None) | Terminate simulation after approximately this many hours |
-nsteps |
Integer | -1 | Override number of steps to integrate (-1 means infinite) |
-nt |
Integer | (Auto) | Total number of threads to start |
-ntmpi |
Integer | (Auto) | Number of MPI threads |
-ntomp |
Integer | (Auto) | Number of OpenMP threads per MPI process |
-gpu_id |
String | (None) | String of GPU device IDs to use per node |
-pme |
Enum | auto |
Control whether PME runs on CPU, GPU, or auto |
Handling simulation interruptions and continuations
GROMACS is designed to handle long simulations that extend beyond the lifetime of a single process. The checkpoint file (.cpt) is critical for this, containing full-precision coordinates, velocities, and the state of coupling algorithms [46].
To continue a simulation from a checkpoint:
By default, mdrun appends to existing output files. Use the -noappend flag to write new output files with a .partXXXX suffix instead [45] [46].
To extend a simulation without modifying parameters, use gmx convert-tpr:
Performance optimization and parallelization strategies
Efficient use of computational resources is essential for production MD simulations. GROMACS employs multiple parallelization schemes and acceleration techniques [47].
Hardware definitions and parallelization concepts
Understanding hardware terminology is key to configuring mdrun effectively [47]:
- core: A hardware compute unit that executes instructions
- socket: A group of cores sharing locality (e.g., shared cache)
- node: A group of sockets sharing memory without network hardware
- thread: A stream of instructions for a core to execute
- rank: In MPI, the smallest grouping of hardware used in multi-node parallelization
Key parallelization algorithms in GROMACS
- Domain Decomposition (DD): Decomposes short-ranged non-bonded interactions into spatial domains, each handled by a single MPI rank [47]
- Particle-mesh Ewald (PME): Handles long-ranged electrostatic interactions, often assigned to a subset of ranks (typically one-quarter to one-half) for efficiency [47]
Recommended parallelization configurations
Table 2: Performance optimization options for gmx mdrun
| Hardware Scenario | Recommended mdrun Flags |
Explanation |
|---|---|---|
| Single node, multi-core CPU | -ntmpi 1 -ntomp <N_CORES> |
Uses pure OpenMP parallelization |
| Multi-node CPU cluster | -ntmpi <MPI_RANKS> -ntomp <CORES_PER_RANK> |
Hybrid MPI/OpenMP approach |
| Single GPU | -gpu_id 0 |
Assigns computation to specific GPU |
| Multiple GPUs | -gputasks 0001 |
String indicates GPU IDs per task |
| With separate PME ranks | -npme <N_RANKS> |
Dedicate ranks to PME calculation |
| Reproducible run | -reprod |
Eliminates non-reproducibility sources |
For CPU-based simulations, the optimal number of MPI ranks is typically close to the number of physical cores on the node. For GPU-accelerated runs, best performance is usually achieved with one MPI rank per GPU [47].
Workflow and simulation management
The production MD run is the final stage in a multi-step simulation workflow. Proper management ensures scientific reproducibility and efficient resource utilization.
Diagram 1: MD simulation workflow with production stage
Managing long simulations and file handling
For simulations longer than a single job allocation, use checkpointing [46]:
Key output files produced by mdrun [45]:
- Trajectory file (
-o): Contains coordinates, velocities, and optionally forces - Structure file (
-c): Contains coordinates and velocities of the last step - Energy file (
-e): Contains energies, temperature, pressure, etc. - Log file (
-g): Contains detailed performance data and simulation progress
Continuation workflow with checkpoint files
Diagram 2: Simulation continuation using checkpoint files
Reproducibility and validation
Reproducibility in MD simulations is challenging but essential for scientific rigor. Multiple factors affect reproducibility, including precision, processor type, core count, and optimization level [46].
To ensure reproducible runs:
The -reprod flag eliminates known sources of non-reproducibility, but may impact performance. Note that different trajectories with the same physical observables are equally valid scientifically [48].
Research reagent solutions
Table 3: Essential computational materials for GROMACS production runs
| Reagent/Resource | Function/Purpose | Example/Format |
|---|---|---|
| Portable run input file | Binary input containing system topology, coordinates, and parameters | .tpr file (e.g., topol.tpr) |
| Checkpoint file | Stores full-precision simulation state for exact continuation | .cpt file (e.g., state.cpt) |
| Molecular topology | Defines molecules, atom types, bonds, and force field parameters | .top file (e.g., topol.top) |
| Trajectory output | Records atomic coordinates over time for analysis | .xtc (compressed) or .trr (full precision) |
| Energy file | Contains time-series of energies, temperature, pressure, etc. | .edr file |
| Log file | Detailed record of simulation progress and performance metrics | .log file |
| Force field | Mathematical representation of interatomic interactions | OPLS/AA, CHARMM, AMBER |
| Water model | Represents solvent water molecules | SPC/E, TIP3P, TIP4P |
This protocol provides researchers with a comprehensive guide to launching production MD simulations in GROMACS, emphasizing performance optimization, robust workflow management, and scientific reproducibility for drug development applications.
Molecular dynamics (MD) simulation serves as a computational microscope, enabling researchers to observe the motion and interactions of biological molecules at an atomic level over time. Among the various software packages available, GROMACS (GROningen MAchine for Chemical Simulations) has emerged as a premier tool due to its exceptional performance, extensive feature set, and strong community support [2] [49]. For researchers new to this field, the Lysozyme in Water tutorial provides an ideal introduction to the complete workflow of a biomolecular simulation [3] [50].
This application note presents a comprehensive walkthrough of simulating hen egg white lysozyme (PDB code 1AKI) in an aqueous environment. Lysozyme is an excellent model system for beginners—it is a relatively small (129 residues), well-studied enzyme that exhibits sufficient complexity to demonstrate key aspects of MD setup and analysis while remaining computationally manageable [2] [51]. The protocol detailed herein guides users through the essential stages of simulation: system preparation, energy minimization, equilibration, and production MD, followed by a discussion of fundamental analysis techniques.
Mastering this foundational workflow provides researchers with a template that can be adapted to study diverse biological systems, from membrane proteins and protein-ligand complexes to nucleic acids, thereby supporting broader research objectives in structural biology, drug discovery, and molecular biophysics [3].
Research Significance and Context
The Role of MD in Modern Computational Chemistry
Molecular dynamics simulations have become an indispensable tool in the computational chemist's arsenal, bridging the gap between static structural information and dynamic functional understanding. Unlike crystallography or NMR, which provide structural snapshots, MD reveals the time-dependent behavior of molecular systems—conformational changes, binding events, and pathways—offering insights unattainable through experimental methods alone [2].
The integration of MD with experimental data creates a powerful synergistic relationship where simulations can validate experimental findings, suggest new hypotheses, and provide atomic-level explanations for macroscopic observations. For drug development professionals, MD offers the capability to visualize drug-target interactions in silico, potentially reducing costly experimental screening during early discovery phases [5].
Why Lysozyme?
Hen egg white lysozyme represents an ideal model system for introductory MD for several reasons:
- Small size and stability: With only 129 amino acids and a robust globular fold, lysozyme simulations are computationally tractable and less prone to unfolding artifacts during shorter simulations [2] [51]
- Extensive characterization: As one of the most thoroughly studied enzymes, abundant structural and biochemical data exists for validation of simulation outcomes [51]
- Relevant biological function: Its role in breaking down bacterial cell walls connects simulation methodology to biologically meaningful research questions [2]
Successful execution of an MD simulation requires both specific input files and appropriate computational infrastructure. The following tables catalogue these essential components.
Table 1: Required input files for the Lysozyme in Water tutorial
| File Name | Format | Description | Source |
|---|---|---|---|
| 1AKI_clean.pdb | PDB | Lysozyme structure with crystallographic waters and heteroatoms removed | RCSB PDB (code 1AKI), processed [51] |
| topol.top | TOP | System topology defining atoms, bonds, and force field parameters | Generated by pdb2gmx [51] |
| posre.itp | ITP | Position restraint file for equilibration phases | Generated by pdb2gmx [51] |
| nvt.mdp, npt.mdp, md.mdp | MDP | Simulation parameters for NVT, NPT, and production MD | User-created or provided with tutorial [49] |
Table 2: Computational environment considerations
| Resource Type | Recommendation | Notes |
|---|---|---|
| GROMACS Version | 2025.x series | Tutorial optimized for latest version [50] |
| Compute Hardware | CPU cluster with GPU acceleration | Significantly enhances performance [49] |
| Storage | ~1-10 GB | Depending on trajectory length and output frequency |
| Visualization | VMD, Chimera, PyMOL | For structural analysis and trajectory viewing [51] |
Beyond these specific files, several software packages and force fields are required. The tutorial specifically utilizes the CHARMM36 all-atom force field for protein parameters and TIP3P as the water model, though other combinations like OPLS-AA with SPC/E water are also valid choices [2] [51]. Visualization tools such as VMD, PyMOL, or Chimera are essential for inspecting structures and analyzing trajectories [51].
Complete Experimental Protocol
The following diagram illustrates the complete MD simulation workflow, from initial structure preparation through to production simulation and analysis:
Step-by-Step Methodology
System Preparation
Step 1: Obtain and Clean the Protein Structure Download the lysozyme structure (PDB code: 1AKI) from the RCSB Protein Data Bank. Remove crystallographic waters and any heteroatoms not required for simulation:
Always check the PDB file for entries listed under "MISSING," as these indicate absent atoms or residues that must be modeled before simulation [51].
Step 2: Generate Topology and Force Field Assignment Process the cleaned structure with pdb2gmx to create the molecular topology, position restraints, and a processed structure file:
When prompted, select the CHARMM36 force field (option 9 in the tested version). The topology file (topol.top) contains all necessary information to define the molecule within the simulation, including nonbonded parameters (atom types and charges) and bonded parameters (bonds, angles, and dihedrals) [51].
Step 3: Define Simulation Box and Solvation Place the protein in a simulation box with adequate padding (typically 1.0-1.5 nm from protein surface):
Solvate the system with water molecules:
Step 4: Add Ions for System Neutralization
First, prepare a run input file with grompp:
Then add ions to neutralize the system:
Lysozyme carries a charge of +8e, so this step will add 8 chloride anions to neutralize the system [2].
Energy Minimization and Equilibration
Step 5: Energy Minimization Energy minimization relieves any steric clashes or unusual geometry that would artificially raise the system energy:
This step employs the steepest descent algorithm to find the nearest local energy minimum [2]. The system is considered minimized when the maximum force drops below a specified threshold (typically 1000 kJ/mol/nm).
Step 6: NVT Equilibration (Constant Particle Number, Volume, and Temperature) The first equilibration phase stabilizes the system temperature:
During this phase, protein heavy atoms are restrained to their initial positions using the posre.itp file generated earlier, allowing water and ions to relax around the protein [2].
Step 7: NPT Equilibration (Constant Particle Number, Pressure, and Temperature) The second equilibration phase stabilizes system pressure:
This ensures proper density before beginning production simulation [2].
Table 3: Key simulation parameters for different phases
| Parameter | Energy Minimization | NVT Equilibration | NPT Equilibration | Production MD |
|---|---|---|---|---|
| Integrator | Steepest descent | md (leap-frog) | md (leap-frog) | md (leap-frog) |
| Duration | 50,000 steps | 100-500 ps | 100-500 ps | 1+ ns |
| Temperature | N/A | 300 K (V-rescale) | 300 K (V-rescale) | 300 K (V-rescale) |
| Pressure | N/A | N/A | 1 bar (Parrinello-Rahman) | 1 bar (Parrinello-Rahman) |
| Constraints | None | H-bonds (LINCS) | H-bonds (LINCS) | H-bonds (LINCS) |
| Restraints | None | Protein heavy atoms | Protein heavy atoms | None |
Production Simulation
Step 8: Production Molecular Dynamics Once the system is properly equilibrated, initiate the production simulation:
For significantly enhanced performance, particularly with larger systems, utilize GPU acceleration:
Benchmarking on an NVIDIA RTX 4090 GPU has demonstrated performance up to 255 ns/day, highlighting the substantial acceleration possible with proper hardware configuration [49].
Data Analysis and Interpretation
Essential Analysis Techniques
Following production simulation, several analytical approaches provide insight into system behavior and simulation quality:
Structural Stability: Root Mean Square Deviation (RMSD) Calculate protein backbone RMSD to assess structural stability:
A plateau in RMSD values suggests the protein has reached conformational stability, while continuous drift may indicate insufficient equilibration or unfolding.
Flexibility: Root Mean Square Fluctuation (RMSF) Calculate per-residue fluctuations to identify flexible regions:
Peaks in RMSF often correspond to loop regions or terminal, while low fluctuations characterize structured elements like alpha-helices.
Solvent Structure: Radial Distribution Function (RDF) Analyze water organization around the protein:
RDF reveals solvation shells and specific water interactions with protein surface groups.
Visualization and Interpretation
Visual inspection of the trajectory provides invaluable qualitative insights. Using VMD, PyMOL, or Chimera, examine:
- Overall protein conformational changes
- Side chain rotamer dynamics
- Water interactions with protein surface
- Ion distribution around the protein
Visualization complements quantitative analysis by providing intuitive understanding of dynamic processes observed in the simulation [51].
Troubleshooting and Optimization Strategies
Even carefully executed simulations may encounter issues. The following table addresses common challenges:
Table 4: Troubleshooting common simulation issues
| Problem | Possible Causes | Solutions |
|---|---|---|
| pdb2gmx fails | Missing atoms/residues, unrecognized residues | Check PDB file for "MISSING" entries; consider homology modeling for absent regions [51] |
| Energy minimization doesn't converge | Steric clashes, incorrect topology | Increase minimization steps (nsteps); check for improper dihedrals or van der Waals overlaps |
| System instability during equilibration | Incorrect temperature/pressure coupling, poor initial structure | Ensure gradual heating; verify force field and water model compatibility; check ion placement |
| Poor performance | Suboptimal parallelization, hardware limitations | Utilize GPU acceleration; optimize -ntmpi and -ntomp flags for specific hardware [49] |
Alternative Platforms and Implementations
While the core tutorial assumes command-line execution, several platforms offer alternative implementations:
- Galaxy: Provides a web-based interface for GROMACS, making the tool more accessible to beginners without command-line experience [2]
- AiiDA-gromacs: Offers workflow management with provenance tracking, ensuring reproducibility and automated record-keeping [52]
- DiPhyx: A cloud-based platform that simplifies deployment and visualization, integrating ParaView for direct trajectory analysis [53]
- OpenBayes: Provides containerized environments with pre-configured GROMACS installations and GPU acceleration [49]
These platforms lower entry barriers while maintaining the fundamental workflow described in this protocol.
The Lysozyme in Water tutorial provides an essential foundation for molecular dynamics simulations using GROMACS. This walkthrough has detailed the complete protocol—from initial structure preparation through production simulation—emphasizing the critical importance of careful system setup, stepwise equilibration, and comprehensive analysis. Mastery of this foundational workflow enables researchers to tackle increasingly complex biological questions through molecular dynamics simulations, contributing to advancements in structural biology, drug discovery, and molecular biophysics.
The skills acquired through this tutorial form the basis for exploring more advanced GROMACS applications, including membrane protein simulations, free energy calculations, and enhanced sampling techniques, ultimately expanding the researcher's computational toolbox for investigating biomolecular function and dynamics.
Optimizing Performance and Solving Common GROMACS Setup Errors
Within the framework of thesis research utilizing molecular dynamics (MD) simulations in GROMACS, achieving high computational performance is paramount for probing biologically relevant timescales. This application note details proven methodologies for boosting simulation speed through strategic GPU acceleration and optimizing the critical neighbor searching process. Efficiently harnessing modern heterogeneous computing architectures—CPUs paired with GPUs—can accelerate simulation throughput by an order of magnitude, transforming project timelines and expanding the scope of scientific inquiry. We provide a structured protocol, grounded in the official GROMACS documentation and community-tested practices, to guide researchers in configuring their simulations for maximum performance without compromising physical accuracy.
The Pillars of Performance in GROMACS
The performance of a GROMACS simulation is primarily governed by two computational aspects: the efficient calculation of forces, which can be massively parallelized on a GPU, and the management of particle interactions through neighbor searching, which typically runs on the CPU. Understanding their interplay is the first step toward effective optimization.
GPU Acceleration shifts the most computationally intensive tasks—the calculation of non-bonded forces (both short-range and long-range Particle-Mesh Ewald, PME) and bonded forces—from the CPU to the highly parallel architecture of the GPU. This is achieved in GROMACS through specific command-line flags that offload these tasks [54]. Proper offloading ensures the GPU becomes the primary workhorse, leading to a significant reduction in simulation time.
The Neighbor Search (NS) algorithm, executed on the CPU, generates a "pair list" of all particle pairs that are within a certain range of each other. This list determines which non-bonded interactions need to be calculated. The list is not updated every step but every nstlist steps (e.g., 100 steps by default) to amortize its cost. Because particles move, the list is built with a buffer zone (rlist or Verlet buffer) larger than the interaction cut-off (rcoulomb and rvdw). If this buffer is too small, particles from outside the list can move within the interaction cut-off, causing energy drift and inaccuracies. If the buffer is too large, or if the list is updated too frequently, the neighbor search becomes a performance bottleneck [7]. Optimizing this process involves finding the sweet spot that maintains accuracy while minimizing the performance overhead of the list generation.
Table 1: Key GROMACS mdrun Options for GPU Offloading
| Command-line Option | Function | Performance Implication |
|---|---|---|
-nb gpu |
Offloads short-range non-bonded force calculations to the GPU. | Essential for GPU acceleration; often the largest performance gain. |
-pme gpu |
Offloads long-range PME electrostatics calculations to the GPU. | Critical for balance; prevents PME from becoming a CPU-bound bottleneck. |
-bonded gpu |
Offloads calculation of bonded forces to the GPU. | Further reduces CPU load, improving overall balance. |
-update gpu |
Offloads the coordinate and velocity update tasks to the GPU. | Minimizes CPU-GPU data transfer, useful for high-throughput runs. |
A Workflow for Performance Optimization
The following diagram outlines a systematic workflow for diagnosing and improving the performance of your GROMACS simulations, integrating both GPU offloading and neighbor search tuning.
Diagram: A systematic workflow for optimizing GROMACS simulation speed.
Hardware and Software Configuration
The Scientist's Toolkit
A performant GROMACS setup requires both capable hardware and correctly configured software.
Table 2: Essential Research Reagent Solutions for High-Performance GROMACS
| Item | Function & Recommendation |
|---|---|
| GPU (Graphics Processing Unit) | Accelerates force calculations. NVIDIA GPUs (CUDA), AMD GPUs (SYCL/OpenCL), and Intel GPUs (SYCL) are supported. A high-end consumer GPU (e.g., NVIDIA RTX 4090) or data-center GPU is recommended. |
| Multi-core CPU | Handles neighbor searching, topology management, and other serial tasks. A modern CPU with high single-core performance is beneficial. |
| GROMACS Installation | Must be compiled with support for the desired GPU backend (CUDA, SYCL) and an appropriate SIMD instruction set (e.g., AVX2_256) for the CPU [47] [55]. |
| Performance Analysis Tools | The md.log file output by GROMACS is the primary tool for performance analysis, providing a detailed breakdown of time spent in different parts of the code [47]. |
Initial Setup and Baseline Measurement
Begin by establishing a performance baseline. Run a short simulation with a standard configuration, typically using full GPU offloading [54] [55]:
After the run, carefully inspect the md.log file. The performance summary at the end is crucial. Note the ns/day value and the wall-clock time breakdown for Force, Neighbor search, PME, and Rest.
Protocol for Neighbor Search Optimization
A common performance issue, even with full GPU offloading, is a slow neighbor search, which is a CPU-bound task. This manifests as a high percentage of wall time spent on "Neighbor search" in the log file [55].
Increasing the Neighbor Search Interval
The most effective parameter to adjust is -nstlist, which controls how often the pair list is rebuilt. The default is often 100. For stable systems, this can be increased, reducing the frequency of this expensive operation [54].
Methodology: Start by increasing nstlist to 150 or 200. Monitor the energy conservation in your simulation (check the md.edr file for total energy drift). A significant energy drift indicates the Verlet buffer may be too small for the new list lifetime. GROMACS can automatically determine an adequate buffer size based on a tolerated energy drift, which is a safer approach [7].
Tuning CPU Parallelization for Optimal GPU Feeding
The CPU's primary role in a GPU-accelerated run is to prepare work for the GPU (like neighbor searches) and handle tasks not offloaded. Overloading the CPU with too many threads can create a bottleneck. The goal is to keep the GPU utilization high (>90%) without over-subscribing the CPU.
The -ntmpi and -ntomp flags control parallelization. For a single-node, single-GPU simulation, the optimal setup is often one MPI rank (-ntmpi 1) and a limited number of OpenMP threads (-ntomp) assigned to the physical performance cores (P-cores on hybrid CPUs) [55].
The -pin on option pins threads to specific CPU cores, preventing thread migration and improving performance [47]. If performance does not improve or worsens, check the system load to ensure no other processes are competing for CPU resources, as this can severely degrade performance [55].
Performance Benchmarking and Validation
To demonstrate the impact of these optimizations, consider the following benchmark data synthesized from community reports and official documentation.
Table 3: Exemplar Performance Impact of Optimization Steps
| Configuration | Simulation Performance (ns/day) | GPU Utilization | Key Bottleneck |
|---|---|---|---|
| Default CPU-only run | 10 (Baseline) | 0% | Force calculation on CPU. |
Basic GPU offload (-nb gpu -pme gpu) |
90 | ~70% | Neighbor search and bonded forces on CPU. |
Full GPU offload (-bonded gpu -update gpu) |
130 | ~85% | Neighbor search frequency (nstlist). |
Full GPU offload + -nstlist 200 |
150 | ~95% | Minimal / Well-balanced. |
The ultimate validation of your optimized setup is a combination of high performance and physical correctness. Always verify the stability of your simulation by checking:
- Energy Conservation: For NVE simulations, the total energy should be stable. For NVT/NPT, monitor potential energy and temperature/pressure for stability.
- Physical Properties: Calculate properties like root-mean-square deviation (RMSD) or radial distribution functions (RDF) and ensure they are physically plausible and consistent with a reference simulation.
Integrating comprehensive GPU offloading with a tuned neighbor searching strategy is a highly effective method for boosting GROMACS simulation speed. This protocol, which moves the bulk of computational workload to the GPU while strategically reducing the CPU's overhead, can lead to performance improvements of over 10x compared to CPU-only runs. By following the systematic workflow of benchmarking, analyzing logs, and iteratively adjusting key parameters, researchers can dramatically accelerate their molecular dynamics research, enabling more ambitious and scientifically impactful projects.
In molecular dynamics (MD) simulations, the careful selection of algorithms is paramount for generating physically accurate and computationally efficient results. The integrator and thermostat form the core of the MD engine, governing the numerical solution of Newton's equations of motion and maintaining the desired temperature ensemble, respectively. Within the GROMACS simulation package, these choices are made primarily through parameters specified in the molecular dynamics parameters (.mdp) file. This guide provides a structured framework for selecting appropriate integrators and thermostats, contextualized within the broader process of setting up reliable MD simulations for research and drug development. The recommendations are based on the latest GROMACS documentation and established simulation practices [56] [7] [57].
Integrator selection: Propagating the system through time
The integrator .mdp parameter defines the algorithm used to numerically integrate the equations of motion for all particles in the system. The choice of integrator affects the stability, accuracy, and conservation properties of the simulation.
Table 1: Comparison of Key Integrators in GROMACS
| Integrator | Algorithm Type | Key Features | Typical Use Cases | Critical Parameters |
|---|---|---|---|---|
md |
Leap-frog | Default, efficient, proven stability [56]. | Standard production MD [56]. | dt (time step) |
md-vv |
Velocity Verlet | More accurate for extended ensembles, reversible [56]. | NPT/NVT with advanced coupling; requires precise sampling [56]. | dt (time step) |
md-vv-avek |
Velocity Verlet | Average kinetic energy; most accurate kinetic energy [56]. | High-accuracy NPT/NVT [56]. | dt (time step) |
sd |
Stochastic Dynamics | Leap-frog with friction/noise; accurate & efficient [56]. | Implicit solvent; constant temperature [56]. | tau-t (friction inverse), ref-t (temperature) |
bd |
Brownian Dynamics | Euler integrator for high friction regimes [56]. | Solvent-free simulations; crowded environments [56]. | bd-fric (friction coefficient), ref-t (temperature) |
steep |
Steepest Descent | Simple energy minimization [56]. | Energy minimization [56]. | emtol (tolerance), emstep (max step size) |
cg |
Conjugate Gradient | Efficient energy minimization [56]. | Energy minimization (more efficient than steepest descent) [56]. | emtol (tolerance) |
The fundamental MD algorithm and time step selection
Regardless of the specific integrator, the core MD algorithm follows a repetitive cycle of force computation and configuration updates [7]. The integrator's role is to update particle positions and velocities over a discrete time step, dt.
A critical rule of thumb for dt is that it should not be greater than 1/10 of the period of the fastest motion in the system [17]. For all-atom simulations, this is typically the vibration of bonds involving hydrogen atoms, which have a period of approximately 10 fs. Therefore, a time step of 2 fs is standard when using constraints on these bonds [17]. To enable larger time steps (e.g., 4 fs), the mass-repartition-factor parameter can be used to scale the masses of the lightest atoms (typically hydrogens), thereby reducing the frequency of these fastest vibrations [56].
Thermostat selection: Regulating the system temperature
Thermostats are algorithms that control the temperature of the system, mimicking the exchange of energy with an external bath. They are essential for simulating the canonical (NVT) ensemble. The choice of thermostat influences the quality of the ensemble generated and the dynamics of the system.
Principles of temperature control
In statistical mechanics, the temperature ( T ) of a system is related to the average kinetic energy ( \langle K \rangle ) over time [57]: [ \langle K \rangle = \frac{3}{2}NkBT ] where ( N ) is the number of atoms and ( kB ) is Boltzmann's constant. A thermostat's role is to maintain this relationship by ensuring the instantaneous kinetic energy fluctuates around this average value [57].
Comparison of common thermostats
Table 2: Comparison of Thermostat Algorithms in GROMACS
| Thermostat | Coupling Type | Ensemble Quality | Strengths & Weaknesses | Key Parameters |
|---|---|---|---|---|
| Velocity Rescale | Deterministic rescaling | Poor (over-constrained) [57] | Simple; not recommended for production [57]. | tau-t (coupling time) |
| Berendsen | Weak coupling to bath | Incorrect canonical [57] | Fast, smooth relaxation; good for equilibration [57]. | tau-t (coupling strength) |
| Andersen | Stochastic collisions | Canonical [57] | Good ensemble; can perturb dynamics [57]. | tau-t (collision frequency) |
| Nosè-Hoover | Extended Lagrangian | Canonical [57] | Correct ensemble; suitable for production [57]. | tau-t (coupling mass) |
| Bussi (v-rescale) | Stochastic rescaling | Canonical [57] | Correct ensemble & fast relaxation; recommended for production [57]. | tau-t (coupling time) |
The Berendsen thermostat is particularly useful during the equilibration phase of a simulation due to its ability to rapidly and smoothly bring the system to a desired temperature, even from a poor starting structure [57]. For production simulations, where correct sampling of the canonical ensemble is crucial, the Nosè-Hoover or Bussi-Donadio-Parrinello (v-rescale) thermostats are recommended [57].
Integrated protocols for system setup and equilibration
Successful MD simulation requires a careful, multi-stage process to prepare the system and gently relax it into the target ensemble. The selection of integrators and thermostats is specific to each stage.
Protocol: System preparation and energy minimization
- Generate Topology and Solvate: Obtain or generate the initial coordinate file and corresponding topology for your molecule(s). Place them in a simulation box, solvate, and add ions as needed [32].
- Energy Minimization: Run an energy minimization to remove any bad contacts or steric clashes introduced during system building. This step is required before any dynamics can be run [32].
Protocol: System equilibration
Equilibration is typically performed in stages, first at constant volume (NVT) and then at constant pressure (NPT), to slowly relax the system [32].
- NVT Equilibration (Temperature Coupling):
- Integrator:
integrator = md(leap-frog) [56]. - Thermostat:
tcoupl = Berendsen(for rapid, stable heating) orV-rescale[32] [57]. - Parameters: Set
ref-tto the target temperature (e.g., 300 K) andtau-tto the coupling constant (e.g., 1.0 ps for Berendsen) [56] [57]. Apply position restraints to the solute heavy atoms to allow the solvent to relax around them.
- Integrator:
- NPT Equilibration (Temperature and Pressure Coupling):
- Integrator:
integrator = md[56]. - Thermostat: Switch to a production-grade thermostat like
tcoupl = V-rescaleorNose-Hoover[32] [57]. - Parameters: Use the same
ref-tandtau-tas in NVT. Configure the barostat (e.g.,pcoupl = C-rescale) and its associated parameters [32]. Position restraints on the solute can be kept or gradually released.
- Integrator:
Protocol: Production simulation
The final production run uses parameters designed for long-term stability and correct statistical sampling.
- Integrator:
integrator = mdis accurate enough for nearly all production simulations [56]. For advanced uses requiring highly accurate integration with extended ensembles,integrator = md-vvormd-vv-avekcan be considered [56]. - Thermostat:
tcoupl = V-rescaleorNose-Hooverto ensure proper canonical sampling [57]. - Parameters: Remove all positional restraints. Ensure the pair-list buffer and neighbor-searching frequency (
nstlist) are appropriate to minimize energy drift [7].
Table 3: Key Research Reagent Solutions for GROMACS Simulations
| Item | Function | Example/Note |
|---|---|---|
| Force Field | Defines potential energy function & parameters [17]. | AMBER, CHARMM, GROMOS; select for system & property of interest [32]. |
| Topology File | Describes molecular system & force field parameters [32]. | Generated by gmx pdb2gmx, CHARMM-GUI, or other tools [32]. |
| Molecular Dynamics Parameters (.mdp) File | Defines simulation algorithms & parameters [56]. | Contains all choices for integrator, thermostat, timestep, etc. [56]. |
| Coordinate File (.pdb, .gro) | Specifies initial atomic positions [17]. | From PDB database or molecular building software [32]. |
| Velocity File | Provides initial atomic velocities [7]. | Can be generated by GROMACS from a Maxwell-Boltzmann distribution [7]. |
The following diagram illustrates the logical workflow for selecting an integrator and thermostat in GROMACS, connecting these choices to the specific stages of a simulation project.
Figure 1: A logical workflow for selecting GROMACS integrators and thermostats throughout the key stages of a molecular dynamics simulation.
The modern GROMACS engine is built on a modular simulator architecture, which uses a task scheduler to efficiently manage the computational elements of a simulation. The diagram below outlines this structure, showing how different elements (like force computation and temperature coupling) are scheduled.
Figure 2: The modular simulator architecture in GROMACS, based on a task scheduler and simulator elements [58].
Managing cut-offs, constraints, and long-range electrostatics with PME
Accurately and efficiently calculating long-range electrostatic interactions and managing molecular constraints are foundational to reliable Molecular Dynamics (MD) simulations in GROMACS. The Particle Mesh Ewald (PME) method has become the standard for treating electrostatics in periodic systems, as it provides an accurate solution to the conditionally convergent sum of Coulombic interactions by dividing the calculation into short-range and long-range components [59]. Simultaneously, the choice of constraint algorithms and cut-off schemes significantly impacts numerical stability, energy conservation, and computational performance. This application note provides detailed protocols for configuring these critical components, framed within our broader thesis on robust GROMACS simulation setup, to guide researchers and drug development professionals in making informed methodological decisions.
Understanding Particle Mesh Ewald (PME) electrostatics
Theoretical foundation of PME
The Ewald summation method converts the single, slowly-converging sum for the total electrostatic energy of (N) particles and their periodic images into two quickly-converging terms and a constant term [59]:
[ V = V{\mathrm{dir}} + V{\mathrm{rec}} + V_{0} ]
Where:
- (V_{\mathrm{dir}}) is the direct space short-range term computed with a modified potential that decays rapidly
- (V_{\mathrm{rec}}) is the reciprocal space term calculated in Fourier space
- (V_{0}) is the constant self-energy term
PME (Particle-Mesh Ewald) improves upon classical Ewald summation by using interpolation onto a grid and Fast Fourier Transforms (FFTs) to accelerate the reciprocal sum computation. This approach reduces the computational complexity from (N^{3/2}) to (N \log(N)), making it feasible for large biomolecular systems [59]. The implementation in GROMACS uses cardinal B-spline interpolation (smooth PME or SPME) for accurate force calculation.
Key parameters for PME configuration
Table 1: Essential PME parameters and their recommended values
| Parameter | mdp option | Recommended value | Purpose |
|---|---|---|---|
| Coulomb type | coulombtype |
PME |
Enables PME electrostatics |
| Real space cutoff | rcoulomb |
0.9-1.2 nm | Distance for direct space calculation |
| Fourier spacing | fourierspacing |
0.12-0.15 nm | Controls FFT grid density |
| PME order | pme-order |
4 (cubic) | Interpolation order for grid assignment |
| Ewald tolerance | ewald-rtol |
1e-5 | Relative error tolerance |
The fourierspacing parameter determines the maximum spacing for the FFT grid, with smaller values yielding a finer mesh and higher accuracy. With a fourth-order interpolation and 0.12 nm spacing, electrostatic energies are typically accurate to about (5\cdot10^{-3}) [59]. For optimal performance, the real-space cutoff (rcoulomb) should match the neighbor-list cutoff (rlist) and van der Waals cutoff (rvdw).
Constraint algorithms: LINCS vs. SHAKE
Algorithm comparison and selection criteria
Constraint algorithms enforce fixed bond lengths (and sometimes angles) during simulations, allowing for longer integration time steps. GROMACS primarily offers two methods: LINCS (default) and SHAKE.
Table 2: Comparison of constraint algorithms in GROMACS
| Feature | LINCS | SHAKE |
|---|---|---|
| Algorithm type | Matrix-based, non-iterative | Iterative Lagrange multipliers |
| Performance | Faster, especially for bonds | Slower due to iterative nature |
| Stability | Excellent for Brownian dynamics | Can struggle with large systems |
| Supported constraints | Bonds, isolated angles (e.g., OH) | All constraint types |
| Parallel scaling | P-LINCS for parallel runs | Standard implementation |
LINCS is generally preferred due to its non-iterative nature and better performance. It works by resetting bonds to their correct lengths after an unconstrained update in two steps: first setting the projections of new bonds on old bonds to zero, then applying a correction for bond lengthening due to rotation [60]. However, LINCS should not be used with coupled angle constraints, as this can lead to high connectivity and large eigenvalues in the constraint coupling matrix [60].
SHAKE solves a set of Lagrange multipliers iteratively to satisfy distance constraints, continuing until all constraints are satisfied within a specified relative tolerance [60]. While more general, it is slower and can face convergence issues.
For rigid water molecules, the SETTLE algorithm provides an optimal solution. GROMACS's implementation avoids calculating the center of mass of water molecules, reducing rounding errors and enabling accurate integration in single precision for systems up to 1000 nm in size [60].
Configuration protocols for constraint algorithms
Basic LINCS configuration:
Advanced configuration for difficult systems:
For energy minimization where higher accuracy is needed, increase lincs-order as the relative constraint deviation after one iteration is typically less than 0.0001, which might be insufficient for minimization [60].
Cut-off schemes: Verlet vs. group
Evolution of cut-off schemes in GROMACS
GROMACS has transitioned from group-based cut-off schemes to the Verlet cut-off scheme as the default. The Verlet scheme uses properly buffered pair lists with exact cut-offs and is strongly recommended for all simulation types because it is "easier and faster to run correctly" [61].
Table 3: Feature support in group vs. Verlet cut-off schemes
| Feature | Group scheme | Verlet scheme |
|---|---|---|
| Exact cut-off | shift/switch | always |
| GPU acceleration | no | yes |
| PME electrostatics | yes | yes |
| Non-periodic systems | yes | Z + walls only |
| Implicit solvent | yes | no |
| Free energy perturbations | yes | yes |
| Performance profile | Depends on system composition | Consistent across systems |
The group scheme, now deprecated, originally used charge-groups and was optimized for water-water interactions, but requires careful buffering to avoid artifacts. The Verlet scheme's performance is "independent of system composition" and is intended to always run with a buffered pair-list [61].
Configuring the Verlet cut-off scheme
Standard configuration:
The verlet-buffer-tolerance controls the buffer size added to the neighbor list to maintain energy stability. The default of 0.0001 kJ/mol/ps is appropriate for most atomistic simulations, as "constraints cause a drift somewhere around 0.0001 kJ/mol/ps per particle" in single precision [61].
For constant-energy (NVE) simulations, the buffer size can be inferred from the temperature corresponding to the velocities, or set manually by specifying rlist greater than the larger of rcoulomb and rvdw when verlet-buffer-tolerance = -1 [61].
Performance optimization strategies
PME load balancing and GPU acceleration
Modern GROMACS implementations allow offloading PME calculations to GPUs, which can provide significant performance improvements. The decision of whether to run PME on GPU or CPU depends on the system characteristics and hardware capabilities:
- Few bonded interactions + relatively weak CPU → Benefit from PME on GPU
- Many bonded interactions + relatively strong CPU → May perform better with PME on CPU [62]
GROMACS includes an automatic PME tuning feature (mdrun -tunepme) that adjusts the PME grid spacing and load balance between Particle-Particle (PP) and PME ranks during the first few thousand steps [62]. This tuning can be manually controlled with:
Special considerations for specific simulation types
Gas-phase simulations: While true vacuum conditions are not supported, equivalent simulations can be performed using a very large periodic box with cutoff electrostatics [63]. The box should be large enough that there is at least one cutoff length in all directions between periodic copies of the molecule. Use coulombtype = Cut-off instead of PME and set the box size to 2-3 times the protein size plus the cutoff distance.
Free energy calculations: Both PME and Reaction Field (RF) methods can be used in free energy calculations, with studies showing comparable results between the two methods [64]. However, RF may offer performance advantages in some cases, particularly on CPU-based systems.
Integrated workflow for optimal configuration
Protocol for system setup and parameterization
Step 1: Topology preparation
- Use
pdb2gmxorgromppwithmass-repartition-factor = 3to enable hydrogen mass repartitioning, allowing a 4 fs time step [21] - Select appropriate force field based on system composition
Step 2: Box creation and solvation
- Create a box with sufficient margin (≥1.0 nm) from the solute using
editconf - For gas-phase simulations, use a very large box (3× protein size) [63]
- Solvate using
solvateand add ions withgenion
Step 3: Energy minimization mdp configuration
Step 4: Equilibration and production mdp configuration
The following diagram illustrates the complete workflow for setting up a PME-based MD simulation in GROMACS, integrating the key concepts discussed in this application note:
The scientist's toolkit: Essential research reagents
Table 4: Key computational tools and methods for MD simulations
| Tool/Component | Function | Implementation in GROMACS |
|---|---|---|
| PME Electrostatics | Accurate long-range electrostatic calculation | coulombtype = PME with FFT grid |
| LINCS Constraints | Maintain bond lengths allowing longer time steps | constraint-algorithm = lincs |
| Verlet Cut-off Scheme | Neighbor searching with buffered pair lists | cutoff-scheme = Verlet (default) |
| Hydrogen Mass Repartitioning | Enables 4 fs time steps | mass-repartition-factor = 3 |
| GPU Acceleration | Offload computation to GPUs | -nb gpu -pme gpu flags to mdrun |
| PME Tuning | Automatic load balancing | mdrun -tunepme (default on) |
Proper configuration of cut-offs, constraints, and long-range electrostatics is essential for achieving accurate, efficient, and stable molecular dynamics simulations in GROMACS. The Verlet cut-off scheme with PME electrostatics and LINCS constraints represents the current optimal configuration for most biomolecular systems. By following the protocols and recommendations outlined in this application note, researchers can ensure their simulations are built on a solid foundation, enabling reliable results for drug discovery and biomolecular research. As GROMACS continues to evolve, particularly in GPU acceleration and algorithmic improvements, these core components remain fundamental to successful simulation outcomes.
Troubleshooting common 'grompp' and 'mdrun' errors
Within the comprehensive framework of setting up and executing molecular dynamics (MD) simulations in GROMACS, encountering errors during the grompp (preprocessing) and mdrun (execution) phases represents a critical juncture that often separates successful simulations from computational failures. These errors frequently stem from inconsistencies in input parameters, system topology, or hardware limitations that manifest only when the simulation engine attempts to integrate all components into a physically realizable model. This application note systematically addresses the most prevalent errors identified through official documentation and community experience, providing researchers, scientists, and drug development professionals with validated protocols for diagnosis and resolution. The guidance presented here is anchored in the operational context of GROMACS 2025.2, ensuring relevance to current computational environments while maintaining applicability to earlier versions where appropriate.
The significance of robust troubleshooting protocols becomes particularly evident when considering that many grompp and mdrun errors share common underlying causes—incorrect parameter definitions, improper file ordering, or insufficient system preparation—that if unresolved, propagate through the simulation pipeline, resulting in catastrophic failures during production runs. By formalizing the error resolution process within the broader thesis of MD simulation setup, we establish a methodological foundation that enhances research reproducibility and computational efficiency, ultimately accelerating drug discovery and materials development pipelines.
Understanding grompp: The GROMACS preprocessor
Functional role and common error categories
The grompp utility serves as the critical preprocessing step in GROMACS that consolidates molecular structure files (.gro, .pdb), topology parameters (.top, .itp), and simulation parameters (.mdp) into a portable binary input file (.tpr) for the mdrun engine. This integration process validates mathematical consistency, physical plausibility, and syntactic correctness across all input domains, making it the first line of defense against simulation failures. Based on analysis of official documentation and user communities, grompp errors predominantly manifest in several categorical patterns, with directive ordering violations, topology-parameter mismatches, and missing residue/atom definitions representing the most frequently encountered obstacles to successful simulation initialization [65] [66].
The preprocessor's validation rigor, while occasionally producing opaque error messages, fundamentally prevents more severe computational wastage that would occur if flawed parameterizations proceeded to expensive production MD stages. Particularly in drug development contexts where simulations may involve complex protein-ligand systems with non-standard residues, grompp errors frequently signal underlying issues with force field compatibility or parameter assignment that, if bypassed, would yield physically meaningless results. The systematic approach to error resolution presented in subsequent sections therefore emphasizes not merely achieving functional execution, but ensuring scientific validity throughout the simulation lifecycle.
Common grompp errors and resolution protocols
Invalid order for directive
Table 1: Troubleshooting "Invalid order for directive" errors
| Error Manifestation | Root Cause | Resolution Protocol | Validation Method |
|---|---|---|---|
Invalid order for directive bondtypes |
Introduction of new parameters after [ moleculetype ] directive |
Place #include "parameter_file" statements immediately after force field inclusion |
Successful grompp execution without order violations |
Invalid order for directive defaults |
Multiple [ defaults ] sections in topology |
Ensure [ defaults ] appears only once, typically in forcefield.itp |
Single [ defaults ] directive in processed topology |
Invalid order for directive atomtypes |
New atom types declared after molecule definitions | Position all [ *types ] directives before first [ moleculetype ] |
Consistent parameter resolution across molecules |
The "Invalid order for directive" error represents one of the most structurally deterministic grompp failures, occurring when the preprocessor encounters topology directives in sequences that violate GROMACS's strict ordering requirements. As delineated in the official documentation, this error frequently emerges when users introduce non-standard species (ligands, modified residues, or specialized solvents) whose parameter files contain type definitions positioned after molecular topology blocks [65]. The underlying architecture requires complete force field specification—including all atom types, bond types, and non-bonded parameters—before any molecular definitions commence, ensuring parameter resolution occurs in a chemically consistent namespace.
Experimental Protocol: Directive Order Correction
- Identify the problematic directive from the error message (e.g.,
bondtypes,atomtypes,defaults). - Locate the file containing this directive using
grep -r "directive_name" .within the working directory. - If the directive appears in a specialized .itp or .prm file (e.g.,
CUR.prm), ensure its inclusion statement (#include "filename") appears immediately after the primary force field inclusion and before any[ moleculetype ]sections [66]. - For multiple
[ defaults ]directives, retain only the instance in the primary force field file (forcefield.itp) and comment out redundant occurrences in included files using semicolons:; [ defaults ][65]. - Execute
gromppwith verbose output (-v) to confirm correct directive processing order.
This protocol resolves approximately 92% of directive ordering errors according to community-reported cases, with remaining failures typically involving deeply nested include files that require topological sorting of dependency relationships [66].
Residue/atom not found in topology database
Table 2: Troubleshooting missing residue and atom errors
| Error Type | Primary Cause | Solution Pathways | Applicability Context |
|---|---|---|---|
Residue 'XXX' not found in residue topology database |
Force field lacks residue definition | 1. Rename residue to match database2. Create custom residue topology3. Use alternative force field | Non-standard residues, naming mismatches |
Atom X is missing in residue XXX |
Structural incompleteness or hydrogen mismatches | 1. Use -ignh for hydrogen regeneration2. Model missing atoms externally3. Verify terminal residue naming |
Incomplete PDB files, hydrogen nomenclature |
Atom X in residue YYY not found in rtp entry |
Atom naming mismatch with force field expectations | 1. Rename atoms to match rtp conventions2. Verify force field compatibility | Non-standard coordinate files, foreign force fields |
The absence of residue or atom definitions in the topology database represents a fundamental parameterization gap that prevents grompp from constructing a complete molecular mechanics model. For drug development researchers working with non-standard ligands or modified amino acids, this error occurs with particularly high frequency, reflecting the divergence between biochemical diversity and force field coverage. Official documentation emphasizes that force fields possess defined boundaries regarding parameterized residues and molecules, with pdb2gmx incapable of magically generating parameters for undefined chemical entities [65].
Experimental Protocol: Missing Residue Resolution
- Database Verification: Consult the force field's residue topology database (rtp) located in
$GMXDATA/top/forcefield.ff/to confirm residue absence versus naming mismatch. - Nomenclature Alignment: For known residues with naming discrepancies (e.g., PDB HIS versus force field HSD/HSE/HSP), modify residue names in the coordinate file to match force field conventions.
- External Parameter Sourcing: When residues are genuinely absent, search specialized parameter databases (CGenFF, ATB, SWISS-PARAM) for compatible topology and parameter files.
- Custom Topology Development: As a last resort, undertake manual parameterization using:
- Quantum chemical calculations for bond/angle equilibrium values
- RESP charges for electrostatic compatibility
- Validation against experimental or quantum reference data
- Topology Integration: Incorporate obtained parameters via
#includestatements after force field declaration, ensuring all necessary[ *types ]directives are present.
For missing atom errors, the protocol diverges based on atom type. Missing hydrogens can typically be regenerated using pdb2gmx -ignh, which replaces existing hydrogens with force-field-appropriate variants [65]. For missing heavy atoms, external modeling tools like Chimera, Modeller, or Swiss PDB Viewer must reconstruct coordinates before grompp execution, as GROMACS contains no native capacity for building missing non-hydrogen atoms [67].
Found a second defaults directive
The "Found a second defaults directive" error exemplifies a specific category of topological inconsistency where redundant force field definitions create ambiguous parameter spaces. This failure occurs when the [ defaults ] directive appears multiple times across the collection of topology files processed by grompp, violating the requirement for singular specification of combination rules, non-bonded function types, and pair interaction treatment [65]. In practice, this frequently emerges when researchers combine topology files from disparate sources—such as incorporating ligand parameters from external repositories—without verifying their structural self-consistency regarding force field declaration.
Experimental Protocol: Defaults Directive Consolidation
- Identify all files containing
[ defaults ]directives using:grep -r "defaults" *.itp *.top - Determine the authoritative
[ defaults ]section from your primary force field selection (e.g.,forcefield.itp). - Comment out redundant
[ defaults ]sections in all other included files by prepending each line with semicolons: - Verify that no more than one active
[ defaults ]directive remains after preprocessing. - If attempting to mix force fields (strongly discouraged), reconsider strategy to maintain single-force-field consistency throughout the system.
This protocol emphasizes that the [ defaults ] directive establishes fundamental physical interaction models that must remain consistent across all system components. Force field mixing inevitably creates thermodynamic inconsistencies that undermine simulation validity, particularly in drug-binding contexts where free energy calculations depend critically on balanced non-bonded parameterization [65] [67].
Common mdrun errors and resolution protocols
LINCS warnings and constraints failures
The "Too many LINCS warnings" error represents one of the most clinically significant mdrun failures in production simulations, indicating systematic breakdown in constraint satisfaction that typically propagates to eventual simulation explosion. This error manifests specifically when the Linear Constraint Solver (LINCS) cannot converge on bond-length preservation within acceptable iteration limits, reflecting underlying structural instabilities, inappropriate timesteps, or excessive forces [68]. In pharmaceutical research contexts, LINCS failures occur particularly frequently during membrane protein simulations (e.g., ion channels, GPCRs) where complex lipid environments and structural transitions create challenging numerical landscapes.
Experimental Protocol: LINCS Resolution Workflow
- Immediate Intervention:
- Increase LINCS iteration count (
lincs_iter) from default 1 to 2-4 in .mdp file - Expand LINCS order (
lincs_order) from 4 to 6-8 for improved numerical stability - Verify constraint accuracy by comparing
lincs-warnangleto actual bond angles
- Increase LINCS iteration count (
Structural Diagnosis:
- Examine initial structure for atomic clashes, unusual geometries, or malformed rings
- Verify proper hydrogen placement, particularly for rotatable groups and tautomeric states
- Check for insufficient equilibration using energy and temperature traces
Parameter Adjustment:
- Reduce simulation timestep from 2fs to 1fs, particularly with hydrogen mass repartitioning
- Increase energy minimization convergence criteria (
emtol) to 100-500 J/mol/nm - Extend equilibration duration, particularly for pressure coupling stabilization
Advanced Resolution:
- For membrane systems, ensure lipid parameters match headgroup bonding patterns
- For ligand-containing systems, validate torsion parameters against quantum benchmarks
- Implement gradual heating protocols (0→100→200→300K) with positional restraints
Community experience indicates that approximately 70% of LINCS warnings resolve through increased iteration counts and improved minimization, while persistent failures typically signal fundamental parameterization issues requiring topologically consistent solutions [68].
Out of memory errors
Memory allocation failures during mdrun execution represent hardware-level constraints that increasingly challenge researchers as system sizes grow into the 100,000+ atom regime common in contemporary drug discovery simulations. These errors occur when the combined requirements for coordinate storage, force buffers, neighbor lists, and communication overhead exceed available RAM, particularly on GPU-accelerated systems where device memory presents stricter limitations than host memory [65]. The mathematical scaling of memory requirements follows complex relationships with system size (N), with neighbor lists scaling as O(N), PME meshes as O(NlogN), and certain analysis buffers as O(N²), creating nonlinear memory demand growth.
Experimental Protocol: Memory Optimization Framework
- Problem Scope Reduction:
- Process trajectory segments sequentially rather than complete trajectories
- Limit atom selections for analysis to essential subsets
- Increase trajectory output frequency (
nstxout) to reduce in-memory caching
Algorithmic Efficiency:
- Adjust neighbor list frequency (
nstlist) to 20-40 steps for optimal memory/performance balance - Consider particle decomposition instead of domain decomposition for small systems
- Utilize memory-efficient analysis tools (
gmx traj,gmx rms) over full-trajectory approaches
- Adjust neighbor list frequency (
Hardware Solutions:
- Allocate additional computational resources with expanded RAM capacity
- For GPU systems, utilize
-ddorderto optimize CPU-GPU memory transfer patterns - Implement multi-level parallelization (
-ntmpi,-ntomp) to distribute memory load
Research Reagent Solutions: Computational Resources
| Resource Component | Function in MD Simulation | Specification Guidelines |
|---|---|---|
| System RAM | Stores coordinates, velocities, forces, neighbor lists | 32GB minimum, 128GB+ for membrane-protein complexes |
| GPU Memory | Accelerates non-bonded force calculations, PME | 8GB minimum, 16-24GB for large systems with PME |
| Storage I/O | Handles trajectory output, restart files | SSD arrays with TB-scale capacity for production runs |
| CPU Cores | Parallelizes bonded calculations, analysis | 16-64 cores based on system size and sampling requirements |
A critical but often overlooked source of memory-related failures stems from unit confusion during system setup, where Ångström instead of nanometer specifications can create solvent boxes 10³ times larger than intended, immediately exhausting available memory during grompp or initial mdrun steps [65] [69]. Verification of unit consistency across all input files represents an essential preventive measure within the simulation setup workflow.
Performance regressions and hardware-specific issues
The specialized nature of high-performance MD computation creates vulnerability to performance regressions in specific hardware-software configurations, where otherwise valid simulations experience catastrophic slowdowns or numerical instabilities. Official documentation identifies several known issues affecting contemporary systems, including severe performance degradation with SVE and LLVM 20 on AArch64 CPUs, suboptimal multi-instance execution on AMD GPUs, and compiler-specific failures on POWER9 architectures [70]. These platform-dependent behaviors necessitate tailored resolution strategies that maintain scientific validity while restoring computational efficiency.
Experimental Protocol: Performance Regression Diagnosis
- Configuration Identification:
- Document exact GROMACS version, compilation options, and hardware environment
- Verify compatibility matrices between GCC/LLVM versions and target architectures
- Check for known issues in the GROMACS manual corresponding to your version
Platform-Specific Solutions:
- For AArch64 SVE regressions with LLVM 20: compile with
-DGMX_SIMD=ARM_NEON_ASIMDor downgrade to LLVM 19 - For AMD GPU multi-instance limitations: set
ROCR_VISIBLE_DEVICESfor single-GPU process isolation - For POWER9 GCC 12-14 failures: utilize GCC 12.5+, GCC 13.4+, GCC 14.2+, or GCC 11/15
- For AArch64 SVE regressions with LLVM 20: compile with
Performance Validation:
- Compare performance against standardized benchmark systems (peptide, lipid, water)
- Verify simulation correctness through energy conservation tests in NVE ensemble
- Profile component timings to identify specific algorithmic bottlenecks
The modular simulator introduced in recent GROMACS versions generally provides superior checkpointing correctness compared to the legacy simulator, particularly for expanded ensemble simulations where buggy checkpoint recording could compromise restart reproducibility [70]. Researchers utilizing advanced sampling methodologies should preferentially employ the modular code path through appropriate mdrun flags.
Integrated troubleshooting workflow
The interrelationship between grompp and mdrun errors necessitates an integrated diagnostic approach that maps failure symptoms to underlying causes across the simulation workflow. The following decision framework provides a systematic methodology for error resolution, progressing from superficial manifestations to fundamental parameterization issues.
Diagram 1: Integrated troubleshooting workflow for GROMACS errors
This workflow formalizes the error resolution process that experienced computational researchers develop through iterative simulation experience. The bidirectional relationship between grompp and mdrun failures becomes particularly evident when persistent execution errors necessitate returning to system preparation stages, underscoring the principle that successful production runs depend fundamentally on careful parameterization and topological consistency established during preprocessing.
Preventive strategies and best practices
Systematic simulation setup protocol
Beyond reactive error resolution, implementing preventive strategies throughout the simulation setup process significantly reduces grompp and mdrun failure incidence. Based on documented error patterns and their resolutions, the following integrated protocol establishes methodological rigor from initial structure preparation to production execution:
Experimental Protocol: Preventive Simulation Setup
- Structure Validation:
- Complete missing residues and atoms using Modeller, Chimera, or SWISS-MODEL before
pdb2gmx - Verify hydrogen placement matches force field protonation state conventions
- Check for atomic clashes using VMD's internal coordinate analysis
- Complete missing residues and atoms using Modeller, Chimera, or SWISS-MODEL before
Topological Consistency:
- Maintain single force field consistency throughout all system components
- Position all
[ *types ]directives before any[ moleculetype ]definitions - Validate charge summation matches expected integer values within floating-point tolerance
Parameter Optimization:
- Implement multi-stage energy minimization with progressively relaxed restraints
- Utilize gradual heating protocols (0→100→200→300K) with coupling time constants of 1-2 ps
- Ensure neighbor list frequency (
nstlist) ≥ 10 for Verlet lists, ≥ 20 for GPU acceleration
Execution Readiness:
- Verify sufficient disk space for trajectory outputs (hundreds of GB to TB scale)
- Confirm adequate memory resources for system size and analysis requirements
- Validate compiler and library compatibility for target hardware architecture
This protocol emphasizes that preventive validation significantly reduces computational resource wastage on failed simulations, particularly important in drug development contexts where simulation throughput directly impacts research velocity. The integrated nature of these checks ensures that errors are caught at the earliest possible stage, where resolution requires minimal investment compared to production-stage failures.
Validation and verification framework
Establishing rigorous validation checkpoints throughout the simulation lifecycle provides objective metrics for system readiness while documenting parameter decisions for future reproducibility. The following framework adapts software engineering principles to MD simulation workflow, creating quality gates that must be satisfied before progression to subsequent stages:
Table 3: Simulation validation checkpoint framework
| Simulation Stage | Validation Metric | Acceptance Criterion | Corrective Action |
|---|---|---|---|
| Structure Preparation | Root mean square deviation (RMSD) from experimental reference | < 0.1 nm for backbone atoms | Additional minimization with restraints |
| Topology Generation | Total system charge deviation from integer value | < 0.01 electron | Verify ion placement and residue protonation |
| Energy Minimization | Potential energy reduction and force convergence | emtol ≤ 1000 kJ/mol/nm |
Increase minimization steps or improve initial structure |
| Equilibration NVT | Temperature stability and drift | ±5K fluctuation around target | Extend equilibration duration or adjust coupling |
| Equilibration NPT | Pressure and density stability | ±1 bar pressure, ±10 kg/m³ density | Extend equilibration or verify barostat settings |
| Production | Energy conservation (NVE test) | < 0.1% energy drift over 100ps | Reduce timestep or improve constraint accuracy |
This validation framework formalizes the informal checks experienced researchers employ intuitively, creating documented decision points that enhance research reproducibility and methodological transparency. In pharmaceutical development contexts, such formalized validation becomes particularly valuable for regulatory compliance and method transfer between research teams.
Within the comprehensive thesis of molecular dynamics simulation setup in GROMACS, proficient troubleshooting of grompp and mdrun errors represents an essential competency that transforms computational obstacles into systematic challenges with methodical solutions. This application note has established that the majority of preprocessing and execution failures stem from a finite set of root causes—directive ordering violations, topological incompleteness, parameter inconsistencies, and hardware limitations—each addressable through targeted resolution protocols. By integrating these diagnostic and corrective procedures into standardized simulation workflows, researchers can significantly enhance computational efficiency while maintaining the physical validity essential for scientifically meaningful results.
The progressive complexity of MD simulations in drug development, particularly involving membrane proteins, complex ligands, and multi-component systems, ensures that error resolution will remain an integral component of the computational research lifecycle. Rather than representing peripheral technical distractions, these troubleshooting activities provide valuable insights into force field behavior, system characterization, and numerical stability that fundamentally enhance researcher understanding of the simulation apparatus. Through adoption of the structured protocols and preventive frameworks presented herein, the research community can accelerate simulation deployment while maintaining the methodological rigor that underpins scientific discovery in computational biophysics and drug development.
Free-Energy Perturbation (FEP) stands as one of the most important computational techniques for calculating free-energy differences in molecular systems, with profound implications for drug discovery, protein engineering, and materials science. The method enables the determination of free-energy changes through alchemical transformations, where one chemical state is mathematically morphed into another via a series of non-physical intermediate states. Despite its theoretical elegance, FEP has traditionally been hampered by enormous computational demands that limited its practical application. The emergence of graphics processing unit (GPU) acceleration has dramatically transformed this landscape, making FEP calculations more accessible and efficient than ever before.
The fundamental challenge FEP addresses is calculating the free-energy difference, ΔA₀→₁, between a reference state (0) and a target state (1). According to the foundational FEP equation, this difference can be determined as ΔA₀→₁ = -kBT ln⟨exp[-βΔU(x)]⟩₀, where ΔU(x) = U₁(x) - U₀(x) represents the potential energy difference between the two states, β = 1/kBT, and the angle brackets denote an ensemble average over configurations sampled from the reference state [71]. In practice, spontaneous transitions between structurally distinct states are rare, necessitating the introduction of multiple intermediate states characterized by a coupling parameter λ that smoothly interpolates between the endpoints (λ=0 for the reference state and λ=1 for the target state) [71] [72].
Recent advances in GPU computing have revolutionized FEP implementations across major molecular dynamics packages. While early GPU acceleration primarily benefited equilibrium MD simulations, FEP-specific functionalities have now been successfully ported to GPU architectures, yielding remarkable performance improvements. In GROMACS, traditionally one of the fastest MD engines, FEP calculations can now achieve up to nearly 800% speedup on NVIDIA A100 GPUs compared to 32-core CPU implementations, reducing absolute binding free-energy calculations for benchmark systems from 400 hours to approximately 48 hours [73]. Similar advances in NAMD have demonstrated up to 30-fold acceleration in single-node GPU code compared to CPU implementations [71]. These developments represent a paradigm shift, making FEP a more practical and cost-effective tool for scientific research and drug discovery pipelines.
Theoretical Foundation of FEP
Mathematical Framework
The theoretical foundation of Free-Energy Perturbation rests on statistical mechanics principles that connect microscopic interactions to macroscopic thermodynamic properties. The fundamental FEP formula derived from the partition function relationship between free energy and potential energy provides the formal basis for computational implementation:
ΔA₀→₁ = -kBT ln⟨exp[-β(U₁(x) - U₀(x))]⟩₀
This equation, while exact in theory, poses practical challenges because the reference state ensemble ⟨···⟩₀ typically has poor overlap with the target state when U₀ and U₁ differ significantly. This results in slow convergence of the ensemble average as the system rarely samples configurations important for the target state [71] [74].
To address this limitation, the transformation is stratified into N-1 intermediate states, creating a pathway of N windows connecting the initial and final states. The potential energy for each intermediate state i is defined as a linear combination:
Uλᵢ(x) = U₀(x) + λᵢΔU(x) for 0 ≤ λᵢ ≤ 1
The total free-energy difference then becomes the sum of differences between adjacent windows:
ΔA₀→₁ = Σᵢ₌₁ᴺ ΔAλᵢ₋₁→λᵢ = -β⁻¹ Σᵢ₌₁ᴺ ln⟨exp{-β[Uλᵢ(x) - Uλᵢ₋₁(x)]}⟩λᵢ₋₁
This stratified approach ensures sufficient phase space overlap between neighboring states, enabling accurate computation of the free-energy difference [71] [72].
Alchemical Transformation Pathways
The λ parameter serves as a computational "dial" that controls the transformation between states. In practice, separate λ schedules are often employed for different interaction types. For example, Coulombic (electrostatic) and Lennard-Jones (van der Waals) interactions may be transformed on different λ scales to improve numerical stability and convergence [75]. A typical dual-topology approach, employed in implementations like NAMD's FEP, ignores interactions between atoms unique to the reference state and those unique to the target state, while scaling all bonded and non-bonded contributions according to λ [71].
To avoid singularities (so-called "end-point catastrophes") that occur when particles appear or disappear at λ endpoints, soft-core potentials are employed. For Lennard-Jones interactions, this takes the form:
Uλₖᴸᴶ(x) = (1-λₖ)[A₁/(r² + δλₖ)⁶ - B₁/(r² + δλₖ)³] + λₖ[A₀/(r² + δλₖ)⁶ - B₀/(r² + δλₖ)³]
where r is the interatomic distance, A and B are the repulsive and attractive LJ parameters, and δ is a soft-core parameter that prevents singularity when λ approaches 0 or 1 [71]. Similar soft-core treatments are applied to Coulombic interactions to ensure smooth transitions throughout the alchemical pathway.
Table 1: Key Mathematical Components of FEP Simulations
| Component | Mathematical Formulation | Purpose in FEP |
|---|---|---|
| Free Energy Difference | ΔA₀→₁ = -kBT ln⟨exp[-βΔU]⟩₀ | Fundamental FEP equation |
| Intermediate States | Uλᵢ(x) = U₀(x) + λᵢΔU(x) | Ensures phase space overlap |
| Soft-Core Potential | Uᴸᴶ(r) = A/(r² + δλ)⁶ - B/(r² + δλ)³ | Prevents end-point singularities |
| Bennett Acceptance Ratio | ΔA = kBT ln[⟨f(U₁-U₀+C)⟩₀/⟨f(U₀-U₁-C)⟩₁] + C | Optimal estimator for FEP calculations |
| Thermodynamic Integration | ΔA = ∫⟨∂U/∂λ⟩λ dλ | Alternative FEP estimation method |
Free Energy Estimators
While the exponential averaging in the fundamental FEP equation provides a direct route to free-energy differences, more sophisticated estimators have been developed to improve statistical accuracy. The Bennett Acceptance Ratio (BAR) method has emerged as a particularly powerful approach, leveraging the relationship:
ΔA = kBT ln[⟨f(U₁-U₀+C)⟩₀/⟨f(U₀-U₁-C)⟩₁] + C
where f(x) = 1/(1+exp(βx)) is the Fermi function, and C is a constant chosen to optimize the estimate [72]. BAR typically provides superior convergence compared to direct exponential averaging, especially for transformations with limited phase space overlap between endpoints. Thermodynamic Integration (TI) offers an alternative approach by computing the integral of ⟨∂U/∂λ⟩ over λ, which can be more numerically stable for certain types of transformations [74]. Modern implementations often compute the data needed for multiple estimators simultaneously, allowing researchers to compare results and assess consistency.
GPU Implementation and Optimization
Architectural Advantages of GPUs for FEP
The remarkable acceleration of FEP calculations on GPU architectures stems from fundamental architectural differences between GPUs and CPUs. GPUs are designed with massively parallel structures containing thousands of simpler cores optimized for simultaneous computation, making them exceptionally well-suited for the computational patterns in molecular dynamics. In FEP simulations, the evaluation of non-bonded interactions (Lennard-Jones and Coulombic) represents the dominant computational cost, requiring calculation of forces between all atom pairs within cutoff distances. These calculations are inherently parallelizable, as force calculations between different atom pairs can be performed independently [71] [73].
GPU implementations of FEP organize computation into specialized compute objects according to an object-oriented design, aggregating data from objects of the same class to schedule workload to CUDA kernels more effectively. This design enables code reuse and optimizes memory access patterns, which is crucial for achieving high computational throughput. In traditional CPU code, the calculation of non-bonded forces for FEP requires conditional statements to handle the λ-dependent scaling of interactions, which can disrupt pipeline efficiency. On GPUs, these conditionals can be managed through specialized kernels or warp-level operations that maintain high utilization of computational units [71].
GROMACS-Specific GPU FEP Implementation
The GROMACS MD engine has incorporated increasingly sophisticated GPU acceleration for FEP calculations through recent versions. While early GPU implementations in GROMACS focused on offloading non-bonded interactions for standard MD simulations, FEP-specific calculations remained on CPUs. Recent optimizations have extended GPU acceleration to the complete FEP workflow, including the λ-dependent scaling of interactions and soft-core potential evaluations [73].
In GROMACS's implementation, the GPU calculates all non-bonded forces, including those affected by λ coupling, when the -nb gpu option is specified. The kernel functions responsible for non-bonded interactions have been modified to incorporate the λ-dependent scaling of interactions and soft-core potential modifications. For each atom pair in the neighbor list, the GPU kernel computes energy terms using the soft-core potential and scales them according to the current λ value. This approach minimizes CPU-GPU data transfer, which would otherwise create a significant performance bottleneck [73] [54].
The bonding interactions, while less computationally intensive than non-bonded forces, have also been ported to the GPU in optimized implementations. The bonded forces are calculated as a linear combination of the reference and target states based on λ, following the equation:
ΔUλᵢ₋₁→λᵢᵇᵒⁿᵈᵉᵈ = Uλᵢᵇᵒⁿᵈᵉᵈ(x) - Uλᵢ₋₁ᵇᵒⁿᵈᵉᵈ(x)
where Uλₖᵇᵒⁿᵈᵉᵈ(x) represents the bonded energy at intermediate state k [71]. By keeping both bonded and non-bonded calculations on the GPU, the implementation minimizes synchronization points and data transfer overhead, resulting in significantly improved performance compared to hybrid CPU-GPU approaches.
Performance Benchmarks and Real-World Applications
Comprehensive benchmarking of GPU-accelerated FEP in GROMACS reveals dramatic performance improvements across diverse biological systems. In validation studies conducted on benchmark systems containing eight ligand-protein pairs, including two charged ligands, absolute binding free energies predicted on NVIDIA A100 and MetaX C500 GPUs showed excellent agreement (approximately 1.0 kcal/mol) with previous CPU-computed results [73]. The performance gains, however, far exceeded marginal improvements, with GPU-accelerated FEP calculations demonstrating up to nearly 800% and 400% speedups on NVIDIA A100 and MetaX C500 GPUs, respectively, compared to 32-core CPU implementations [73].
These performance improvements translate directly to reduced time-to-solution for practical research applications. End-to-end absolute binding free-energy calculations for benchmark systems were reduced from 400 hours to around 48 hours on the A100 GPU [73]. In real-world drug discovery applications, such as alchemical scanning mutagenesis of peptide-protein complexes, GPU acceleration has enabled studies that would previously have been computationally prohibitive. The performance gains are particularly pronounced for systems with explicit solvent, where the evaluation of solvent-solute interactions dominates the computational cost.
Table 2: Performance Comparison of FEP Calculations on Different Hardware Platforms
| Hardware Platform | Relative Speed | Power Efficiency | Optimal Use Case |
|---|---|---|---|
| 32-core CPU | 1.0x (baseline) | 1.0x (baseline) | Small systems, limited GPU access |
| NVIDIA A100 GPU | 8.0x faster | ~12x more efficient | Production simulations, large systems |
| MetaX C500 GPU | 4.0x faster | ~6x more efficient | Medium-sized systems, cost-effective deployment |
| Single GPU (Optimized Code) | Up to 30x faster | ~25x more efficient | Single-node workstations, rapid prototyping |
It is worth noting that achieving optimal GPU utilization for FEP requires appropriate system sizing. Performance benchmarks indicate that using a single PP rank per GPU with thousands of particles typically yields the highest efficiency [47]. Systems that are too small may not fully utilize the parallel capacity of modern GPUs, while excessively large systems may require multi-GPU parallelization strategies. The GROMACS build system and mdrun tool incorporate automated detection of hardware capabilities and can make effective use of available resources, though manual tuning is often beneficial for achieving peak performance [47].
Experimental Protocols and Workflows
System Preparation for FEP Simulations
Successful FEP calculations begin with careful system preparation. For solvation free energy calculations, the process starts with creating a topology for the molecule of interest using an appropriate force field. The molecule is then centered in a simulation box with sufficient padding (typically 1.0-1.2 nm) between the solute and box edges to avoid periodic image artifacts. The system is solvated with water molecules, and ions may be added to neutralize charge or achieve specific physiological concentrations [72]. For binding free energy calculations, the protein-ligand complex must be prepared, with particular attention to protonation states of ionizable residues in the binding site and proper orientation of the ligand within the binding pocket.
A critical consideration in FEP system preparation is the handling of covalent bonds between the transforming species and its environment. The couple-intramol option in GROMACS controls whether intramolecular interactions remain fully coupled during the transformation. Setting couple-intramol = no indicates that intramolecular interactions remain unchanged throughout the alchemical transformation, which can simplify the free energy calculation by focusing only on the solute-solvent or protein-ligand interactions [76]. The couple-moltype parameter specifies which molecule type will be alchemically transformed, while couple-lambda0 and couple-lambda1 define the interaction types at the endpoints of the transformation [75].
Lambda Window Selection and Simulation Parameters
The selection of λ values represents a crucial aspect of FEP protocol design. λ values must be spaced sufficiently close to ensure adequate phase space overlap between adjacent windows, while avoiding excessive computational cost from too many windows. For dual-scale transformations (separate λ for electrostatics and van der Waals), the coul-lambdas and vdw-lambdas parameters define the progression for each interaction type [75]. A typical dual-scale approach might involve 11 λ windows for van der Waals transformation (0.0, 0.1, 0.2, ..., 1.0) followed by 11 windows for electrostatic transformation, though the exact number and spacing should be optimized for the specific system.
The .mdp parameter free_energy = yes activates FEP calculations, with init_lambda_state specifying the starting λ window. The calc_lambda_neighbors = 1 option instructs GROMACS to only compute energies for immediate neighboring λ windows, reducing computational overhead [75]. Soft-core parameters must be carefully selected to avoid singularities while maintaining numerical stability: sc-alpha = 0.5, sc-power = 1, and sc-sigma = 0.3 represent typical values that work well for many systems [75]. The nstdhdl parameter controls how frequently energy differences are written to output, with more frequent output providing better statistics for analysis but increasing storage requirements.
Production Simulation and Analysis
Production FEP simulations are typically performed using a stochastic dynamics integrator (integrator = sd) with a time step of 0.002 ps. Temperature control is essential, with separate temperature coupling groups often defined for protein and non-protein atoms (tc-grps = Protein Non-Protein) using the Berendsen or Nosé-Hoover thermostat [75]. For binding free energy calculations in explicit solvent, pressure coupling is generally employed (pcoupl = Parrinello-Rahman) to maintain constant pressure, with tau_p = 2.0 and compressibility = 4.5e-5 representing typical values [75].
During production simulations, GPU utilization should be monitored to ensure efficient computation. Unlike standard MD simulations that may achieve near 100% GPU utilization, FEP calculations typically show lower GPU usage (e.g., 20-40%) due to additional computational overhead and synchronization requirements [75]. This reduced utilization is normal for FEP but can sometimes be improved through parameter adjustments such as increasing nstlist to reduce the frequency of neighbor list updates [54]. The -nstlist 300 flag, for example, can improve performance by moving more work from CPU to GPU [54].
Following production simulations, free energy analysis is performed using the Bennett Acceptance Ratio (BAR) method as implemented in gmx bar. The analysis requires energy difference files from all λ windows and computes the free energy difference between adjacent windows, then sums these differences to obtain the total free energy change. For transformations involving both electrostatic and van der Waals changes, the total solvation or binding free energy is computed as:
ΔG = -(ΔAᵥ𝒹𝓌 + ΔA𝒸ₒᵤₗ)
where ΔAᵥ𝒹𝓌 and ΔA𝒸ₒᵤₗ represent the free energy changes for van der Waals and electrostatic transformations, respectively [76]. Error estimation is a critical component of the analysis, typically performed through bootstrapping or block averaging to assess statistical uncertainty.
Optimization Strategies for GPU-Accelerated FEP
GROMACS Configuration and Command-Line Parameters
Optimal performance of GPU-accelerated FEP in GROMACS requires careful configuration of both compile-time and run-time parameters. When compiling GROMACS from source, the GMX_GPU option should be enabled for the target accelerator architecture (CUDA for NVIDIA GPUs, OpenCL for AMD GPUs, or SYCL for Intel GPUs). The GMX_SIMD option should match the highest SIMD instruction set supported by the host CPU, as this optimizes the remaining CPU-bound calculations [47]. For Intel Skylake and Cascade Lake processors, building with GMX_SIMD=AVX2_256 often yields better performance than AVX512 due to higher achievable clock frequencies [47].
At runtime, the -nb gpu (or -gpu_id) flag activates GPU offload of non-bonded interactions. For single-GPU simulations, setting -ntmpi 1 (one MPI rank) and -ntomp to the number of CPU cores typically yields best performance [54]. This configuration dedicates one CPU thread to managing the GPU while the remaining threads handle any CPU-bound calculations. The -pme gpu and -bonded gpu flags further offload PME and bonded calculations to the GPU, reducing CPU-GPU synchronization overhead. For CUDA implementations, setting GMX_CUDA_GRAPH=1 can reduce kernel launch overhead, particularly for simulations achieving very high step rates (e.g., >0.2 ms/step) [54].
System Setup and Decomposition Optimization
System size and composition significantly impact GPU FEP performance. As a general guideline, each MPI rank should contain thousands of particles to effectively utilize GPU resources [47]. For large systems, domain decomposition can be employed to distribute work across multiple GPUs, though communication overhead must be balanced against computational gains. The -dd option controls domain decomposition, with optimal settings dependent on system size and architecture. For PME simulations, dedicating a subset of ranks to PME calculations (e.g., one-quarter to one-half of ranks) often improves performance by reducing communication during 3D FFT calculations [47].
Neighbor list update frequency represents another important optimization parameter. The nstlist parameter in .mdp files controls how frequently neighbor lists are rebuilt, with higher values reducing computational overhead but potentially decreasing accuracy if lists become stale. For GPU simulations, increasing nstlist from the default of 100 to 200-400 can significantly improve performance by reducing the frequency of CPU-bound neighbor list operations [54]. The rlist parameter should be set approximately 0.2 nm longer than the rcoulomb and rvdw cutoffs to ensure neighbor lists remain valid between updates.
Table 3: Essential GROMACS Parameters for GPU-Accelerated FEP
| Parameter Category | Key Options | Recommended Settings | Performance Impact |
|---|---|---|---|
| GPU Offloading | -nb, -pme, -bonded |
gpu for all three |
Major (4-8x speedup) |
| Parallelization | -ntmpi, -ntomp |
-ntmpi 1, -ntomp [cores] |
Critical for balance |
| Neighbor Searching | nstlist, rlist |
200-400, >rcoulomb by 0.2nm |
Moderate (10-30%) |
| Lambda Management | calc_lambda_neighbors |
1 | Minor to moderate |
| Simulation Parameters | integrator, dt |
sd, 0.002 ps |
Ensures stability |
Monitoring and Troubleshooting Performance
Effective performance monitoring is essential for optimizing GPU-accelerated FEP simulations. The log file output by mdrun (md.log) contains a detailed performance table at the end, breaking down time spent in different computational components [54]. Key metrics to monitor include PME mesh time, non-bonded force calculation time, neighbor searching time, and communication time. For GPU-accelerated runs, the ratio of time spent in GPU operations versus CPU operations should be high, indicating effective offload.
Unexpectedly low GPU utilization (e.g., <20%) may indicate bottlenecks elsewhere in the simulation [75]. Common issues include:
- CPU-bound neighbor searching: Increase
nstlistto reduce frequency of neighbor list updates - Excessive CPU-GPU synchronization: Ensure
-bonded gpuand-pme gpuare enabled to minimize synchronization points - I/O bottlenecks: Reduce output frequency (
nstxout,nstvout,nstfout) or use compressed trajectory output - Load imbalance: Adjust domain decomposition parameters or use fewer MPI ranks per GPU
When running multiple λ windows concurrently, resource allocation should be carefully planned. For high-throughput FEP calculations, each λ window can be run as an independent simulation on separate GPU resources. Workflow management tools like those implemented in mdpow.fep can automate the setup, execution, and analysis of multi-window FEP calculations [76]. For large-scale studies involving many transformations, active learning approaches that strategically select λ windows based on preliminary results can optimize the trade-off between computational cost and accuracy [77].
The Scientist's Toolkit: Essential Research Reagents and Solutions
Table 4: Key Research Reagent Solutions for FEP Simulations
| Reagent/Solution | Function in FEP | Implementation Example |
|---|---|---|
| Soft-Core Potentials | Prevents singularities at λ endpoints | sc-alpha = 0.5, sc-sigma = 0.3 in GROMACS |
| Dual-Topology Approach | Handles non-common atoms between states | Ignore interactions between unique atoms in reference and target states |
| Bennett Acceptance Ratio (BAR) | Optimal estimator for free energy differences | gmx bar analysis tool in GROMACS |
| Linear Mixing Rules | Defines λ-dependence of Hamiltonian | Uλ(x) = U₀(x) + λΔU(x) |
| Alchemical Pathways | Stratifies transformation into windows | Separate vdw-lambdas and coul-lambdas schedules |
| Stochastic Dynamics Integrator | Efficient sampling with large timesteps | integrator = sd in GROMACS |
| GPU Compute Kernels | Parallelizes force calculations | CUDA, OpenCL, or SYCL implementations |
The integration of GPU acceleration with Free-Energy Perturbation methods has fundamentally transformed the landscape of computational molecular science. What was once a specialized technique requiring massive computational resources has become increasingly accessible, enabling researchers to tackle more complex biological problems with greater accuracy and efficiency. The performance gains achieved through GPU resident FEP implementations - up to 8x on modern hardware platforms - have expanded the scope of feasible simulations, from relative binding free energy calculations for drug optimization to absolute binding free energy predictions for virtual screening [73] [77].
Looking forward, several emerging trends promise to further advance GPU-accelerated FEP methodologies. The development of automated lambda scheduling algorithms reduces the guesswork in selecting appropriate λ windows, optimizing the trade-off between computational cost and statistical accuracy [77]. Active learning approaches that strategically combine FEP with faster, less accurate methods enable more efficient exploration of chemical space [77]. Force field improvements, particularly through the Open Force Field Initiative, continue to enhance the accuracy of molecular descriptions, while specialized treatments for covalent inhibitors expand the range of addressable biological targets [77]. As hardware evolves, with increasingly powerful and energy-efficient GPU architectures, and software matures, with more sophisticated workflow management tools, FEP calculations will become further integrated into standard research pipelines across pharmaceutical, biotechnology, and academic settings.
In conclusion, GPU-accelerated Free-Energy Perturbation represents a cornerstone of modern computational molecular science. When properly implemented with attention to the optimization strategies outlined in this work, researchers can leverage these powerful methods to uncover molecular insights that would otherwise remain inaccessible. The protocols, parameters, and performance considerations detailed here provide a roadmap for researchers seeking to implement these cutting-edge computational approaches in their own scientific investigations, particularly within the context of broader molecular dynamics simulation workflows in GROMACS. As the field continues to evolve, GPU-resident FEP will undoubtedly play an increasingly central role in accelerating scientific discovery and rational molecular design.
Validating Your Simulation: Ensuring Physical Accuracy and Reliability
The Critical Role of Physical Validation in MD Simulations
Molecular dynamics (MD) simulations have become an indispensable tool in computational biology and drug development, providing atomic-level insights into biological processes. However, the accuracy and reliability of these simulations depend critically on the correctness of the integration algorithms, force fields, and sampling methods. Physical validation refers to a suite of tests that check whether simulation results correspond to physical or mathematical expectations, serving as a crucial quality control measure before production simulations [78]. Unlike simpler regression tests, physical validation tests in GROMACS are computationally intensive, typically requiring "hours, not days" to complete, and are therefore run periodically rather than with every software build [78].
For researchers in drug development, implementing rigorous physical validation protocols ensures that simulation results can be trusted for critical decisions, such as predicting ligand-binding affinities or understanding protein dynamics. This application note outlines the key physical validation methodologies available in GROMACS, provides detailed experimental protocols, and illustrates how these tests fit within a comprehensive MD simulation workflow.
Three Pillars of Physical Validation
GROMACS implements three fundamental types of physical validation tests that examine different aspects of simulation quality and physical correctness.
Integrator Convergence Testing
Physical Principle: Symplectic integrators, such as the leap-frog and velocity Verlet algorithms used in GROMACS, conserve a constant of motion (like energy in microcanonical simulations) with fluctuations that scale quadratically with the time step [78]. This test verifies the correct implementation of the time integration algorithms by running simulations at different time steps and checking this expected scaling behavior.
Implementation Details: The convergence tests are performed on two model systems:
- Argon system (1000 atoms)
- Water system (900 molecules)
These tests are particularly sensitive to numerical precision and thus require careful parameter selection, including long-range corrections for both Lennard-Jones and electrostatic interactions, very low pair-list tolerance (verlet-buffer-tolerance = 1e-10), and high LINCS settings where applicable [78]. The tests compare the md (leap-frog) and md-vv (velocity Verlet) integrators with different long-range correction methods.
Kinetic Energy Distribution Validation
Physical Principle: In an equilibrated system sampling a canonical (NVT) or isothermal-isobaric (NPT) ensemble, the kinetic energy trajectory is expected to follow a Maxwell-Boltzmann distribution [78]. This test compares the observed distribution of kinetic energies against this physically expected distribution.
Implementation Details: The validation uses the same argon and water systems as the integrator tests, with simulations running for 1ns at a 2fs time step using the Verlet cut-off scheme. The tests cover multiple thermodynamic ensembles and thermostat/barostat combinations to thoroughly validate the kinetic energy sampling.
Configurational Quantities Validation
Physical Principle: While the exact distribution of configurational quantities like potential energy or volume is generally unknown analytically, the ratio of probability distributions between samples of the same ensemble at different state points (e.g., different temperatures or pressures) is known [78]. This allows validation by comparing two simulations at different state points.
Implementation Details: The tests examine various combinations of:
- Thermostats:
v-rescaleandNose-Hoover - Barostats:
Parrinello-RahmanandMTTK(for NPT simulations) - Integrators:
mdandmd-vv
All thermostats are applied to the entire system (tc-grps = system), with other settings left at default values to test the most commonly used configurations [78].
Table 1: Physical Validation Test Categories in GROMACS
| Validation Type | Physical Principle | Test Systems | Key Parameters Tested |
|---|---|---|---|
| Integrator Convergence | Symplectic integrators conserve energy with quadratic Δt dependence [78] | Argon (1000 atoms), Water (900 molecules) | integrator (md, md-vv), long-range corrections |
| Kinetic Energy Distribution | Equilibrated systems should show Maxwell-Boltzmann distribution [78] | Argon, Water (with SETTLE and PME) | tcoupl (v-rescale, nose-hoover), pcoupl |
| Configurational Quantities | Ratio of distributions at different state points is known [78] | Argon, Water | Temperature, pressure coupling schemes |
Implementation and Workflow
Building GROMACS with Physical Validation
Physical validation tests are opt-in features in GROMACS, disabled by default due to their computational cost. To enable them, GROMACS must be compiled with the -DGMX_PHYSICAL_VALIDATION=ON CMake option [78]. Once compiled, several make targets become available for running validation tests:
make check-phys: Builds binaries and runs all physical validation tests (may take several hours)make check-phys-prepare: Prepares simulation files and run scripts for execution on external resourcesmake check-phys-analyze: Analyzes existing simulation results without running new simulationsmake check-all: Runs both standard tests and physical validation tests [78]
This flexible approach allows researchers to prepare simulation inputs on one system (e.g., a login node), execute them on high-performance computing resources, and analyze the results later.
Direct Python Script Usage
For advanced users, the physical validation tests can be executed directly through the Python script tests/physicalvalidation/gmx_physicalvalidation.py, independent of the build system [78]. This script requires a JSON file defining the tests to run and offers options to:
- Prepare simulations only
- Prepare and run simulations
- Analyze existing simulations
- Perform all steps in sequence
The JSON configuration file specifies test names, system directories, validations to perform, and any special arguments for grompp or mdrun.
Experimental Protocols
Comprehensive Validation Protocol
For researchers establishing a new simulation workflow or validating force field parameters, we recommend the following comprehensive protocol:
Step 1: System Preparation
- Begin with standard test systems (argon or water) before moving to more complex biological systems
- Ensure proper solvation and ionization using
gmx solvateandgmx insert-molecules[32] - Generate topologies using appropriate tools (
gmx pdb2gmxfor proteins, other tools for small molecules)
Step 2: Energy Minimization
- Run energy minimization to remove bad contacts and high-energy configurations
- Consider minimizing solute structures in vacuo before adding solvent
- Use flexible water models and avoid bond constraints during initial minimization [32]
Step 3: Equilibration
- Implement staged equilibration starting with NVT ensemble with position restraints on solute
- Transition to NPT ensemble to achieve correct density
- Use the
c-rescalebarostat for better stability [32] - Gradually release position restraints during equilibration
Step 4: Physical Validation Execution
- Execute the three core validation tests (integrator convergence, kinetic energy distribution, configurational quantities)
- For production simulations, run validations on a smaller representative system
- Compare results against expected physical behavior
Step 5: Production Simulation
- Only proceed to production simulations after successful validation
- Maintain consistent parameters between validation and production runs
- Continue to monitor key physical quantities during production runs
Key Configuration Parameters
Table 2: Critical .mdp Parameters for Physical Validation
| Parameter | Recommended Value | Physical Significance |
|---|---|---|
integrator |
md (leap-frog) or md-vv (velocity Verlet) [56] |
Time-stepping algorithm affects energy conservation |
dt |
0.001-0.002 ps [78] | Time step impacts numerical stability and energy drift |
tcoupl |
v-rescale [78] |
Thermostat type affects kinetic energy distribution |
pcoupl |
parrinello-rahman or mttk [78] |
Barostat for pressure coupling in NPT simulations |
constraint-algorithm |
lincs or settle [60] |
Constraint algorithm affects energy redistribution |
coulombtype |
PME [79] |
Long-range electrostatics treatment |
vdwtype |
PME or cut-off with modifier [78] |
Van der Waals interactions treatment |
verlet-buffer-tolerance |
1e-10 (for validation) [78] |
Controls pair list update frequency |
The Scientist's Toolkit
Table 3: Essential Research Reagent Solutions for Physical Validation
| Reagent/Resource | Function in Validation | Implementation Example |
|---|---|---|
| Validation Test Systems | Standardized systems for comparing results | Argon (1000 atoms), Water (900 molecules) [78] |
| Force Field Files | Defines interaction parameters | ffnonbonded.itp, ffbonded.itp [35] |
| Thermostat Algorithms | Regulates temperature sampling | v-rescale, nose-hoover [78] |
| Barostat Algorithms | Maintains pressure in NPT simulations | parrinello-rahman, mttk [78] |
| Constraint Algorithms | Handles bond constraints | LINCS, SHAKE, SETTLE [60] |
| Long-Range Electrostatics | Handles non-bonded interactions beyond cutoff | PME [79] |
| Periodic Boundary Conditions | Minimizes finite-size effects | Triclinic boxes, rhombic dodecahedron [80] |
Advanced Considerations
Troubleshooting Common Validation Failures
When physical validation tests fail, they indicate potential problems with the simulation setup, integration algorithms, or sampling methods. Common issues and solutions include:
Failed Integrator Convergence Tests
- Problem: Energy conservation doesn't show expected quadratic dependence on time step
- Possible Causes: Non-continuous potential functions, imprecise constraint handling, incorrect long-range treatments [78]
- Solutions: Increase long-range correction accuracy, adjust constraint tolerance (
lincs-order,lincs-iter), verify potential function continuity
Incorrect Kinetic Energy Distribution
- Problem: Observed distribution deviates from Maxwell-Boltzmann
- Possible Causes: Insufficient equilibration, incorrect thermostat implementation, inadequate sampling [78]
- Solutions: Extend equilibration time, verify thermostat parameters (
tau-t,tc-grps), increase simulation duration
Incorrect Configurational Quantities
- Problem: Distribution ratios don't match expected values at different state points
- Possible Causes: Improper ensemble sampling, phase space limitations, incorrect pressure/temperature coupling [78]
- Solutions: Verify ensemble implementation, check for system artifacts, validate coupling algorithm parameters
Integration with Research Workflows
For drug development professionals, physical validation should be integrated at multiple stages of the research pipeline:
Force Field Development
- Validate new force field parameters against standard physical expectations
- Test across multiple thermodynamic conditions
- Verify transferability between different molecular systems
Simulation Protocol Development
- Establish baseline validation for new simulation protocols
- Test sensitivity to key parameters (time step, cut-off distances, etc.)
- Document validation results for methodological publications
Production Simulation Quality Control
- Implement periodic validation during long-term simulations
- Monitor for physical drift indicating numerical issues
- Maintain audit trails of validation results for regulatory compliance
By implementing rigorous physical validation protocols, researchers can significantly enhance the reliability of their MD simulations, leading to more confident predictions in drug design and biomolecular research. The comprehensive validation framework provided by GROMACS serves as an essential component in the computational scientist's toolkit, bridging the gap between theoretical models and physically meaningful results.
Molecular dynamics (MD) simulations have become an indispensable tool in computational chemistry and drug development, enabling researchers to study the behavior of biological systems at atomic resolution. However, the reliability of simulation results depends critically on the correct implementation of integration algorithms and sampling of thermodynamic ensembles. GROMACS addresses this need through its physical validation framework, which tests whether simulation results correspond to physical or mathematical expectations [81]. Unlike traditional unit tests that run in "seconds, not minutes," physical validation tests are more computationally intensive, aiming for "hours, not days" [81]. For researchers preparing MD simulations as part of a thesis or drug development project, these validation tests provide crucial verification that their simulation methodology produces physically meaningful results before investing in production runs.
Physical Validation Test Framework
The physical validation suite in GROMACS 2025.0 currently implements three fundamental types of tests that probe different aspects of simulation correctness:
- Integrator convergence: Verifies that symplectic integrators conserve constants of motion with fluctuations that are quadratic in the time step [81]
- Kinetic energy distribution: Validates that the kinetic energy trajectory of an equilibrated system follows the Maxwell-Boltzmann distribution expected for canonical or isothermal-isobaric ensembles [81]
- Distribution of configurational quantities: Tests whether the probability distributions of potential energy or volume correspond to physical expectations by comparing simulations at different state points [81]
Implementation and Execution Modes
The physical validation tests are designed as an opt-in feature during the GROMACS build process, controlled by the -DGMX_PHYSICAL_VALIDATION=ON CMake flag (OFF by default) [81]. This design reflects the computational cost of these tests, which makes them unsuitable for every build but essential for periodic verification. The framework provides multiple execution targets to accommodate different workflows:
Table: Make Targets for Physical Validation Tests
| Make Target | Functionality | Typical Use Case |
|---|---|---|
make check-phys |
Builds binaries and runs all physical validation tests | Comprehensive testing when sufficient computational resources are available |
make check-phys-prepare |
Prepares simulation files and rudimentary run scripts | Preparing tests for execution on external resources or scheduled jobs |
make check-phys-analyze |
Analyzes existing simulation results | Processing pre-computed trajectories without re-running simulations |
make check-all |
Combines standard tests and physical validation | Complete verification including unit tests and physical validation |
For advanced users, the Python script tests/physicalvalidation/gmx_physicalvalidation.py can be used independently of the make system, providing greater control over test parameters and execution [81].
Integrator Convergence Tests
Theoretical Foundation
In molecular dynamics, symplectic integrators are prized for their numerical stability and conservation properties. Mathematically, a symplectic integrator should conserve a constant of motion (such as energy in microcanonical simulations) with fluctuations that scale quadratically with the time step [81]. The integrator convergence tests verify this fundamental property by comparing constant-of-motion trajectories generated using different time steps with otherwise identical simulation parameters. Deviations from the expected behavior may indicate problems not only with the integration algorithm itself but also with other aspects of the model such as discontinuous potential functions or imprecise constraint handling [81].
Test Systems and Parameters
The convergence tests utilize two well-characterized systems: a simple Argon system (1000 atoms) and a more complex water system (900 molecules) [81]. These systems are simulated under NVE (microcanonical) conditions with high-precision settings to minimize numerical errors, including long-range corrections for both Lennard-Jones and electrostatic interactions, very low pair-list tolerance (verlet-buffer-tolerance = 1e-10), and high-accuracy LINCS settings where applicable [81].
Table: Integrator Convergence Test Parameters
| Parameter | Argon System | Water System |
|---|---|---|
| Integrators tested | md, md-vv |
md, md-vv |
| LJ long-range corrections | PME, Cut-off with force-switch | PME, Cut-off with force-switch |
| Electrostatics | Not applicable | PME with fourierspacing = 0.05 |
| Constraint algorithms | Not applicable | LINCS (lincs-order = 6, lincs-iter = 2), none, SETTLE |
| Simulation ensemble | NVE | NVE |
The tests systematically evaluate different combinations of integration algorithms and long-range correction methods to ensure robust validation across commonly used simulation protocols.
Ensemble Validation Tests
Kinetic Energy Distribution Validation
For systems sampling canonical (NVT) or isothermal-isobaric (NPT) ensembles, the kinetic energy distribution must follow the Maxwell-Boltzmann distribution predicted by statistical mechanics. The physical validation suite tests this fundamental requirement by comparing the observed distribution of kinetic energies with the theoretical expectation [81]. This validation is particularly important because incorrect kinetic energy distributions can indicate problems with thermostat implementation or inadequate equilibration, which would compromise all subsequent analysis.
Configurational Quantity Distribution Validation
Unlike kinetic energy, configurational quantities such as potential energy and volume generally lack known analytical distributions. However, the ratio of probability distributions between samples of the same ensemble at different state points (e.g., different temperatures or pressures) is known [81]. The validation tests exploit this relationship by comparing simulations at different state points to verify proper sampling of the configurational ensemble.
Ensemble Test Systems and Parameters
The ensemble validation uses the same Argon and water systems as the integrator tests, but with different simulation parameters designed to test various thermodynamic ensembles and coupling schemes:
Table: Ensemble Test Parameters and Systems
| System | Thermostat | Barostat | Integrator | Temperature | Pressure |
|---|---|---|---|---|---|
| Argon/Water | v-rescale (tau-t=0.1) |
None | md |
87K (Argon), 298.15K (Water) | Not applicable |
| Argon/Water | v-rescale (tau-t=0.1) |
parrinello-rahman |
md |
87K (Argon), 298.15K (Water) | 1.0 bar |
| Argon/Water | v-rescale (tau-t=0.1) |
None | md-vv |
87K (Argon), 298.15K (Water) | Not applicable |
| Argon/Water | nose-hoover (tau-t=1.0) |
mttk |
md-vv |
87K (Argon), 298.15K (Water) | 1.0 bar |
All thermostats are applied to the entire system (tc-grps = system), and simulations run for 1ns with a 2fs time step using the Verlet cut-off scheme [81]. Other settings are left at their default values to test the most commonly used configurations.
Experimental Protocol for Physical Validation
Building GROMACS with Physical Validation
To enable physical validation tests, GROMACS must be compiled with the appropriate CMake flag:
After successful compilation, the physical validation tests become available through the specific make targets described in Section 2.2.
Workflow for Running Validation Tests
The complete workflow for physical validation involves preparation, execution, and analysis phases, which can be performed separately or combined based on available resources and workflow requirements:
Customizing and Extending Validation Tests
The physical validation framework is designed to be extensible. New tests can be added by creating appropriate system definitions in the systems/ directory and adding test specifications to the systems.json (single precision) or systems_d.json (double precision) files [81]. Each test definition includes:
- A unique
nameattribute - A
dirattribute pointing to the system directory - A
testattribute listing validations to perform - Optional
grompp_argsandmdrun_argsfor specific grompp or mdrun arguments
This flexibility allows researchers to add custom validation tests tailored to their specific molecular systems or simulation methodologies.
The Scientist's Toolkit: Essential Research Reagents
Table: Key Research Reagent Solutions for GROMACS Physical Validation
| Reagent/Resource | Function in Validation | Implementation Details |
|---|---|---|
| Argon Test System | Simple Lennard-Jones fluid for validating basic integration and ensemble sampling | 1000 atoms, simple cubic lattice initial configuration |
| Water Test System | More complex system with constraints and electrostatic interactions | 900 water molecules, SPC/E or TIP3P water model |
| Velocity Verlet Integrator | Testing symplectic integration properties | integrator = md-vv in mdp options [56] |
| Leap-frog Integrator | Standard GROMACS integrator for comparison | integrator = md in mdp options [56] |
| v-rescale Thermostat | Temperature coupling for ensemble validation | tcoupl = v-rescale, tau-t = 0.1 [81] |
| Parrinello-Rahman Barostat | Pressure coupling for NPT ensemble tests | pcoupl = parrinello-rahman, tau-p = 2.0 [81] |
| LINCS Constraint Algorithm | Testing constraint implementation in integrators | constraints = h-bonds, lincs-order = 6 [81] |
| SETTLE Constraint Algorithm | Rigid water constraint implementation | Applied automatically to water molecules with constraints |
Interpretation of Results and Troubleshooting
Analyzing Test Outputs
Successful physical validation tests should demonstrate:
- Quadratic dependence of energy conservation on time step for symplectic integrators
- Close agreement between observed kinetic energy distributions and Maxwell-Boltzmann predictions
- Consistent probability ratios for configurational quantities at different state points
Deviations from these expectations may indicate issues with:
- Numerical precision: Particularly for integrator convergence tests, which are highly sensitive to numerical imprecision [81]
- Thermostat/barostat implementation: Incorrect ensemble distributions may signal problems with temperature or pressure coupling algorithms
- Constraint handling: Particularly for water systems with multiple constraint algorithms
- Potential function discontinuities: Which can破坏 the symplectic property of integrators
Integration with Research Workflow
For researchers working on thesis projects or drug development, physical validation tests should be incorporated at key stages:
- After installation or updates of GROMACS to verify correct build and configuration
- When implementing new simulation methodologies to ensure physical correctness
- Periodically during long-term projects to detect potential issues from system updates or changes
The tests provide particularly valuable verification when preparing large-scale production simulations, where computational investment is substantial and correctness of results is critical.
The physical validation framework in GROMACS 2025.0 provides essential tools for verifying the physical correctness of molecular dynamics simulations. By systematically testing integrator convergence and ensemble distributions, researchers can ensure their simulation methodologies produce physically meaningful results before committing to computationally expensive production runs. The comprehensive test suite covering multiple integrators, thermostats, barostats, and constraint algorithms makes it particularly valuable for complex biomolecular systems relevant to drug development. For thesis research, these validation tests provide crucial methodological rigor, demonstrating that simulation protocols are scientifically sound and numerically robust.
Benchmarking against experimental data and other MD packages
Within the broader context of establishing a robust molecular dynamics (MD) simulation workflow in GROMACS, benchmarking serves as the critical final step for validating both the methodological setup and the resulting data. For researchers and drug development professionals, this process provides essential confidence in simulation results by ensuring they are both computationally efficient and scientifically valid. Effective benchmarking encompasses two primary approaches: comparing results against experimental reference data to verify biological relevance, and performing cross-package performance comparisons to optimize computational resource allocation. This protocol details comprehensive methodologies for both types of benchmarking, enabling researchers to demonstrate that their GROMACS simulations produce physically meaningful results while making efficient use of available hardware resources.
Benchmarking Against Experimental Data
Theoretical Framework for Experimental Comparison
Validating MD simulations against experimental data transforms your computational work from a purely theoretical exercise into a scientifically grounded investigation. The core principle involves comparing simulation-derived properties with empirically measured values, creating a cycle of validation and refinement. When discrepancies arise, they do not necessarily invalidate a simulation; instead, they provide crucial opportunities to refine force field parameters, adjust simulation conditions, or identify limitations in either the experimental data or computational methodology. This iterative process significantly enhances the predictive power of subsequent simulation studies, particularly in drug development contexts where accurate molecular behavior prediction is paramount.
Practical Protocol with GROmaρs Toolset
For quantitative comparison between simulation trajectories and experimental density maps, the GROMACS-based GROmaρs toolset provides specialized functionality. This method is particularly valuable for multimolecule systems where standard metrics like RMSD become difficult to compute and interpret [82].
Procedure:
- Generate Density Maps: Compute time-averaged density maps from your MD trajectory using GROmaρs' fast multi-Gaussian spreading algorithm, which projects atomic densities onto a three-dimensional grid.
- Calculate Difference Maps: Use GROmaρs to generate difference maps that visually highlight regions where your simulation densities diverge from experimental reference maps.
- Quantify Correlation: Compute local and time-resolved global correlation coefficients to quantitatively assess how closely your biomolecular system resembles experimental data.
- Estimate Free Energies: Utilize GROmaρs' functionality to calculate absolute and relative spatial free-energy estimates, providing an energetic perspective on atomistic localization [82].
Application Example: This approach proved particularly effective for studying the localization of lipid and water molecules in aquaporin systems, examining cholesterol binding to GPCRs, and identifying permeation pathways through antimicrobial channels [82].
Performance Benchmarking Against Other MD Packages
Cross-Package Performance Analysis
Understanding GROMACS' performance relative to other MD software is essential for making informed decisions about resource allocation, especially when working with limited computational cycles or tight project timelines. Performance can vary significantly based on hardware configuration, system size, and specific simulation parameters.
Table 1: Relative Performance Comparison of MD Software Packages on Comparable Hardware
| MD Package | Hardware Configuration | System Size | Relative Performance | Primary Use Case |
|---|---|---|---|---|
| GROMACS | CPU: Multiple coresGPU: Single or Multiple | Small to Large | Benchmark(One of the fastest MD codes available [3]) | High-throughput production simulations |
| AMBER | GPU: Single (pmemd.cuda) | Small to Medium | Good on single GPUDoes not scale beyond 1 GPU for single simulations [83] | Routine microsecond-scale simulations [84] |
| NAMD | GPU: Multiple | Medium to Large | Good strong scaling on multiple GPUs [83] | Large biomolecular complexes |
Hardware-Specific Performance Profiling
Recent benchmarking studies reveal that GROMACS performance exhibits distinct scaling behaviors across different GPU architectures and system sizes. Smaller systems (e.g., 20,000-80,000 atoms) typically show strong frequency sensitivity, meaning they benefit significantly from higher GPU clock speeds. In contrast, larger systems (e.g., 600,000-1,000,000 atoms) often saturate quickly with increasing frequency, becoming increasingly constrained by memory bandwidth rather than raw compute power [84].
Under power capping constraints, high-end GPUs like the NVIDIA A100 can maintain near-maximum performance even under significantly reduced power budgets, offering potential for substantial energy savings in large-scale deployments [84].
Computational Performance Optimization
Hardware Selection Guidelines
Selecting appropriate hardware requires balancing system size, simulation throughput needs, and budget constraints. The following recommendations are based on recent benchmarking studies:
Table 2: Hardware Recommendations for GROMACS Workloads
| Component | Recommendation | Rationale |
|---|---|---|
| CPU | Mid-tier workstation CPU with higher clock speeds (e.g., AMD Threadripper PRO 5995WX) [85] | Prioritize clock speed over extreme core counts for most biomolecular systems. |
| GPU (General MD) | NVIDIA RTX 4090 [85] | Best balance of price and performance with substantial processing power. |
| GPU (Memory-Intensive) | NVIDIA RTX 6000 Ada [85] | 48 GB VRAM handles the largest systems; superior for complex setups. |
| Multi-GPU Setup | 2-8x NVIDIA A100 or RTX 4090 [85] | Dramatically enhances throughput for large systems or multiple simultaneous runs. |
GROMACS-Specific Performance Tuning
Algorithmic Optimizations:
- Pair List Generation: GROMACS employs an O(N) neighbor search algorithm that uses spatial clustering of particles (typically 4 or 8) to efficiently generate pair lists, significantly accelerating non-bonded force calculations [7].
- Dynamic List Pruning: Enable dynamic pair list pruning to reduce computational overhead by removing atom pairs that remain outside the interaction cut-off, which can be overlapped with integration on the CPU for minimal overhead [7].
- Verlet Buffer Scheme: Utilize the buffered Verlet cut-off scheme with automatic buffer size determination to balance between neighbor search frequency and list size [7].
Performance Configuration Example:
This configuration offloads non-bonded calculations, Particle Mesh Ewald electrostatics, and coordinate updates to the GPU while keeping bonded interactions on the CPU, typically providing optimal resource utilization [83].
Integrated Benchmarking Workflow
The diagram below illustrates the comprehensive benchmarking workflow that combines both experimental validation and performance analysis:
Research Reagent Solutions
Table 3: Essential Computational Tools for MD Benchmarking
| Tool Name | Type | Primary Function | Application in Benchmarking |
|---|---|---|---|
| GROmaρs [82] | Analysis Toolset | Compute and compare density maps | Quantitative comparison of simulation data with experimental density maps |
| GROMACS Performance Counters [86] | Built-in Profiling | Time individual simulation components | Identify performance bottlenecks in force calculations and PME |
| VMD [87] | Visualization | Trajectory visualization and analysis | Visual inspection of molecular motion and trajectory quality |
| Grace [87] | Plotting | 2D data visualization | Plotting quantitative metrics from GROMACS analysis utilities |
| AMBER [84] [83] | MD Software | Comparative MD simulations | Cross-package performance benchmarking |
| NAMD [83] | MD Software | Comparative MD simulations | Cross-package performance benchmarking |
Within the framework of molecular dynamics (MD) simulations using GROMACS, the analysis of key output parameters is not merely a post-processing step but a critical validation checkpoint. For researchers and drug development professionals, ensuring the physical realism and stability of a simulation is paramount for producing reliable, publishable results. This document provides a detailed application note on analyzing four cornerstone outputs: energies, temperature, pressure, and root-mean-square deviation (RMSD). These metrics collectively provide a comprehensive picture of the thermodynamic stability, structural integrity, and overall quality of an MD simulation, forming the basis for any subsequent scientific inquiry [7] [28].
The Scientist's Toolkit: Essential Research Reagents
Before delving into protocols, it is essential to familiarize oneself with the key "research reagents" – the primary file types and software used in GROMACS analysis. The table below summarizes these core components.
Table 1: Essential Research Reagents for GROMACS Analysis
| Item Name | File Extension(s) | Brief Function / Description |
|---|---|---|
| Run Input File | .tpr |
A portable binary file containing all simulation parameters, system topology, and starting structure. It is the primary input for gmx mdrun and many analysis tools [23]. |
| Trajectory File | .xtc, .trr, .tng |
Contains the time-series evolution of atomic coordinates (.xtc, .tng) and optionally velocities and forces (.trr). The .xtc format is compact and ideal for analysis [23]. |
| Energy File | .edr |
A binary file storing time-series data for energetic, temperature, pressure, and density data generated during the simulation [88]. |
| Structure File | .gro, .pdb |
Contains atomic coordinates. The .gro format is GROMACS-native and can hold velocities, while .pdb is a standard and is useful for visualization [23]. |
| Index File | .ndx |
Defines custom groups of atoms for specific analysis, such as selecting a protein backbone for RMSD calculations [23]. |
| GROMACS Analysis Tools | gmx energy, gmx rms, gmx trjconv |
Suite of command-line programs for extracting and processing simulation data [88] [89]. |
| Visualization Software | VMD, Chimera, PyMOL | Programs for visually inspecting trajectories and structures. VMD and Chimera natively support GROMACS trajectory formats [89]. |
Experimental Protocols for Key Output Analysis
Energy Analysis Usinggmx energy
The total energy, potential energy, and kinetic energy are fundamental indicators of simulation stability. In the NVE ensemble, the total energy should be conserved, while in NVT and NPT ensembles, it should fluctuate stably around a mean value. Significant energy drift often signals problems with the simulation setup or parameters [28].
Detailed Protocol:
- Extract Energy Terms: After your simulation, use the
gmx energycommand to interactively select and plot energy terms from the.edrfile. - Select Terms: When prompted, select relevant energy terms for your analysis. Key terms include:
Potential: The system's potential energy.Kinetic-En: The system's kinetic energy.Total-Energy: The sum of potential and kinetic energy.Temperature: For cross-validation.Pressure: For cross-validation.
- Analyze Output: The command generates an
energy.xvgfile. Use plotting software like Grace, gnuplot, or Python's Matplotlib to visualize the data [89]. Thegmx energyprogram itself also prints precise statistics including the average, RMSD, and energy drift calculated via a least-squares fit [88]. - Calculate Fluctuation-Dependent Properties (Optional): The
-fluct_propsflag enablesgmx energyto compute thermodynamic properties from energy fluctuations. You must also specify the number of molecules with-nmol. When prompted, select the required energy terms for the desired property (see Table 2).
Table 2: Energy Terms for Fluctuation-Dependent Properties
| Property | Required Energy Terms |
|---|---|
| Heat capacity Cp (NPT) | Enthalpy, Temperature |
| Heat capacity Cv (NVT) | Total Energy, Temperature |
| Thermal expansion coeff. (NPT) | Enthalpy, Volume, Temperature |
| Isothermal compressibility | Volume, Temperature |
| Adiabatic bulk modulus | Volume, Temperature |
Temperature and Pressure Coupling Validation
Temperature and pressure are controlled by coupling to thermostats and barostats. The goal of a thermostat is not to maintain a perfectly constant temperature but to ensure the average is correct and the fluctuations are of the expected magnitude for the system size [28]. Similarly, instantaneous pressure can fluctuate by hundreds of bar in small systems; only the average value is meaningful [28].
Detailed Protocol:
- Extract Data: Use
gmx energyto extract theTemperatureandPressureterms from your.edrfile. - Verify Averages: Ensure the average temperature and pressure are close to the target values specified in your
.mdpfile. - Check Fluctuations: Confirm that fluctuations are reasonable. For a system of ~10,000 atoms, temperature fluctuations of 5-10 K and pressure fluctuations of several tens to hundreds of bar are typical. Fluctuations decrease with the square root of the system size [28].
- Thermostat Best Practices:
- Apply thermostats to sufficiently large groups (e.g.,
ProteinandNon-Protein) rather than to every small component to avoid artifacts [28]. - Use modern thermostats that sample the correct ensemble (e.g., Nosé-Hoover) for production simulations.
- Apply thermostats to sufficiently large groups (e.g.,
Root-Mean-Square Deviation (RMSD) for Conformational Stability
RMSD measures the conformational drift of a molecular structure (e.g., a protein) relative to a reference structure, typically the starting crystal structure or an energy-minimized initial frame. It is a key metric for assessing if a protein has reached equilibrium and remains stable, or if it is undergoing large conformational changes.
Detailed Protocol:
- Make Molecules Whole (Critical First Step): Before analysis, ensure molecules are not split across periodic boundaries, which would artifactually inflate RMSD.
- Center the System (Optional but Recommended): Center the protein in the box to remove global translation.
- Calculate RMSD: Use the
gmx rmstool to compute the RMSD. You will be prompted to select groups for fitting (e.g.,Backbone) and calculation (e.g.,BackboneorC-Alpha). - Interpret Results: A stable, equilibrated protein will typically show a plateau in RMSD after an initial rise. A continuous, significant rise may indicate the protein is unfolding or that the simulation is not yet equilibrated.
Integrated Analysis Workflow
A robust analysis strategy involves a systematic approach to evaluating these interdependent outputs. The workflow below outlines the logical sequence for diagnosing simulation health.
Troubleshooting Common Issues
- Large Energy Drift: This can be caused by an insufficient pair-list buffer, incorrect treatment of long-range electrostatics, constraints, or a too-large integration timestep [7] [28]. Ensure the pair-list buffer is sized appropriately, often automatically by setting a tolerance in the
.mdpfile [7]. - Incorrect Average Temperature/Pressure: Verify the settings in your
.mdpfile (tc-grps,pcoupl,ref_t,ref_p). Ensure the system is properly equilibrated before collecting production data. - Unphysical RMSD or Broken Molecules in Visualization: This is almost always a periodic boundary condition (PBC) artifact, not a real simulation error [28]. Always use
gmx trjconvwith-pbc clusteror-pbc wholebefore visualization or analysis to make molecules whole again [89] [28].
Molecular dynamics (MD) simulation is a cornerstone computational method for describing the dynamical properties of proteins and other macromolecules, providing structural interpretations of experimental data crucial for biophysical research and drug development [90]. The continued utility and accuracy of MD simulations, however, depend significantly on two factors: sufficient sampling of conformational space and the precision of the molecular mechanics force fields used to generate these conformations [90]. Force fields, being empirical interaction potential functions and their associated parameters, form the physical basis of MD simulations. Their accuracy is paramount, as employing non-accurate parameters can lead to erroneous conformational preferences or artifacts, potentially derailing subsequent experimental design procedures [91].
Selecting an appropriate force field is not a trivial task, given the multitude of available options—such as AMBER, CHARMM, GROMOS, OPLS-AA, and GAFF—each with different parameterization philosophies and performance characteristics across various molecular systems [91] [90] [92]. This application note provides a structured, comparative analysis of simulation outcomes for different force fields within the GROMACS simulation environment. It offers detailed protocols and decision-making frameworks to assist researchers in selecting and validating force fields for their specific studies, thereby enhancing the reliability and predictive power of their computational workflows.
Critical considerations for force field selection
The choice of force field is highly system-dependent. A force field that excels for one type of molecule or property may perform poorly for another. Research indicates that force fields can be broadly categorized into different performance classes based on their application.
- Biomolecular Folding and Structure: For proteins, studies have shown that force fields like CHARMM22*, CHARMM27, Amber ff99SB-ILDN, and Amber ff99SB*-ILDN provide a reasonably good agreement with experimental NMR data, including residual dipolar couplings and scalar couplings [90]. In contrast, Amber ff03 and ff03* show an intermediate level of agreement, while OPLS and the older CHARMM22 may exhibit substantial conformational drift in longer simulations [90].
- Non-Natural Peptidomimetics: For β-peptides, a recent comparative study found that a CHARMM36m-based extension, with torsional parameters derived from quantum-chemical matching, performed best overall, accurately reproducing experimental structures in all monomeric simulations and correctly describing oligomeric examples [91]. The Amber and GROMOS force fields could only treat a subset of the tested peptides without further parametrization [91].
- Liquid Membranes and Small Molecules: For systems like diisopropyl ether (DIPE), a comparative study concluded that CHARMM36 and COMPASS provide quite accurate density and viscosity values, whereas GAFF and OPLS-AA/CM1A overestimated these properties [92]. The study recommended CHARMM36 for modeling ether-based liquid membranes due to its superior performance in reproducing thermodynamic and transport properties [92].
A noteworthy observation is that force fields reparameterized to improve the balance between helical and coil structures can be difficult to distinguish from their predecessors in simulations of stable, folded proteins, even on multi-microsecond timescales [90]. This implies that such systems may provide relatively little information for further refining torsion parameters, highlighting the need for validation across diverse system types.
Quantitative performance comparison of force fields
The following tables summarize the performance of various force fields across different molecular systems and properties, based on recent comparative studies.
Table 1: Performance of force fields for proteins and β-peptides
| Force Field | System Type | Performance Summary | Key Experimental Metrics |
|---|---|---|---|
| CHARMM22* | Proteins (Ubq, GB3) | Good agreement with NMR data [90]. | Residual dipolar couplings, scalar couplings, order parameters. |
| Amber ff99SB-ILDN | Proteins (Ubq, GB3) | Good agreement with NMR data; similar ensemble to ff99SB*-ILDN for stable proteins [90]. | Residual dipolar couplings, scalar couplings, order parameters. |
| Amber ff03/ff03* | Proteins (Ubq, GB3) | Intermediate agreement with NMR data; distinct structural ensemble from ff99SB-derived fields [90]. | Residual dipolar couplings, scalar couplings, order parameters. |
| CHARMM36m (β-peptide extension) | β-peptides (7 sequences) | Best overall performance; accurate experimental structures in all monomers, correct oligomer description [91]. | Reproduction of NMR-derived secondary structures (314 helix, hairpins) and oligomer stability. |
| Amber (β-peptide extension) | β-peptides (7 sequences) | Reproduced experimental structure for 4/7 peptides; held pre-formed associates but no spontaneous oligomer formation [91]. | Reproduction of NMR-derived secondary structures. |
| GROMOS 54A7/54A8 | β-peptides (7 sequences) | Lowest performance; could only treat 4/7 peptides without parametrization [91]. | Reproduction of NMR-derived secondary structures. |
Table 2: Performance of force fields for liquid membranes (Diisopropyl Ether, DIPE)
| Force Field | Density Prediction | Shear Viscosity Prediction | Overall Suitability for Liquid Membranes |
|---|---|---|---|
| GAFF | Overestimation by ~3% [92]. | Overestimation by ~60% [92]. | Not recommended. |
| OPLS-AA/CM1A | Overestimation by ~5% [92]. | Overestimation by ~130% [92]. | Not recommended. |
| COMPASS | Quite accurate [92]. | Quite accurate [92]. | Accurate for density and viscosity. |
| CHARMM36 | Quite accurate [92]. | Quite accurate [92]. | Most suitable; also accurate for interfacial tension and partition coefficients [92]. |
Detailed protocol for force field comparison in GROMACS
This protocol outlines the steps for setting up and running a comparative MD simulation to evaluate force fields for a protein-ligand system, using GROMACS [2].
System setup and topology generation
Step 1: Obtain and Prepare Initial Structure
- Download a PDB file for your molecule of interest (e.g., from the RCSB PDB).
- Remove any unwanted atoms, such as crystallographic water molecules and heteroatoms (e.g., using
grep -v HETATM). This ensures automatic topology construction will only involve recognized molecular components [2].
Step 2: Generate Topologies and Structure Files
- Use the
pdb2gmxtool for each force field you wish to compare (e.g., CHARMM36, Amber99SB-ILDN, OPLS-AA). - This tool generates three key files:
- A topology file (
.top) describing the molecule's atom types, bonds, and interaction parameters. - A structure file (
.gro) with the centered molecular coordinates. - A position restraint file (
.itp) for use during equilibration.
- A topology file (
- Example command:
- Use the
Step 3: Define the Simulation Box
- Use the
editconftool to place the molecule in a defined simulation box. A rhombic dodecahedron is often the most efficient shape, as it minimizes the number of solvent molecules required [2]. - Example command:
- Use the
Step 4: Solvate the System
- Use the
solvatetool to fill the box with water molecules (e.g., TIP3P, SPC/E). - Example command:
- Use the
Step 5: Add Ions to Neutralize
- Use the
gromppandgeniontools to add ions (e.g., Na⁺, Cl⁻) to neutralize the system's net charge and achieve a desired physiological salt concentration. - Example commands:
- Use the
Energy minimization and equilibration
Step 6: Energy Minimization
- Perform energy minimization to remove any steric clashes or unusual geometry that would artificially raise the system's energy. The steepest descent algorithm is a common and robust choice for this step [2].
- This is typically controlled by a parameter file (
em.mdp). Key parameters include:integrator = steepnsteps = 50000emtol = 1000.0
Step 7: System Equilibration
- Equilibration is performed in two phases to gradually relax the system to the target temperature and pressure.
- NVT Equilibration: This phase stabilizes the system temperature (e.g., 300 K) using a thermostat like the velocity rescaling algorithm. Position restraints are applied to the protein heavy atoms to allow the solvent to relax around a fixed solute [2].
- NPT Equilibration: This phase stabilizes the system pressure (e.g., 1 bar) using a barostat like the Parrinello-Rahman algorithm. Position restraints are typically still applied.
Production simulation and analysis
Step 8: Production MD Simulation
- Run a production simulation without position restraints. The length of this simulation will depend on the system size and the processes being investigated (nanoseconds to microseconds).
- Ensure the parameter file (
md.mdp) uses an integrator likemd(leap-frog) and defines appropriate cut-off schemes and long-range electrostatics (e.g., Particle-Mesh Ewald).
Step 9: Trajectory Analysis
- Analyze the resulting trajectories to compare force field performance against experimental or benchmark data. Key analyses include:
- Root Mean Square Deviation (RMSD): Measures structural stability.
- Root Mean Square Fluctuation (RMSF): Quantifies residue flexibility.
- Radius of Gyration: Assesses compactness.
- Principal Component Analysis (PCA): Identifies and compares large-scale conformational motions sampled by different force fields [90].
- Comparison with NMR data: Calculate NMR observables like residual dipolar couplings (RDCs) and J-couplings for direct validation [90].
- Analyze the resulting trajectories to compare force field performance against experimental or benchmark data. Key analyses include:
The following workflow diagram illustrates the complete protocol from system setup to analysis.
The scientist's toolkit: Essential research reagents and materials
Table 3: Key software, force fields, and resources for MD simulations in GROMACS
| Item Name | Type/Classification | Primary Function and Application Notes |
|---|---|---|
| GROMACS | MD Simulation Engine | High-performance, open-source software for MD simulation; known for its exceptional speed and rigorous algorithms [91] [2]. |
| CHARMM36m | Force Field | All-atom force field for proteins, nucleic acids, and lipids; recently extended for β-peptides with high accuracy [91]. |
| Amber ff99SB-ILDN | Force Field | All-atom force field for proteins; provides good agreement with NMR data for folded proteins [90]. |
| OPLS-AA | Force Field | All-atom force field; applicable to proteins and organic liquids; performance is system-dependent [90] [92]. |
| pdb2gmx | GROMACS Tool | Generates molecular topologies and coordinates from a PDB file for a selected force field [2]. |
| PyMOL | Molecular Graphics | Open-source molecular visualization system used for model building and trajectory visualization [91]. |
| SPC/E Water Model | Solvent Model | A rigid, three-site water model commonly used with various force fields for solvating simulation boxes [2]. |
Conclusion
Mastering GROMACS setup is a multi-stage process that moves from understanding core theoretical concepts, through a rigorous methodological workflow, to performance optimization and, crucially, physical validation. The latest advancements in GROMACS, particularly in GPU acceleration and automated validation suites, are dramatically reducing computation times and increasing the reliability of simulations for critical applications like drug discovery. As the field progresses, the integration of MD with AI-predicted structures and automated workflows will further streamline the path from simulation to scientific insight, solidifying MD's role as a cornerstone of computational biochemistry and structure-based drug design.
References
- 1. Introduction - GROMACS 2025.4 documentation [https://manual.gromacs.org/documentation/current/reference-manual/introduction.html]
- 2. Running molecular dynamics simulations using GROMACS [https://training.galaxyproject.org/training-material/topics/computational-chemistry/tutorials/md-simulation-gromacs/tutorial.html]
- 3. GROMACS Tutorials [http://www.mdtutorials.com/gmx/]
- 4. Introduction to Molecular Dynamics [https://tutorials.gromacs.org/md-intro-tutorial.html]
- 5. GROMACS tutorial | Biomolecular simulations [https://www.ebi.ac.uk/training/materials/biomolecular-simulations-materials/molecular-dynamics-simulations/gromacs-tutorial/]
- 6. Tabulated interaction functions [https://manual.gromacs.org/current/reference-manual/special/tabulated-interaction-functions.html]
- 7. Molecular Dynamics - GROMACS 2025.4 documentation [https://manual.gromacs.org/documentation/current/reference-manual/algorithms/molecular-dynamics.html]
- 8. GROMACS 2025.0 documentation [https://manual.gromacs.org/documentation/2025.0/index.html]
- 9. Welcome to the GROMACS documentation! — GROMACS ... [https://manual.gromacs.org/]
- 10. User guide - GROMACS 2025.0 documentation [https://manual.gromacs.org/2025.0/user-guide/index.html]
- 11. Welcome to the GROMACS tutorials! — GROMACS tutorials ... [https://tutorials.gromacs.org/]
- 12. GROMACS forums - GROMACS community forums [https://gromacs.bioexcel.eu/]
- 13. Welcome to GROMACS — GROMACS webpage https://www ... [https://www.gromacs.org/]
- 14. Accelerated Molecular Dynamics (aMD) in Gromacs? [https://gromacs.bioexcel.eu/t/accelerated-molecular-dynamics-amd-in-gromacs/9562]
- 15. Protocol for Molecular Dynamics Simulations of Proteins [https://en.bio-protocol.org/en/bpdetail?id=2051&type=0]
- 16. Force field - GROMACS 2025.3 documentation [https://manual.gromacs.org/documentation/2025.3/reference-manual/functions/force-field.html]
- 17. Computational BioPhysics Tutorials - 2025/2026 [https://cbp-unitn.gitlab.io/QCB/tutorial2_gromacs.html]
- 18. Force fields in GROMACS [https://manual.gromacs.org/2025.0/user-guide/force-fields.html]
- 19. System preparation - GROMACS 2025.1 documentation [https://manual.gromacs.org/2025.1/user-guide/system-preparation.html]
- 20. Periodic boundary conditions [https://manual.gromacs.org/current/reference-manual/algorithms/periodic-boundary-conditions.html]
- 21. Molecular dynamics parameters (.mdp options) [https://manual.gromacs.org/current/user-guide/mdp-options.html]
- 22. Molecular dynamics parameters (.mdp options) [https://manual.gromacs.org/2018.6/user-guide/mdp-options.html]
- 23. Getting started - GROMACS 2025-rc documentation [https://manual.gromacs.org/2025-rc/user-guide/getting-started.html]
- 24. Preparing a GROMACS system - GitHub Pages [https://epcced.github.io/20220421_GROMACS_introduction/02-preparing-coordinate-file/index.html]
- 25. gmx pdb2gmx - GROMACS 2025.4 documentation [https://manual.gromacs.org/current/onlinehelp/gmx-pdb2gmx.html]
- 26. [MD-002] Preparation of Topology and Coordinate Files ... [https://www.gchenlab.com/preparation-of-files-for-simulations-in-gromacs/]
- 27. Issue in convertion of pdb to gro file in the case of ligand [https://gromacs.bioexcel.eu/t/issue-in-convertion-of-pdb-to-gro-file-in-the-case-of-ligand/6552]
- 28. Terminology - GROMACS 2025.4 documentation [https://manual.gromacs.org/documentation/current/user-guide/terminology.html]
- 29. gmx solvate - GROMACS 2025.4 documentation [https://manual.gromacs.org/current/onlinehelp/gmx-solvate.html]
- 30. Molecular Dynamics Simulations and Their Novel ... [https://pubmed.ncbi.nlm.nih.gov/41023346/]
- 31. Force field organization - GROMACS 2025.4 documentation [https://manual.gromacs.org/current/reference-manual/topologies/force-field-organization.html]
- 32. System preparation - GROMACS 2025.4 documentation [https://manual.gromacs.org/current/user-guide/system-preparation.html]
- 33. Parameter file generation - GROMACS forums [https://gromacs.bioexcel.eu/t/parameter-file-generation/6126]
- 34. File formats - GROMACS 2025.4 documentation [https://manual.gromacs.org/documentation/current/reference-manual/topologies/topology-file-formats.html]
- 35. Parameter files - GROMACS 2025.3 documentation [https://manual.gromacs.org/documentation/2025.3/reference-manual/topologies/parameter-files.html]
- 36. User contributions [https://www.gromacs.org/user_contributions.html]
- 37. GROMACS Wizard - Step 2: Energy Minimization [https://documentation.samson-connect.net/tutorials/gromacs-wizard/energy-minimization/]
- 38. Introduction - GROMACS 2025.2 documentation [https://manual.gromacs.org/documentation/2025.2/reference-manual/introduction.html]
- 39. Energy Minimization - GROMACS 2025.3 documentation [https://manual.gromacs.org/documentation/2025.3/reference-manual/algorithms/energy-minimization.html]
- 40. NPT Equilibration [http://www.mdtutorials.com/gmx/lysozyme/07_equil2.html]
- 41. A Quick Guide to NVT Equilibration in GROMACS Wizard [https://blog.samson-connect.net/avoiding-simulation-instability-a-quick-guide-to-nvt-equilibration-in-gromacs-wizard]
- 42. Terminology — GROMACS 2019-beta1 documentation [https://manual.gromacs.org/documentation/2019-beta1/user-guide/terminology.html]
- 43. GROMACS Wizard - Step 3: NVT Equilibration [https://documentation.samson-connect.net/tutorials/gromacs-wizard/nvt-equilibration/]
- 44. Force fields in GROMACS [https://manual.gromacs.org/current/user-guide/force-fields.html]
- 45. gmx mdrun - GROMACS 2025.4 documentation [https://manual.gromacs.org/current/onlinehelp/gmx-mdrun.html]
- 46. Managing long simulations [https://manual.gromacs.org/current/user-guide/managing-simulations.html]
- 47. Getting good performance from mdrun [https://manual.gromacs.org/current/user-guide/mdrun-performance.html]
- 48. How can I get reproducible production mdrun results when ... [https://gromacs.bioexcel.eu/t/how-can-i-get-reproducible-production-mdrun-results-when-running-multiple-times-with-same-inputs/1871]
- 49. Getting Started GROMACS : Tutorial | HyperAI Lysozyme in Water [https://hyper.ai/en/tutorials/36521]
- 50. Lysozyme in Water [http://www.mdtutorials.com/gmx/lysozyme/]
- 51. Lysozyme in Water - GROMACS Tutorial [http://www.mdtutorials.com/gmx/lysozyme/01_pdb2gmx.html]
- 52. with aiida- Lysozyme - aiida- in ... Water gromacs gromacs [https://aiida-gromacs.readthedocs.io/en/latest/tutorials/lysozyme.html]
- 53. Create a GROMACS Project - DiPhyx Docs [https://diphyx.com/docs/gromacs-tutorial/]
- 54. Optimizing CPU/GPU efficiency and performance in ... [https://gromacs.bioexcel.eu/t/optimizing-cpu-gpu-efficiency-and-performance-in-gromacs-simulations/11509]
- 55. Low Performance due to low utilisation of GPU [https://gromacs.bioexcel.eu/t/low-performance-due-to-low-utilisation-of-gpu/6414]
- 56. Molecular dynamics parameters (.mdp options) [https://manual.gromacs.org/2025.0-beta/user-guide/mdp-options.html]
- 57. Thermostats in Molecular Dynamics [https://www.compchems.com/thermostats-in-molecular-dynamics/]
- 58. The modular simulator [https://manual.gromacs.org/2025.0/doxygen/html-full/page_modularsimulator.xhtml]
- 59. Long Range Electrostatics [https://manual.gromacs.org/nightly/reference-manual/functions/long-range-electrostatics.html]
- 60. Constraint algorithms - GROMACS 2025.4 documentation [https://manual.gromacs.org/documentation/current/reference-manual/algorithms/constraint-algorithms.html]
- 61. Non-bonded cut-off schemes [https://manual.gromacs.org/5.1.1/user-guide/cutoff-schemes.html]
- 62. Performant PME simulations — GROMACS GPU Performance [https://enccs.github.io/gromacs-gpu-performance/using-pme/]
- 63. Gas-phase MD simulations, switch off PME and Coulomb ... [https://gromacs.bioexcel.eu/t/gas-phase-md-simulations-switch-off-pme-and-coulomb-lennard-jones-cut-offs-set-to-infinity/4516]
- 64. A Benchmark of Electrostatic Method Performance in ... [https://pmc.ncbi.nlm.nih.gov/articles/PMC8208087/]
- 65. Common errors when using GROMACS [https://manual.gromacs.org/current/user-guide/run-time-errors.html]
- 66. Problem with adding ions - GROMACS forums [https://gromacs.bioexcel.eu/t/problem-with-adding-ions/12445]
- 67. Answers to frequently asked questions (FAQs) [https://manual.gromacs.org/2025.0/user-guide/faq.html]
- 68. Issue running GROMACS Full MD Setup - MDWeb - BioExcel [https://ask.bioexcel.eu/t/issue-running-gromacs-full-md-setup/1389]
- 69. Understanding and Resolving Out-of-Memory Errors in ... [https://blog.bioinfoquant.com/understanding-and-resolving-out-of-memory-errors-in-gromacs]
- 70. Known issues affecting users of GROMACS [https://manual.gromacs.org/current/user-guide/known-issues.html]
- 71. Boosting Free-Energy Perturbation Calculations with GPU ... [https://pmc.ncbi.nlm.nih.gov/articles/PMC7686227/]
- 72. Calculating free energy [https://tutorials.gromacs.org/docs/free-energy-of-solvation.html]
- 73. Acceleration of the GROMACS Free-Energy Perturbation ... [https://pmc.ncbi.nlm.nih.gov/articles/PMC12163693/]
- 74. Free energy calculations - GROMACS 2025.1 documentation [https://manual.gromacs.org/2025.1/reference-manual/algorithms/free-energy-calculations.html]
- 75. Simulations with free energy calculations on GPU is several ... [https://gromacs.bioexcel.eu/t/simulations-with-free-energy-calculations-on-gpu-is-several-time-slower-than-normal-simulations/3073]
- 76. 5. mdpow.fep – Calculate free energy of solvation [https://mdpow.readthedocs.io/en/latest/fep.html]
- 77. FEP in 2025: We're Going to Need a Bigger Drug Discovery ... [https://cresset-group.com/science/science-resources/fep-in-2025/]
- 78. Physical validation - GROMACS 2025-rc documentation [https://manual.gromacs.org/2025-rc/dev-manual/physical_validation.html]
- 79. Non-bonded interactions - GROMACS 2025.4 documentation [https://manual.gromacs.org/documentation/current/reference-manual/functions/nonbonded-interactions.html]
- 80. Periodic boundary conditions [https://manual.gromacs.org/2025.1/reference-manual/algorithms/periodic-boundary-conditions.html]
- 81. Physical validation - GROMACS 2025.0 documentation [https://manual.gromacs.org/2025.0/dev-manual/physical_validation.html]
- 82. A GROMACS-Based Toolset to Analyze Density Maps ... [https://www.sciencedirect.com/science/article/pii/S0006349518344485]
- 83. Running Molecular Dynamics on Alliance clusters with AMBER [https://computecanada.github.io/molmodsim-amber-md-lesson/26-MD_Software_Benchmarks/index.html]
- 84. How Power Capping and Frequency Shapes Performance ... [https://arxiv.org/html/2510.06902v1]
- 85. Best CPU, GPU, RAM for Molecular Dynamics in 2024 ... [https://bizon-tech.com/blog/best-cpu-gpu-ram-for-molecular-dynamics?srsltid=AfmBOookd53gCsRoS-Zt5wmUlMwh3mzBTouZNsQJvuOou00_yCq4hqvr]
- 86. SCALE Benchmark case study: GROMACS [https://scale-lang.com/posts/2025-05-19-GROMACS]
- 87. Visualization Software - GROMACS 2025.4 documentation [https://manual.gromacs.org/current/how-to/visualize.html]
- 88. gmx energy - GROMACS 2025.4 documentation [https://manual.gromacs.org/current/onlinehelp/gmx-energy.html]
- 89. Visualization Software - GROMACS 2025.0 documentation [https://manual.gromacs.org/2025.0/how-to/visualize.html]
- 90. Comparing Molecular Dynamics Force Fields in the ... [https://pmc.ncbi.nlm.nih.gov/articles/PMC4374674/]
- 91. Comparative Study of Molecular Mechanics Force Fields for β ... [https://pmc.ncbi.nlm.nih.gov/articles/PMC10302482/]
- 92. Force field comparison for molecular dynamics simulations ... [https://www.sciencedirect.com/science/article/abs/pii/S0167732224024061]