Decoding Phylogenomic Conflict: Incomplete Lineage Sorting vs. Introgression in Gene Tree Discordance
This article provides a comprehensive guide for researchers and biomedical professionals on distinguishing between incomplete lineage sorting (ILS) and introgression, two predominant causes of widespread gene tree discordance in phylogenomic...
Decoding Phylogenomic Conflict: Incomplete Lineage Sorting vs. Introgression in Gene Tree Discordance
Abstract
This article provides a comprehensive guide for researchers and biomedical professionals on distinguishing between incomplete lineage sorting (ILS) and introgression, two predominant causes of widespread gene tree discordance in phylogenomic studies. We explore the foundational biological mechanisms behind these processes, review state-of-the-art methodological frameworks for their identification, and present optimization strategies for troubleshooting phylogenetic analyses. Through empirical case studies across diverse taxa, we validate diagnostic approaches and compare their signals. Understanding these sources of conflict is critical for accurate evolutionary inference, with direct implications for tracing disease origins, understanding pathogen evolution, and identifying adaptive genetic variants in biomedical research.
Unraveling the Core Mechanisms: How ILS and Introgression Create Phylogenetic Discord
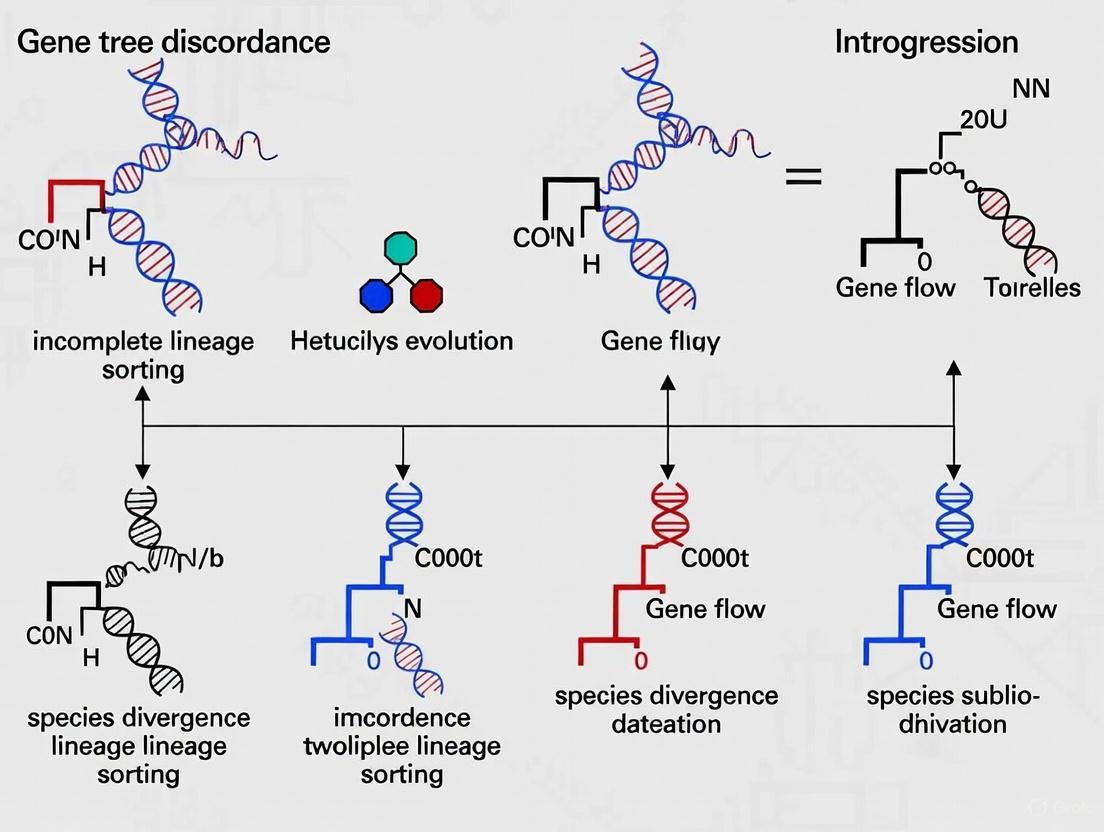
Incomplete lineage sorting (ILS) is a fundamental evolutionary phenomenon describing the persistence of ancestral genetic polymorphisms through multiple speciation events, leading to discordance between gene trees and species trees [1]. In the broader context of phylogenomic research, distinguishing the effects of ILS from those of introgression (hybridization) represents a significant challenge and a primary source of gene tree discordance [2] [3]. As phylogenomic datasets expand, researchers increasingly recognize that these processes are not mutually exclusive and can simultaneously shape genomic landscapes, complicating phylogenetic inference and our understanding of evolutionary relationships [4] [3].
This technical guide examines the core principles of ILS, its distinction from introgression, and the sophisticated methodological approaches required to disentangle their conflicting phylogenetic signals. Understanding these mechanisms is crucial for researchers and drug development professionals working with evolutionary models, as ILS can create patterns of trait variation that may be misinterpreted without proper phylogenetic context [5] [6].
Core Concepts and Definitions
Conceptual Foundation of ILS
Incomplete lineage sorting occurs when multiple alleles of a gene persist in an ancestral population and are randomly distributed across descendant species during sequential speciation events [1]. This phenomenon is particularly pronounced during rapid radiations, where short intervals between speciation events provide insufficient time for ancestral polymorphisms to coalesce (reach a common ancestor) within each emerging lineage [6]. The probability of ILS increases with larger effective population sizes and shorter divergence times between speciation events, as these factors increase the likelihood that genetic variation will be maintained across generations [1].
The central consequence of ILS is gene tree-species tree discordance, where the evolutionary history inferred from individual genes contradicts the species phylogeny [1]. This discordance arises not from error in phylogenetic reconstruction, but from the stochastic nature of allele inheritance during speciation. As ancestral populations split, the random segregation of polymorphic alleles can cause some genes to reflect evolutionary relationships that differ from the species tree [1].
Key Terminology
- Hemiplasy: The manifestation of a character state distribution that reflects a gene tree history that differs from the species tree history due to ILS [6].
- Coalescence: The process whereby genealogical lineages converge to a common ancestor when traced backward in time.
- Ancestral Polymorphism: The presence of multiple alleles at a locus in an ancestral population.
- Trans-species Polymorphism: The passage of polymorphic alleles from an ancestral species to its descendant species.
Mechanisms and Biological Context
A central challenge in phylogenomics lies in distinguishing discordance caused by ILS from that caused by introgression (hybridization). While both processes produce conflicting gene trees, they stem from fundamentally different biological mechanisms and leave distinct genomic signatures [2] [3].
Incomplete lineage sorting represents the failure of ancestral genetic polymorphisms to coalesce within the timeframe of speciation events. This process is stochastic and affects genomic regions based on their neutral coalescent properties rather than functional characteristics [1]. The discordance it generates reflects the random sorting of ancestral variation.
In contrast, introgression involves the transfer of genetic material between previously isolated lineages through hybridization and backcrossing. This process is often selective, with introgressed regions potentially conferring adaptive advantages [5]. Introgression produces discordance through the horizontal transfer of genetic material between divergent lineages.
Table 1: Distinguishing ILS from Introgression
| Feature | Incomplete Lineage Sorting | Introgression |
|---|---|---|
| Basis of Discordance | Stochastic allele sorting during speciation | Horizontal gene transfer between species |
| Biological Mechanism | Random segregation of ancestral polymorphisms | Hybridization and backcrossing |
| Genomic Distribution | Genome-wide, following coalescent expectations | Often localized, influenced by selection |
| D-statistics Signal | Symmetric discordance across lineages | Asymmetric, showing excess allele sharing |
| Phylogenetic Network | Best represented by polytomies or soft radiation nodes | Requires reticulate branches with hybridization nodes |
Recent studies emphasize that ILS and introgression frequently co-occur, with their relative contributions varying across the genome and throughout evolutionary history [4]. For example, in Fagaceae, decomposition analyses attributed approximately 9.84% of gene tree variation to ILS and 7.76% to gene flow, with the remainder resulting from gene tree estimation error [3]. Similarly, research on Tulipeae revealed "pervasive ILS and reticulate evolution" among genera, requiring advanced statistical approaches to disentangle these confounding factors [2].
Biological Examples of ILS
ILS has been documented across diverse taxonomic groups, providing crucial insights into evolutionary histories:
Hominid Evolution: Approximately 23% of DNA sequence alignments in Hominidae do not support the established sister relationship between humans and chimpanzees, largely due to ILS [1]. This has complicated inferences about hominin divergence times and relationships [1].
Marsupial Radiation: Over 31% of the genome of the South American monito del monte shows closer affinity to Diprotodontia than to other Australian marsupials due to ILS during ancient radiation events [6]. This study provided empirical evidence that ILS can directly contribute to hemiplasy in morphological traits [6].
Avian Phylogenomics: The deep-scale adaptive radiation of neoavian birds exhibits widespread ILS, creating substantial challenges for resolving their phylogenetic relationships [1].
Asian Warty Newts: In Paramesotriton, ILS was identified as the primary driver of gene tree discordance, supplemented by pre-speciation introgression events [4].
Methodological Framework and Experimental Protocols
Phylogenomic Data Acquisition and Processing
Modern approaches for investigating ILS typically employ transcriptome or genome sequencing to generate multi-locus datasets spanning hundreds to thousands of genetic loci [2]. The standard workflow involves:
Transcriptome Sequencing Protocol:
- Sample Collection: Collect fresh tissue from multiple representative species and outgroups. For Tulipeae research, 50 transcriptomes of 46 species were sequenced, supplemented with 15 publicly available transcriptomes [2].
- RNA Extraction: Use standardized kits (e.g., TRIzol) to extract high-quality RNA.
- Library Preparation and Sequencing: Construct cDNA libraries and sequence using Illumina platforms to generate 150bp paired-end reads.
- Data Processing: Perform quality control (FastQC), adapter trimming (Trimmomatic), and de novo transcriptome assembly (Trinity).
- Ortholog Identification: Identify orthologous genes using orthology inference tools (OrthoFinder) with default parameters.
- Dataset Construction: Generate concatenated alignments for phylogenetic analysis and single-gene alignments for coalescent-based approaches.
Sequence Capture Approaches: As an alternative to transcriptomics, restriction-site associated DNA sequencing (RAD-seq) or targeted sequence capture can be employed, particularly for non-model organisms [4]. These methods provide reduced representation of the genome while still yielding sufficient phylogenetic signal for ILS detection.
Phylogenetic Inference and Discordance Detection
Multi-method Tree Reconstruction:
- Concatenation Approaches: Combine all orthologous loci into a supermatrix for maximum likelihood analysis using software such as IQ-TREE or RAxML [2] [3].
- Coalescent Methods: Infer species trees from individual gene trees using ASTRAL or MP-EST, which explicitly account for ILS [2].
- Bayesian Methods: Employ Bayesian concordance analysis (BUCKy) to estimate the proportion of genes supporting particular phylogenetic relationships.
Incongruence Detection Metrics:
- Site Concordance Factors (sCF): Measure the proportion of informative sites supporting a specific branch in the maximum likelihood tree [2].
- Quartet-based Measures: Calculate the frequency of different quartet resolutions across genes to quantify discordance.
- Gene Tree Discordance Analysis: Visualize and quantify disagreement among gene trees using methods such as DiscoVista.
Statistical Tests for Distinguishing ILS from Introgression
D-statistics (ABBA-BABA Test): This test detects excess allele sharing between non-sister taxa indicative of introgression [2] [5]. The protocol involves:
- Taxon Sampling: Select four taxa in a rooted topology (((P1,P2),P3),O).
- Variant Calling: Identify sites with derived alleles (B) relative to the outgroup (O).
- Pattern Counting: Tally sites with ABBA (shared derived alleles between P2 and P3) and BABA (shared derived alleles between P1 and P3) patterns.
- Statistical Testing: Calculate D = (ABBA - BABA) / (ABBA + BABA). Significant deviation from zero indicates introgression.
QuIBL (Quantitative Introgression from Branch Lengths): This method uses gene tree branch length information to distinguish ILS from introgression and estimate the timing of introgression events [2].
Phylogenetic Network Analysis: Tools such as PhyloNet infer phylogenetic networks with explicit reticulation nodes to represent potential hybridization events, allowing simultaneous modeling of both ILS and introgression [4].
Table 2: Key Analytical Methods for ILS Research
| Method Category | Specific Tools/Approaches | Primary Function | Key Outputs |
|---|---|---|---|
| Tree Inference | IQ-TREE, RAxML (ML); ASTRAL, MP-EST (coalescent) | Phylogenetic reconstruction from sequence data | Species trees, gene trees, branch support values |
| Incongruence Quantification | sCF/sDF; Quartet Concordance; DiscoVista | Measure gene tree conflict | Concordance factors; discordance visualization |
| Introgression Tests | D-statistics; QuIBL; HyDe | Detect gene flow between lineages | D-statistics; introgression proportions |
| Network Modeling | PhyloNet; SNaQ | Infer phylogenetic networks with reticulations | Phylogenetic networks with hybridization nodes |
| Simulation | ms; SIMCOT; PhyloNet | Generate expected patterns under different processes | Null distributions for hypothesis testing |
Visualization of ILS Mechanisms and Analytical Workflows
ILS Mechanism Diagram
Phylogenomic Workflow for ILS Detection
The Scientist's Toolkit: Essential Research Reagents and Solutions
Table 3: Key Research Reagents and Computational Tools for ILS Studies
| Category | Specific Tool/Reagent | Function/Application | Key Features |
|---|---|---|---|
| Wet Lab Reagents | TRIzol/RNA extraction kits | High-quality RNA isolation from diverse tissues | Maintains RNA integrity for transcriptomics |
| Illumina sequencing kits | Library preparation for high-throughput sequencing | Generates 150bp paired-end reads | |
| Target capture baits | Enrichment of specific genomic regions | Cost-effective for non-model organisms | |
| Computational Tools | OrthoFinder | Orthogroup inference from sequence data | Identies orthologous genes across species |
| IQ-TREE | Maximum likelihood phylogenetic inference | Implements complex substitution models | |
| ASTRAL | Species tree estimation from gene trees | Accounts for ILS under multispecies coalescent | |
| HyDe/Dsuite | Introgression detection | Implements D-statistics and related tests | |
| PhyloNet | Phylogenetic network inference | Models reticulate evolution and ILS | |
| Reference Databases | NCBI SRA | Raw sequencing data repository | Access to published transcriptomes/genomes |
| OrthoDB | Comparative genomics of orthologs | Reference for orthology assessment |
Incomplete lineage sorting represents a pervasive evolutionary force that creates substantial challenges for phylogenetic inference, particularly during rapid radiations. The distinction between ILS and introgression-induced discordance requires sophisticated statistical approaches and careful consideration of alternative evolutionary scenarios. As phylogenomic datasets continue to expand, researchers are increasingly able to quantify the relative contributions of these processes, revealing that they frequently co-occur and collectively shape genomic diversity.
For research professionals and drug developers, recognizing the implications of ILS is crucial for accurate evolutionary inference and trait mapping. The persistence of ancestral polymorphisms can create patterns of trait variation that mimic convergent evolution or mislead associations between genotypes and phenotypes. The methodological framework presented here provides a foundation for discriminating between these complex evolutionary processes, enabling more accurate reconstructions of evolutionary history and its functional consequences.
Introgression, also known as introgressive hybridization, describes the transfer of genetic material from one species into the gene pool of another through the repeated backcrossing of an interspecific hybrid with one of its parent species [7] [8]. This process is a distinct and important form of gene flow that occurs between populations of different species, rather than within the same species, and represents a long-term evolutionary process that may take many hybrid generations before significant backcrossing occurs [7].
The study of introgression has gained paramount importance in modern evolutionary biology, particularly in the context of phylogenomics, where it is recognized as a key biological process—alongside incomplete lineage sorting (ILS)—that causes widespread gene tree discordance [3] [2] [9]. Understanding the mechanisms and signatures of introgression is crucial for accurately reconstructing evolutionary histories and for appreciating its role in adaptation, speciation, and the creation of biodiversity [8] [10].
Fundamental Concepts and Definitions
Distinguishing Hybridization from Introgression
While often discussed together, hybridization and introgression represent different stages in the process of genetic exchange:
- Hybridization: The initial mating between genetically distinct individuals from different species or populations, producing hybrid offspring [11]. This results in a relatively even mixture of gene and allele frequencies in the first generation (F1) [7].
- Introgression: The incorporation of novel genes or alleles from one taxon into the gene pool of a second, distinct taxon through repeated backcrossing of hybrids with parental species over multiple generations [7] [8]. This process results in a complex, highly variable mixture of genes and may involve only a minimal percentage of the donor genome [7].
The Process of Introgression
The typical introgression process involves several key stages [7] [8]:
- Initial hybridization between individuals of two distinct species
- Production of partially viable and fertile hybrid offspring
- Backcrossing of hybrids with one or both parental species
- Repeated backcrossing over multiple generations
- Stable incorporation of donor DNA into the recipient gene pool
This process is considered adaptive introgression when the transferred genetic material results in an overall increase in the fitness of the recipient taxon [7] [8].
Genomic Landscapes of Introgression
Non-Random Distribution in Genomes
Introgression does not occur evenly across genomes; certain genomic regions introgress more or less readily than others [8]. Genome-wide analyses have revealed consistent patterns:
- Regions with high gene density show less introgression, potentially due to functional constraints [8].
- Areas with low recombination rates experience reduced introgression because recombination is insufficient to uncouple harmful genes from beneficial introgressed segments [8].
- Genomic regions involved in hybrid incompatibilities act as local barriers to introgression [8].
Genomic Resistance to Introgression
The resistance of certain genomic regions to introgression is mediated by several factors [8]:
- Dobzhansky-Muller incompatibilities: Genes that evolved within one genetic background and are harmful in other genetic backgrounds create strong selective pressure against introgression.
- Gene density and function: Regions critical to species-specific traits or ecological adaptation are often resistant to introgression.
- Architectural differences: Genomic organization variations between species (e.g., chromosome rearrangements) can act as barriers to gene flow.
Table 1: Factors Influencing Genomic Patterns of Introgression
| Factor | Effect on Introgression | Example/Evidence |
|---|---|---|
| Gene Density | Reduced introgression in high-density regions | Observed in humans, Drosophila, and Xiphophorus fishes [8] |
| Recombination Rate | Increased introgression in high-recombination regions | Correlation between recombination hotspots and introgression frequency [8] |
| Selection | Selective maintenance or purging of introgressed regions | Adaptive alleles maintained; incompatible alleles purged [8] |
| Genomic Architecture | Structural variations can block or facilitate introgression | Chromosomal inversions can act as barriers [8] |
Methodological Approaches for Detecting Introgression
The detection of introgression has evolved significantly with advances in genomic technologies and analytical methods. Current approaches can be broadly categorized into three main groups [12]:
- Summary statistics-based methods: Evolving traditional approaches that continue to broaden their applicability across taxa.
- Probabilistic modeling: Provides a powerful framework to explicitly incorporate evolutionary processes.
- Supervised learning: An emerging approach with great potential, particularly when detecting introgressed loci is framed as a semantic segmentation task.
Key Experimental Protocols and Workflows
Protocol 1: Phylogenomic Analysis with D-Statistics
Purpose: To test for signals of introgression and distinguish it from incomplete lineage sorting [2].
Workflow:
- Sequence acquisition: Obtain genomic data (transcriptomes, whole genomes, or target capture data) from multiple individuals of the focal species and outgroups.
- Variant calling: Identify single nucleotide polymorphisms (SNPs) across the genome.
- Data filtering: Remove low-quality sites and potential contaminants.
- Tree topology testing: Use D-statistics (ABBA-BABA test) to evaluate deviations from expected phylogenetic relationships.
- Significance testing: Apply block jackknifing or other resampling methods to assess statistical significance.
Interpretation: A significant D-statistic indicates an excess of shared derived alleles between non-sister taxa, suggesting introgression [2].
Protocol 2: Local Ancestry Inference
Purpose: To identify specific genomic regions that have been introgressed [8].
Workflow:
- Reference panel establishment: Sequence genomes from pure parental populations.
- Hybrid population sequencing: Generate whole-genome data from potentially admixed populations.
- Hidden Markov Model (HMM) application: Use spatial arrangement of differentiated sites and recombination probabilities.
- Ancestry segments identification: Classify genomic regions by their probable ancestry.
- Validation: Compare results across different statistical frameworks (e.g., HMMs vs. conditional random fields).
Applications: Particularly effective for detecting recent introgression where introgressed segments remain long and unbroken [8].
Protocol 3: Phylogenetic Network Analysis
Purpose: To visualize and quantify reticulate evolutionary histories involving introgression [2] [13].
Workflow:
- Multi-locus dataset assembly: Generate sequence data from numerous independent loci.
- Gene tree estimation: Reconstruct phylogenetic trees for each locus.
- Discordance analysis: Identify conflicting phylogenetic signals across gene trees.
- Network reconstruction: Use methods such as neighbor-net or maximum likelihood networks.
- Hybridization testing: Evaluate support for specific introgression events.
Considerations: This approach helps distinguish introgression from incomplete lineage sorting, though these processes can occur simultaneously [2].
The following diagram illustrates the core bioinformatics workflow for detecting introgression from genomic data:
Quantitative Approaches to Discordance Analysis
Advanced phylogenomic studies now enable researchers to quantify the relative contributions of different biological processes to gene tree discordance. A study on Fagaceae demonstrated how decomposition analysis can partition gene tree variation into its constituent causes [3]:
Table 2: Relative Contributions to Gene Tree Discordance in Fagaceae
| Biological Process | Contribution to Gene Tree Variation | Key Characteristics |
|---|---|---|
| Gene Tree Estimation Error (GTEE) | 21.19% | Arises from analytical limitations and data quality issues [3] |
| Incomplete Lineage Sorting (ILS) | 9.84% | Result of ancestral polymorphisms persisting through rapid speciation events [3] |
| Gene Flow (Introgression) | 7.76% | Direct transfer of genetic material between separate evolutionary lineages [3] |
| Consistent Phylogenetic Signal | 58.1-59.5% of genes | Genes exhibiting consistent signals across analyses [3] |
Distinguishing Introgression from Incomplete Lineage Sorting
Differentiating introgression from ILS remains a central challenge in evolutionary genomics. The following experimental approaches are commonly employed:
- Site Concordance Factors (sCF): Measures the percentage of decisive sites supporting a given branch in a phylogenetic tree [2].
- Discordance Factors (sDF1/sDF2): Quantifies alternative phylogenetic signals at the site level [2].
- Polytomy testing: Evaluates whether poorly resolved relationships reflect true simultaneous divergence or subsequent obscuring of phylogenetic signal [2].
- D-statistics and QuIBL: Provides formal testing of alternative phylogenetic hypotheses and can distinguish ILS from introgression [2].
Case Studies Across Diverse Taxa
Plants: Fagaceae and Tulipeae
Research on Fagaceae (oaks, beeches) revealed strong incongruence between cytoplasmic (cpDNA, mtDNA) and nuclear gene trees, with cpDNA and mtDNA dividing species into New World and Old World clades, while nuclear data supported different relationships—a pattern consistent with ancient interspecific hybridization [3]. Similarly, studies in Tulipeae (tulips and relatives) found pervasive ILS and reticulate evolution among Amana, Erythronium, and Tulipa genera, obscuring phylogenetic relationships despite extensive transcriptome sequencing [2].
Animals: Rattlesnakes and Butterflies
Rattlesnakes (genera Crotalus and Sistrurus) exemplify how rapid diversification coupled with introgression creates phylogenetic challenges [13]. Genomic analyses revealed that evolutionary history is "dominated by incomplete speciation and frequent hybridization," necessitating network-based analytical approaches rather than strictly bifurcating trees [13].
In Heliconius butterflies, genomic studies demonstrated adaptive introgression of wing pattern loci [7]. Research found approximately 2-5% introgression between H. melpomene amaryllis and H. melpomene timareta, with strong non-random distribution—significant introgression occurred specifically in chromosomes 15 and 18 where important mimicry loci (B/D and N/Yb) are located [7].
Agricultural Applications: Wheat Breeding
In wheat, an introgression from Triticum timopheevii on chromosome 2B was associated with reduced grain protein content, despite carrying a beneficial powdery mildew resistance gene (Pm6)—demonstrating the challenge of linkage drag in crop breeding [14]. This case highlights both the potential benefits and drawbacks of artificial introgression in agricultural contexts.
The Scientist's Toolkit: Research Reagent Solutions
Table 3: Essential Research Reagents and Resources for Introgression Studies
| Reagent/Resource | Function/Application | Key Considerations |
|---|---|---|
| Custom Bait Kits (e.g., eucalypt-specific 568-gene set) | Target capture sequencing for phylogenomics; enables sequencing of specific genomic regions across multiple taxa [9] | Taxon-specific design improves capture efficiency; allows work on non-model organisms [9] |
| Transcriptome References | Reference sequences for assembly and annotation; enables gene-based phylogenetic analyses [2] | Particularly valuable for organisms with large genomes (e.g., Tulipa, 32-69 pg/2C) where whole genome sequencing is prohibitive [2] |
| Annotated Mitochondrial & Chloroplast Genomes | Organellar phylogenetic reconstruction; identification of cytoplasmic-nuclear discordance [3] | Helps detect historical hybridization through organellar capture; different inheritance patterns provide complementary evidence [3] |
| Hidden Markov Model (HMM) Software | Local ancestry inference; identifies introgressed genomic segments based on patterns of differentiation [8] | Effective for recent introgression where segments are longer; incorporates recombination probabilities [8] |
| D-statistics Implementation | Testing for admixture and introgression; measures allele sharing patterns inconsistent with simple divergence [2] | Robust to incomplete lineage sorting; requires appropriate outgroup and population sampling [2] |
| Phylogenetic Network Software (e.g., ASTRAL, PhyloNet) | Reconstruction of reticulate evolutionary histories; models both divergence and hybridization [2] [13] | Essential for radiations with both ILS and introgression; moves beyond strictly bifurcating trees [13] |
Implications for Evolutionary Biology and Applied Sciences
Evolutionary and Conservation Implications
Introgression has significant implications for our understanding of evolutionary processes:
- Adaptive Evolution: Introgression can provide pre-tested genetic variation that facilitates rapid adaptation to new environments or challenges [8]. Examples include herbicide resistance in weeds, insecticide resistance in mosquitoes, and industrial pollution tolerance in Gulf killifish, where adaptive introgression occurred in less than 20 generations [8].
- Conservation Challenges: Human-induced environmental changes and habitat disturbance can alter patterns of hybridization and introgression, potentially leading to genetic swamping of rare species or creating novel evolutionary trajectories [8].
- Speciation and Diversification: In some cases, introgression has triggered adaptive radiations by creating novel genetic combinations upon which selection can act, as seen in African cichlids, Darwin's finches, and Heliconius butterflies [8].
Future Directions and Methodological Frontiers
The field of introgression research continues to evolve rapidly, with several promising frontiers [12]:
- Improved Detection of Ancient Introgression: Developing methods to identify ghost introgression from extinct lineages.
- Integration of Machine Learning: Applying supervised learning approaches to detect introgressed loci as semantic segmentation tasks.
- Functional Validation: Moving beyond correlative studies to experimentally validate the functional consequences of introgressed alleles.
- Environmental Interaction Studies: Understanding how changing climate and habitats influence hybridization and introgression dynamics.
Introgression represents a fundamental evolutionary process that significantly shapes genomic diversity and evolutionary trajectories across the tree of life. The complex interplay between introgression and incomplete lineage sorting creates challenging but interpretable patterns of gene tree discordance that now can be quantified and distinguished through advanced phylogenomic methods. As methodological innovations continue to emerge, particularly in genomic sequencing and analytical frameworks, our understanding of the prevalence and evolutionary significance of introgression will continue to deepen. This knowledge is essential not only for reconstructing accurate evolutionary histories but also for informing conservation strategies, agricultural practices, and our fundamental understanding of biodiversity generation and maintenance.
This whitepaper provides a technical analysis of two fundamental biological processes—stochastic coalescence and directional gene transfer—that generate phylogenetic discordance. Within evolutionary biology and genomics research, distinguishing between discordance patterns resulting from deep coalescence (incomplete lineage sorting) versus those from introgression (horizontal gene transfer) remains a critical challenge. We examine the mathematical foundations, biological mechanisms, and experimental methodologies for investigating these processes, with particular relevance to drug development challenges such as antimicrobial resistance and understanding pathogen evolution. The comparative framework presented enables researchers to select appropriate analytical approaches and interpret conflicting phylogenetic signals in genomic data.
The reconstruction of evolutionary histories frequently reveals incongruence between gene trees and species trees, presenting significant challenges for accurate phylogenetic inference and downstream applications in comparative genomics. Two predominant biological mechanisms underlie this discordance: stochastic coalescence (manifested as incomplete lineage sorting) and directional gene transfer (including horizontal gene transfer and introgression). While both processes produce similar patterns of topological conflict, their underlying mechanisms and evolutionary implications differ substantially.
Stochastic coalescence operates through the random sorting of ancestral genetic polymorphisms across speciation events, following principles from population genetics and coalescent theory [1]. In contrast, directional gene transfer involves the lateral movement of genetic material between divergent lineages through mechanisms such as transformation, conjugation, or transduction [15] [16]. For researchers investigating pathogen evolution, cancer genomics, or antimicrobial resistance, accurately distinguishing between these processes is essential for understanding evolutionary trajectories and developing effective interventions.
Theoretical Foundations and Mathematical Frameworks
Stochastic Coalescence and Incomplete Lineage Sorting
Stochastic coalescence theory describes how gene lineages merge randomly backward in time within ancestral populations. The multispecies coalescent model provides the mathematical foundation for understanding incomplete lineage sorting (ILS), which occurs when the coalescence of gene lineages predates speciation events [1] [17].
The probability of ILS depends critically on population parameters and branching patterns. For a rooted species tree σ with topology ψ and branch lengths λ, the gene tree topology G represents a random variable with distribution dependent on σ. Under the coalescent model, the relationship between species divergence times and population size (in coalescent units) determines the probability of discordance. Specifically, the probability that two lineages fail to coalesce in a branch of length λ (in coalescent units) is e^(-λ), creating conditions for ILS when internal branches are short relative to population size [17].
A critical concept is the anomaly zone—regions of species tree parameter space where the most likely gene tree topology differs from the species tree topology. For species trees with five or more taxa, anomalous gene trees (AGTs) can occur when internal branches are sufficiently short [17]. This counterintuitive result implies that simple "democratic vote" approaches to species tree estimation can be positively misleading as more genes are added, necessitating more sophisticated statistical approaches.
Table 1: Key Parameters Influencing Incomplete Lineage Sorting
| Parameter | Mathematical Symbol | Biological Interpretation | Effect on ILS |
|---|---|---|---|
| Effective Population Size | Nₑ | Genetic diversity in ancestral population | Positive correlation |
| Internal Branch Length | τ | Time between speciation events | Negative correlation |
| Generation Time | T | Average time between generations | Context-dependent |
| Number of Taxa | n | Number of species in phylogeny | Increases complexity |
| Mutation Rate | μ | Rate of genetic change | Affects detection only |
Directional Gene Transfer Mechanisms and Dynamics
Directional gene transfer encompasses multiple distinct mechanisms for lateral genetic exchange, each with characteristic dynamics and evolutionary implications:
Transformation involves the uptake and incorporation of environmental DNA by bacterial cells, followed by recombination into the recipient genome. This process requires competence factors that facilitate DNA binding, translocation, and integration [15] [16].
Conjugation requires direct cell-to-cell contact mediated by specialized appendages (sex pili) and enables plasmid transfer between bacteria. The process involves relaxosome formation, conjugative pilus assembly, and DNA processing through type IV secretion systems [16] [18].
Transduction utilizes bacteriophages as vectors for intercellular DNA transfer. Both specialized and generalized transduction occur, depending on whether specific or random bacterial DNA fragments are packaged into viral capsids [15] [18].
The rate and impact of horizontal gene transfer (HGT) vary substantially across biological systems. In prokaryotes, HGT represents a major evolutionary force, facilitating rapid adaptation to antibiotics, environmental stressors, and new ecological niches. In eukaryotes, functional HGT occurs less frequently but can still introduce adaptive traits, particularly from endosymbionts or parasites [16] [18].
Table 2: Comparative Analysis of Gene Transfer Mechanisms
| Mechanism | Genetic Material | Vector Required | Host Range | Evolutionary Impact |
|---|---|---|---|---|
| Transformation | Naked DNA/RNA | None | Mostly intra-specific | Medium; limited by competence |
| Conjugation | Plasmids, ICEs | Conjugative pilus | Broad inter-specific | High; targeted transfer |
| Transduction | Chromosomal/plasmid DNA | Bacteriophage | Phage host range | Medium; packaging limits |
| Gene Transfer Agents | Random fragments | Virus-like particles | Mostly intra-specific | Variable; widespread in some taxa |
| Horizontal Transposon Transfer | Transposable elements | Multiple possible | Broad cross-domain | Significant; genome restructuring |
Methodological Approaches and Experimental Protocols
Detecting and Quantifying Incomplete Lineage Sorting
Modern phylogenomic approaches for ILS detection leverage multi-locus datasets and coalescent-based model testing:
Protocol 1: Multi-locus Coalescent Analysis
- Locus Selection: Identify hundreds to thousands of independent, unlinked genomic regions (e.g., orthologous genes, non-coding elements) with minimal recombination within loci.
- Gene Tree Estimation: Reconstruct phylogenetic trees for each locus using maximum likelihood or Bayesian methods with appropriate substitution models.
- Species Tree Inference: Implement coalescent-based species tree methods (ASTRAL, SVDquartets) that explicitly account for ILS rather than simply concatenating alignments.
- Quantify Discordance: Calculate pairwise distances between gene trees and species trees to identify regions of elevated conflict [19].
Protocol 2: Likelihood-based Congruency Testing The Chromo.Crawl pipeline implements a model-based framework for testing phylogenetic congruence along chromosomes:
- Window Selection: Slide windows of specified size (e.g., 10-100 kb) across whole genome alignments.
- Tree Estimation: Reconstruct phylogenetic trees for each window using maximum likelihood approaches (e.g., IQ-TREE).
- Congruency Assessment: Apply likelihood ratio tests to assess whether adjacent windows share the same underlying tree topology.
- Supergene Construction: Concatenate contiguous windows that show no significant evidence of discordance [19].
This chromosome-aware approach accommodates both ILS and recombination by incorporating spatial information along genomes, unlike earlier "statistical binning" methods that ignored linkage.
Identifying Horizontal Gene Transfer Events
HGT detection relies on identifying phylogenetic inconsistencies or atypical sequence composition:
Protocol 1: Phylogenetic Incongruence Method
- Gene Tree-Species Tree Comparison: Reconstruct gene trees for putative orthologs and compare with established species phylogenies.
- Statistical Support: Apply statistical tests (e.g., Shimodaira-Hasegawa test, Approximately Unbiased test) to reject the null hypothesis of topological identity.
- Alternative Explanation Exclusion: Rule out ILS as the primary cause of discordance using population genetic parameters and coalescent simulations.
- Directionality Inference: Identify donor and recipient lineages through ancestral state reconstruction [18].
Protocol 2: Compositional Signature Analysis
- Sequence Feature Extraction: Calculate k-mer frequencies, GC content, codon usage patterns, and other compositional features.
- Comparative Profiling: Compare these features against genomic background distributions.
- Anomaly Detection: Identify genes with significantly different compositional signatures suggesting foreign origin.
- Donor Prediction: Use similarity searching and phylogenetic placement to identify potential donor lineages [16] [18].
For both approaches, rigorous validation requires integration of multiple lines of evidence and careful consideration of potential confounding factors such as variation in evolutionary rates and compositional heterogeneity.
Visualization and Analytical Workflows
Figure 1: Phylogenomic Analysis Workflow for ILS and HGT Detection
Table 3: Key Research Reagents and Computational Tools
| Resource Category | Specific Tool/Reagent | Application/Function | Technical Considerations |
|---|---|---|---|
| Phylogenetic Software | IQ-TREE [19] | Maximum likelihood tree estimation with model selection | Efficient for large genomic datasets |
| ASTRAL [17] | Coalescent-based species tree estimation | Accounts for ILS; inputs gene trees | |
| Specialized Pipelines | PhyloWGA [19] | Chromosome-aware phylogenetic analysis of whole genome data | Integrates spatial genomic information |
| Chromo.Crawl [19] | Identifies phylogenetically congruent regions along chromosomes | Uses likelihood-based model testing | |
| Statistical Frameworks | CONCATEPILLAR [19] | Statistical test for phylogenetic congruency among loci | Foundation for Chromo.Crawl pipeline |
| Biological Materials | Competent bacterial cells [15] | Transformation assays for HGT studies | Species-specific efficiency variations |
| Bacteriophage libraries [18] | Transduction studies and vector analysis | Host range limitations apply | |
| Sequence Databases | Antibiotic resistance gene databases [15] [16] | Reference for identifying horizontally acquired resistance genes | Requires regular updating |
Research Implications and Applications
Clinical and Pharmaceutical Applications
Understanding the distinction between stochastic coalescence and directional gene transfer has profound implications for addressing antimicrobial resistance (AMR). Horizontal transfer represents the primary mechanism for disseminating antibiotic resistance genes among bacterial pathogens, with conjugation and transformation enabling rapid spread within and between species [15] [16]. The staphylococcal cassette chromosome mec (SCCmec) elements, which confer methicillin resistance in Staphylococcus aureus, exemplify how mobile genetic elements facilitate AMR dissemination through directional transfer [16].
In drug development, recognizing the role of HGT in virulence evolution informs vaccine design and antimicrobial targeting. Pathogens with high rates of horizontal gene transfer may rapidly acquire resistance to single-mechanism drugs, necessitating combination therapies or drugs targeting essential cellular functions with reduced horizontal transfer potential [15] [18].
Evolutionary Biology and Comparative Genomics
The theoretical framework distinguishing ILS from introgression reshapes understanding of evolutionary relationships, particularly in rapidly radiating lineages. In primate evolution, including hominids, approximately 23% of gene trees conflict with the established species tree, with both ILS and introgression contributing to these patterns [1]. Similar phenomena occur across diverse taxonomic groups, from birds to plants, requiring careful analytical approaches to reconstruct accurate species relationships.
Comparative genomic studies leveraging whole genome alignments reveal heterogeneous patterns of phylogenetic conflict across chromosomes. Centromeric and telomeric regions often exhibit elevated discordance due to higher recombination rates and potential introgression, while genomic regions with reduced recombination show more tree-like evolution [19]. Chromosome-aware phylogenetic methods like PhyloWGA enable researchers to map these patterns and infer their evolutionary causes.
Stochastic coalescence and directional gene transfer represent distinct evolutionary processes that generate similar patterns of phylogenetic discordance through different mechanisms. While ILS operates through random lineage sorting following coalescent principles, HGT involves directed genetic exchange with potentially adaptive consequences. Disentangling these processes requires integrated methodological approaches combining population genetic, phylogenetic, and genomic spatial analyses.
For researchers addressing pressing challenges in antimicrobial resistance, pathogen evolution, and comparative genomics, recognizing the signatures of these processes enables more accurate evolutionary inference and more effective intervention strategies. Continued development of analytical methods that incorporate both biological reality and practical computational constraints will enhance our ability to reconstruct evolutionary histories and predict evolutionary trajectories in diverse biological systems.
Incomplete lineage sorting (ILS) is a pervasive biological phenomenon and a primary source of gene tree-species tree discordance in phylogenomic studies. It occurs when ancestral genetic polymorphisms persist across multiple speciation events and are randomly sorted into descendant lineages [1]. The prevalence and impact of ILS are not uniform across the tree of life; they are strongly concentrated under specific biological and historical scenarios. This technical guide examines the two primary scenarios that favor extensive ILS: large ancestral population sizes and rapid evolutionary radiations, providing researchers with the analytical framework to identify, quantify, and account for ILS in phylogenomic datasets.
The accurate differentiation of ILS from introgression represents a fundamental challenge in evolutionary genomics. While both processes generate similar patterns of gene tree discordance, they stem from distinct biological mechanisms and have different implications for understanding evolutionary history [20] [21]. ILS is a neutral process resulting from the persistence and stochastic sorting of ancestral variation, whereas introgression involves the transfer of genetic material between already separated lineages. This distinction is crucial for reconstructing accurate species trees and understanding the mechanisms driving lineage diversification.
Theoretical Foundations of ILS
The Population Genetics Basis of ILS
Incomplete lineage sorting occurs when the coalescence of gene lineages in an ancestral population predates a speciation event. The probability of ILS is fundamentally governed by the relationship between population genetic parameters and the timing of speciation events. Specifically, the key determinant is the ratio of the effective population size (Nₑ) to the time between successive speciation events (τ), approximated by the formula P(ILS) ∝ e^(–τ/Nₑ) [22].
In sexually reproducing diploid organisms with large populations, ancestral lineages persist longer due to reduced genetic drift. When these large populations experience closely-spaced speciation events, different genomic regions retain conflicting phylogenetic signals because ancestral polymorphisms fail to coalesce before subsequent splits [1]. This creates the genomic mosaic observed in many rapidly diverged lineages, where no single gene tree accurately represents the entire genome's history.
Distinguishing ILS from Introgression
While ILS and introgression both cause gene tree discordance, they can be distinguished through careful analysis. ILS produces discordance that is random and symmetric across the genome, with no directional signal between specific lineages. In contrast, introgression often generates directional and localized discordance, particularly in genomic regions adjacent to loci under selection [20] [23].
The distinction has profound implications for trait evolution. ILS can lead to hemiplasy, where traits encoded by ancestral polymorphisms appear in non-sister lineages despite a single origin, creating the illusion of convergent evolution [6]. Introgression, however, transfers traits through hybridization, potentially introducing adaptive variation across species boundaries [23].
Figure 1: Conceptual workflow distinguishing ILS from introgression. ILS requires large ancestral populations and rapid, successive speciation events, leading to random sorting of ancestral polymorphisms. Introgression requires secondary contact after divergence, resulting in directional gene flow.
Biological Scenarios Promoting ILS
Large Ancestral Population Sizes
Large effective population sizes (Nₑ) directly increase the probability and extent of ILS by extending the mean coalescence time of neutral alleles. The expected time to coalescence for a pair of alleles is 2Nₑ generations, meaning polymorphisms can persist through multiple speciation events when Nₑ is large relative to the time between speciations [22].
Genomic Evidence:
- In great apes, despite moderate Nₑ, approximately 30% of the gorilla genome is closer to human or chimpanzee than humans and chimpanzees are to each other due to ILS [1] [22]
- In Eucalyptus species, large standing populations and long generation times create ideal conditions for ILS, confounding phylogenetic resolution despite clear species groupings [9]
Rapid Evolutionary Radiations
Rapid radiations, characterized by successive speciation events occurring in close temporal proximity, provide insufficient time for ancestral polymorphisms to fully sort between diverging lineages. This scenario creates particularly challenging phylogenetic contexts where ILS can affect substantial portions of the genome.
Table 1: Documented ILS in Rapid Evolutionary Radiations
| Taxonomic Group | Evolutionary Context | Extent of ILS | Key Genomic Evidence | Citation |
|---|---|---|---|---|
| Neoavian birds | Post-K-Pg boundary radiation (~66 mya) | 35% of autosomes, 34% of Z chromosome | 2,118 retrotransposon markers show widespread discordance | [24] |
| Marsupials | Ancient radiation ~60 mya | >50% of genomes | Whole-genome analyses reveal pervasive conflicting signals | [6] |
| Hominids (Great Apes) | Rapid succession of speciation events | ~30% of genomes | Gene tree discordance despite clear species relationships | [1] [22] |
| Fagaceae (Oak family) | Post-K-Pg and Oligocene-Miocene radiations | Significant contributor to gene tree variation | Decomposition analysis quantifies ILS contribution | [21] |
| Eucalyptus subgenus Eudesmia | Multiple rapid radiations | Extreme gene tree discordance at deep nodes | Target capture sequencing of 568 genes | [9] |
The neoavian bird radiation represents a particularly extreme case, where the combination of rapid speciation following ecological opportunity (after the K-Pg mass extinction) resulted in a "star-like" diversification with up to 100% ILS per branch in the initial radiation phase [24]. Under such conditions, the very concept of a strictly bifurcating tree breaks down, and evolutionary history is more accurately represented as a network within a species tree.
Quantitative Assessment of ILS
Measuring ILS Prevalence
The prevalence of ILS in a phylogeny can be quantified using various genomic markers and statistical approaches:
Table 2: Quantitative Methods for ILS Assessment
| Method | Application | Advantages | Limitations | Representative Findings |
|---|---|---|---|---|
| Retrotransposon presence/absence | Deep radiations (e.g., birds) | Virtually homoplasy-free, genome-wide distribution | Complex laboratory validation required | Identified 35% ILS in neoavian birds [24] |
| Whole-genome sequence coalescence | Various taxonomic groups | Comprehensive, base-resolution | Computationally intensive | Revealed >50% ILS in marsupials [6] |
| Gene tree decomposition analysis | Complex lineages (e.g., Fagaceae) | Quantifies relative contributions of ILS vs. other factors | Requires extensive genomic resources | ILS accounted for 9.84% of gene tree variation in oaks [21] |
| Multispecies coalescent modeling | Any group with genomic data | Statistical robustness, accounts for uncertainty | Model assumption sensitivity | Estimated 30% ILS in hominids [22] |
Case Study: Experimental Protocol for ILS Detection in Avian Radiation
The following methodology from Suh et al. (2015) exemplifies a rigorous approach to ILS quantification [24]:
1. Genome-Wide Marker Development:
- Isolated ~130,000 long terminal repeat (LTR) retrotransposons from 48 bird genomes
- Applied strict orthology criteria to identify 2,118 presence/absence markers
- Performed visual inspection to exclude potential homoplasy (independent insertions or precise excisions)
2. Phylogenetic Analysis:
- Analyzed retrotransposon matrix using Felsenstein's polymorphism parsimony
- Identified conflict-free markers (1,373 of 2,118) supporting the species tree
- Classified remaining markers by ILS strength: weak (persistence across 2 speciations), moderate (3 events), or strong (>3 events)
3. ILS Quantification:
- Mapped discordant markers across the phylogeny
- Calculated per-branch ILS percentages
- Correlated ILS concentration with known rapid radiations
4. Validation:
- Confirmed minimal homoplasy by examining distribution of incongruences
- Verified that discordances were concentrated in rapid radiations, not randomly distributed
This protocol successfully demonstrated that the initial neoavian radiation contained significantly higher ILS than subsequent diversifications, with three distinct adaptive radiations identified: an initial near-K-Pg "super-radiation" with extreme ILS, followed by two post-K-Pg radiations (core landbirds and core waterbirds) with progressively less ILS [24].
Research Toolkit for ILS Studies
Table 3: Essential Research Reagents and Computational Tools for ILS Research
| Tool Category | Specific Solution | Application in ILS Research | Technical Considerations |
|---|---|---|---|
| Genomic Sequencing | Whole-genome sequencing | Comprehensive variant detection for coalescent analysis | High computational resources required for large datasets |
| Target Capture | Custom bait sets (e.g., Angiosperms353, eucalypt-specific baits) | Phylogenomic analysis across hundreds of loci | Enables work with degraded DNA (herbarium specimens) |
| Phylogenetic Software | ASTRAL, MP-EST, BEAST | Coalescent-based species tree inference accounting for ILS | Models gene tree-species tree discordance explicitly |
| Retrotransposon Analysis | Custom pipelines for LTR identification | Nearly homoplasy-free phylogenetic markers | Requires rigorous orthology validation |
| Network Analysis | PhyloNet, TreeMix | Modeling both ILS and introgression simultaneously | Distinguishes between different sources of discordance |
| Gene Expression | RNA-seq whole transcriptome | Studying phenotypic effects of ILS (hemiplasy) | Connects genomic patterns to trait evolution |
Implications for Trait Evolution and Drug Development
The impact of ILS extends beyond phylogenetic reconstruction to influence trait evolution and potentially drug target identification. When ILS affects functional genes, it can create patterns of trait distribution that do not match the species tree—a phenomenon known as hemiplasy [6].
In marsupials, functional experiments have demonstrated how ILS directly contributed to morphological evolution. Mitat-Valdez et al. (2022) identified hundreds of genes that experienced stochastic fixation during ILS, encoding the same amino acids in non-sister species [6]. Through functional validation, they established causal links between ILS-affected genes and phenotypic traits that were established during rapid speciation approximately 60 million years ago.
For biomedical researchers studying model organisms, unrecognized ILS can complicate comparative analyses. If ILS affects genes involved in drug metabolism or disease pathways, it could create misleading patterns of conservation or divergence. This is particularly relevant when extrapolating findings from animal models to humans, as the primate lineage experienced significant ILS [1] [22].
Figure 2: Implications of ILS for trait evolution and biomedical research. ILS affecting functional genes can lead to hemiplasy, where traits appear in non-sister lineages, potentially causing incorrect evolutionary inferences and affecting drug target identification. Functional validation is required to establish accurate trait history.
Incomplete lineage sorting represents a fundamental challenge and opportunity in evolutionary genomics. The biological scenarios that favor ILS—large populations and rapid radiations—create predictable patterns of genomic discordance that can be distinguished from introgression through appropriate analytical frameworks. As phylogenomic datasets expand, recognizing and accounting for ILS becomes increasingly crucial for accurate evolutionary inference, particularly in groups with complex diversification histories.
The implications extend beyond systematics to functional genetics and biomedical research, where ILS can create misleading patterns of trait evolution. By integrating the population genetic principles, methodological approaches, and analytical tools outlined in this guide, researchers can better navigate the complexities of gene tree discordance, ultimately leading to more accurate reconstructions of evolutionary history and its functional consequences.
The genomic revolution has revealed that the evolutionary histories of genes and species are often not congruent, a phenomenon known as gene tree discordance. Two major processes underlie this discordance: incomplete lineage sorting (ILS), the retention of ancestral polymorphism through speciation events, and introgression, the transfer of genetic material between diverged lineages through hybridization. Disentangling their relative contributions remains a central challenge in evolutionary biology. This technical guide examines the specific ecological, demographic, and genomic conditions that promote introgression following secondary contact, focusing on scenarios where reproductive barriers are sufficiently permissive to allow genetic exchange while maintaining lineage integrity. Understanding these conditions is critical for accurately reconstructing evolutionary histories, identifying adaptively introgressed loci, and comprehending the dynamics of biodiversity.
Table 1: Key Definitions
| Term | Definition |
|---|---|
| Adaptive Introgression | The natural transfer of genetic material by interspecific breeding and backcrossing of hybrids with parental species followed by selection on introgressed alleles [25]. |
| Incomplete Lineage Sorting (ILS) | The retention of ancestral genetic polymorphisms among descendant lineages due to rapid succession of speciation events [2]. |
| Secondary Contact | Restoration of sympatry between populations that have evolved in allopatry for some time, often leading to hybridization [26]. |
| Genetic Swamping | Gene flow from an abundant species toward a species with a smaller population size that can lead to outbreeding depression [25]. |
| Islands of Differentiation | Genomic regions exhibiting unusually high levels of differentiation between populations or species, potentially involved in reproductive isolation [20]. |
The Genomic Landscape of Discordance
Gene tree discordance manifests as a mosaic across genomes, with regions of different genealogical histories embedded within a background of the dominant species tree. In young radiating lineages, insufficient time has passed for ancestral polymorphisms to fully sort, making ILS a common issue [20]. Concurrently, ongoing gene flow is rampant in recently diverged lineages with overlapping ranges, leading to introgression that creates heterogeneous patterns of divergence across the genome [20].
This heterogeneity often results in "islands of differentiation"—genomic regions with elevated genetic differences between populations against a backdrop of low differentiation in neutrally evolving regions [20]. These islands can arise through two fundamentally different processes: they may represent barrier loci under divergent selection that resist genomic swamping by an invading population, or conversely, they may reflect locus-specific introgression of advantageous alleles into a heterospecific background [20]. Distinguishing between these scenarios is crucial for identifying the underlying mechanisms of adaptation and speciation.
Conditions Favoring Introgression over ILS
Ecological and Demographic Context
Secondary contact often occurs in suture zones, regions where organisms expand out of their refugia and come into secondary contact. In Europe, several such zones have been identified, influenced by mountain ranges like the Pyrenées and Alps that act as physical barriers to expansion from different refugia [20]. The outcome of secondary contact—whether leading to widespread introgression or limited gene flow—depends heavily on demographic history and environmental context.
Pleistocene glacial cycles have been a major driver of secondary contact in many temperate taxa. Populations isolated in separate refugia during glacial periods subsequently expanded and made contact during interglacials. For example, in the European crow complex, carrion and hooded cows took refuge in the Iberian Peninsula and the Middle East, respectively, during Pleistocene glaciations [20]. When these populations later made secondary contact, asymmetric gene flow from expanding hooded crow populations homogenized most of the genome in Western and Central European carrion crow populations, with the exception of a single major-effect color locus under sexual selection [20].
Permissive Reproductive Barriers
The nature and strength of reproductive barriers determine the extent of introgression following secondary contact. Research across diverse taxa reveals that pervasive gene flow can occur despite strong reproductive barriers, with multiple isolating mechanisms often working in concert to form strong but incomplete reproductive barriers [27].
Prezygotic Barriers: Assortative mating can maintain distinct ancestry clusters within hybrid populations. In swordtail fishes (Xiphophorus), genomic evidence from wild populations shows strongly bimodal ancestry distributions consistent with assortative mating, despite the presence of some intermediate individuals [27]. Interestingly, behavioural trials in swordtails revealed complex patterns, with one species (X. cortezi) showing strong conspecific preferences while its sister species (X. birchmanni) showed no such preference [27], indicating asymmetric behavioral barriers.
Postzygotic Barriers: Genetic incompatibilities often reduce hybrid viability or fertility. In swordtails, F2 hybrid crosses revealed several genomic regions that strongly impact hybrid viability [27]. Strikingly, some of these incompatibility regions were shared between different species pairs, suggesting that ancient hybridization played a role in their origin and subsequent spread through introgression [27].
Table 2: Conditions Promoting Introgression in Secondary Contact Zones
| Condition Category | Specific Factors | Representative Taxa |
|---|---|---|
| Ecological & Demographic | Recent divergence time; Expansion from Pleistocene refugia; Asymmetric population sizes | European crows [20]; Swordtail fish [27] |
| Reproductive Barriers | Weak or asymmetric prezygotic barriers; Limited hybrid inviability; Absence of complete sterility | Aquilegia [28]; Swordtail fish [27]; Gossypium [29] |
| Genomic Architecture | Few large-effect barrier loci; High recombination rates; Limited linkage to incompatibility loci | European crows [20]; Beetles [30] |
Detecting and Quantifying Introgression
Genomic Scan Methods
Several computational approaches have been developed to detect introgression from genomic data. The Gmin method is a computationally efficient, haplotype-based approach designed specifically for identifying introgressed regions in secondary contact scenarios [26]. Gmin is defined as the ratio of the minimum between-population number of nucleotide differences in a genomic window to the average number of between-population differences [26]. This measure is particularly sensitive to recent gene flow, as introgressed regions will exhibit reduced minimum divergence compared to the genomic background.
Simulation studies demonstrate that Gmin has both greater sensitivity and specificity for detecting recent introgression compared to traditional measures like FST [26]. The sensitivity of Gmin is robust to variation in population mutation and recombination rates, making it applicable across diverse genomic contexts. When applied to the X chromosome of Drosophila melanogaster, Gmin identified candidate regions of introgression between sub-Saharan African and cosmopolitan populations that were previously missed by other methods [26].
Phylogenetic Network and Coalescent Methods
For deeper evolutionary timescales, D-statistics (ABBA-BABA tests) provide a powerful framework for detecting introgression by measuring allelic patterns that deviate from a strict bifurcating phylogeny [2]. This method has been widely applied across diverse taxa, including Liliaceae tribe Tulipeae, where it revealed pervasive ILS and reticulate evolution among Amana, Erythronium, and Tulipa [2].
QuIBL (Quantitative Introgression from Branch Lengths) offers another approach, leveraging information on branch length distributions to quantify introgression [2]. When standard species tree inference methods yield uncertain relationships with low support, as observed in Tulipeae, these methods become essential for testing alternative hypotheses of ILS versus introgression [2].
Experimental Protocols for Introgression Research
Genomic Analysis Workflow
A comprehensive protocol for detecting introgression should integrate multiple lines of evidence:
Data Collection: Whole-genome resequencing or transcriptome sequencing of multiple individuals across putative hybrid zones and reference populations [2] [28].
Variant Calling: Identify single nucleotide polymorphisms (SNPs) using standardized pipelines, followed by rigorous filtering for quality and linkage disequilibrium [28].
Phylogenetic Reconstruction: Construct both concatenated and coalescent-based species trees from nuclear and organellar markers to identify discordant regions [2].
Introgression Tests: Apply D-statistics and related approaches to test for significant deviations from tree-like evolution [2] [28].
Ancestry Estimation: Use local ancestry inference methods to identify introgressed tracts in admixed individuals [27].
Demographic Modeling: Fit models with varying migration parameters to estimate the timing and magnitude of introgression events.
Functional Validation Experiments
Genomic scans for introgression should be complemented with experimental validation:
Hybrid Crosses: Controlled crosses in laboratory or common garden conditions to assess hybrid viability, fertility, and other fitness components [27]. For example, F2 hybrid crosses in swordtail fish revealed genomic regions with strong effects on hybrid viability [27].
Behavioral Assays: Mate choice trials to quantify the strength and asymmetry of prezygotic barriers [27]. These assays can test preferences for visual, olfactory, or auditory cues between hybridizing taxa.
Phenotypic Measurements: Quantification of morphological, physiological, or life-history traits in parents and hybrids to identify transgressive segregation or intermediate phenotypes [28] [31].
Gene Expression Analysis: RNA sequencing of parental species and hybrids to identify misexpression patterns that might underlie hybrid dysfunction [27].
Case Studies across Diverse Taxa
Avian Hybrid Zones: European Crows and Magpies
The European crow hybrid zone between all-black carrion crows (Corvus (c.) corone) and grey-coated hooded crows exemplifies extreme gene tree discordance [20]. Genomic analyses reveal that most of the genome in Western and Central European carrion crow populations is near-identical to hooded crows, differing substantially from their Iberian congeners [20]. A notable exception is a single major-effect color locus under sexual selection that aligns with the species tree [20]. This pattern suggests asymmetric gene flow from expanding hooded crow populations that homogenized most of the genome, while divergent selection on plumage color maintained differentiation at the phenotype-determining locus.
In magpies (Pica pica), a secondary contact zone between subspecies in southern Siberia reveals asymmetric introgression patterns [31]. Genetic analyses show that males of P. p. jankowskii exhibit higher dispersal ability toward the west compared to P. p. leucoptera moving east [31]. This asymmetry results in introgression of nuclear, but not mitochondrial, DNA in Transbaikalia and eastern Mongolia [31]. Bioacoustic investigations found differences in vocalization speed and structure between subspecies, with hybrid magpies producing intermediate calls or alternating between parental calls [31]. Dramatically decreased reproductive success in hybrid populations suggests emerging postzygotic barriers [31].
Plant Radiations: Aquilegia and Gossypium
In the columbine genus Aquilegia, cryptic radiation in the mountains of Southwest China demonstrates how standing genetic variation and introgression shape rapid diversification [28]. Whole-genome resequencing of 158 individuals from 23 populations revealed three to four paraphyletic lineages within each morphological species [28]. Among 43 detected introgression events, 39 occurred post-lineage formation [28]. Divergence of fixed singletons in lineages from morphological species A. kansuensis and A. rockii predates lineage formation, supporting a scenario where incomplete lineage sorting of standing variation contributes to morphological parallelism [28].
Similarly, in cotton (Gossypium), analysis of 25 genomes revealed widespread ILS and introgression that shaped the adaptive radiation of the genus [29]. During a rapid radiation event in Gossypium evolution, ILS regions were non-randomly distributed across the genome [29]. Strong natural selection acted on specific ILS regions, with approximately 15.74% of speciation structural variation genes and 12.04% of speciation-associated genes intersecting with ILS signatures [29]. This highlights the role of ILS in providing genetic variation for adaptive radiation.
Table 3: Quantitative Patterns of Introgression across Case Studies
| Taxonomic Group | Key Finding | Statistical Support |
|---|---|---|
| European Crows | Most of genome homogenized except single color locus | <1% of genome resists gene flow [20] |
| Swordtail Fish | Bimodal ancestry distribution in hybrid populations | 62% in one cluster, 38% in another (D = 0.166, P < 2.2×10⁻¹⁶) [27] |
| Aquilegia | Post-lineage formation introgression predominates | 39 of 43 introgression events post-lineage [28] |
| Gossypium | ILS overlaps with speciation genes | 15.74% speciation SV genes in ILS regions [29] |
The Scientist's Toolkit
Table 4: Essential Research Reagents and Computational Tools
| Tool/Reagent | Primary Function | Application Context |
|---|---|---|
| Whole-genome sequencing | Comprehensive variant discovery | Identifying introgressed loci across entire genomes [28] |
| Transcriptome sequencing | Gene expression analysis | Assessing functional consequences of introgression [2] |
| D-statistics | Detecting introgression from allele patterns | Testing departure from tree-like evolution [2] |
| Gmin | Scanning for recent introgression | Identifying introgressed regions in secondary contact [26] |
| Local Ancestry Inference | Estimating ancestry along chromosomes | Mapping introgressed tracts in admixed individuals [27] |
| MSMOVE | Simulating gene flow under coalescent | Modeling demographic history with migration [26] |
| ASTRAL | Species tree estimation | Handling gene tree discordance from ILS [2] |
Integrated Framework and Future Directions
The evidence across diverse taxa reveals that introgression is promoted by a combination of ecological opportunity (secondary contact), permissive barriers (asymmetric or incomplete reproductive isolation), and genomic architecture (heterogeneous recombination and selection). A critical insight is that standing genetic variation and introgression can work in concert to facilitate rapid diversification, particularly in cryptic radiations where morphological similarity belies genetic divergence [28].
An emerging paradigm is that ancient hybridization can spread genetic incompatibilities to additional species pairs [27]. In swordtails, ancestry mismatch at incompatible regions has remarkably similar consequences for phenotypes and hybrid survival in different species combinations, suggesting shared genetic architectures of reproductive isolation derived from ancient introgression [27]. This has profound implications for understanding how reproductive barriers evolve in the face of gene flow.
Future research should focus on integrating genomic scans with functional validation, moving beyond correlation to causation. The development of methods that can better distinguish introgression from ILS in increasingly complex scenarios, including multi-species networks and polyploid systems, will enhance our understanding of the genomic conditions that promote introgression. Ultimately, recognizing the pervasive role of introgression reshapes our understanding of the speciation process and the maintenance of biodiversity.
In the field of phylogenomics, gene tree discordance—the phenomenon where gene trees inferred from different genomic regions display conflicting evolutionary histories—presents a significant challenge and a source of rich biological information. For research focused on distinguishing between incomplete lineage sorting (ILS) and introgression, understanding the expected distribution of gene trees is fundamental. Under a neutral multispecies coalescent model for three species, ILS produces a symmetric distribution of gene trees: the two discordant topologies are expected to occur with equal frequency, while the concordant topology is the most frequent [32]. This symmetric expectation serves as a critical null model. However, biological processes, notably selection and introgression, can disrupt this symmetry, creating predictable and interpretable asymmetries in gene tree distributions. This technical guide details the theoretical expectations for these distributions, provides methodologies for their analysis, and frames these concepts within the broader context of discerning evolutionary forces from genomic data.
Theoretical Foundations of Gene Tree Distributions
The Standard Model: Incomplete Lineage Sorting and Symmetry
The multispecies coalescent (MSC) model provides the primary theoretical framework for understanding gene tree discordance. For a simple three-species phylogeny (Species A, B, and C, with A and B as sister species), the genealogical history of any single unlinked, neutral locus can fall into one of three possible topologies: the concordant tree ((A,B),C) and two discordant trees ((A,C),B) and ((B,C),A).
A key prediction of the neutral MSC model is that the two discordant gene trees occur with equal probability [32]. This symmetry arises because the underlying coalescent process is stochastic and has no inherent bias toward one discordant topology over the other. The frequency of the concordant tree is always expected to be the highest, and the two discordant trees are present at equal, lower frequencies. This symmetrical distribution is the null expectation against which empirical data is tested.
Processes Leading to Asymmetrical Distributions
Deviations from the symmetrical expectation provide powerful evidence for the action of non-neutral or non-tree-like evolutionary processes.
- Purifying Selection and Population Size Variation: Even under pervasive purifying selection, if its fitness effects are constant across a species tree, one might expect the neutral expectation to hold. However, asymmetric gene tree distributions can arise under purifying selection if differences in population size exist among species [32]. This occurs because selection reduces the effective population size at linked sites (the background selection effect). Variation in the intensity of this effect across lineages, due to differences in demographic history or mutation rate, can alter the relative probabilities of coalescent events, breaking the symmetry between the two discordant trees. In extreme cases, a discordant tree can become the most frequent topology [32].
- Introgression (Reticulate Evolution): Gene flow between non-sister lineages, or introgression, is a major driver of asymmetric gene tree distributions. Unlike ILS, which is a vertical process, introgression is a horizontal transfer of genetic material. If gene flow occurs, for example, between Species A and Species C, it will systematically increase the frequency of the ((A,C),B) gene tree across the genomic regions affected by the introgression event. This creates a strong asymmetry where one discordant tree is significantly more frequent than the other [2] [13]. Phylogenomic studies in diverse groups, such as Liliaceae tribe Tulipeae and rattlesnakes, have shown that widespread introgression can be a primary contributor to phylogenetic discordance [2] [13].
- Other Factors: While selection and introgression are primary drivers, other factors can also contribute to asymmetry. For instance, biases in gene tree estimation due to model misspecification, systematic errors in multiple sequence alignment, or heterogeneity in substitution models across lineages can create artificial asymmetries. It is therefore critical to employ robust bioinformatic practices to minimize these confounding factors.
Quantitative Expectations and Analytical Framework
Table 1: Characteristics of Symmetrical vs. Asymmetrical Gene Tree Distributions
The following table summarizes the key features that distinguish the causes of gene tree discordance.
Table 1: Key characteristics of gene tree distributions under different evolutionary processes for a three-taxon scenario (where (A,B) is the species tree).
| Feature | Neutral Incomplete Lineage Sorting (ILS) | ILS with Selection & Demography | Introgression (e.g., A-C) |
|---|---|---|---|
| Distribution Shape | Symmetric | Asymmetric | Asymmetric |
| Frequency of Discordant Trees | Equal | Unequal | Unequal |
| Most Frequent Discordant Tree | N/A (both equal) | Context-dependent, can be ((A,C),B) or ((B,C),A) | Specifically enriched for the tree matching the introgression pathway (e.g., ((A,C),B)) |
| Genomic Distribution of Signal | Genome-wide, homogeneous | Genome-wide, homogeneous | Heterogeneous, clustered in genomic regions affected by gene flow |
| Underlying Process | Stochastic coalescent process in ancestral populations | Altered coalescence probabilities due to linked selection & demography | Horizontal transfer of genetic material between lineages |
| Key Statistical Test | Site-based concordance factors (sCF) [2] | D-statistics (ABBA-BABA), QuIBL [2] | D-statistics (ABBA-BABA), Phylogenetic Networks [13] |
Diagram 1: Theoretical Gene Tree Distributions
The following diagram illustrates the expected gene tree distributions under different evolutionary scenarios for a three-taxon tree.
Experimental Protocols for Distinguishing the Causes of Discordance
Differentiating between ILS and introgression as the cause of gene tree discordance requires a combination of phylogenomic analyses and statistical tests.
Protocol 1: Phylogenomic Analysis and Concordance Factor Calculation
This protocol forms the baseline for quantifying gene tree discordance.
- Data Collection and Orthology Prediction: Sequence transcriptomes or genomes for the target taxa and outgroups. Identify orthologous genes (OGs) using tools like OrthoFinder. A study on Tulipeae, for example, constructed a nuclear dataset of 2,594 nuclear OGs [2].
- Gene Tree and Species Tree Inference: For each OG, infer a maximum likelihood (ML) gene tree. Reconstruct a species tree using ML on a concatenated dataset and/or a summary method like ASTRAL under the multi-species coalescent (MSC) model [2].
- Calculate Concordance Factors (CFs): For each node in the species tree, calculate:
- Gene Concordance Factor (gCF): The percentage of identifiable gene trees containing that node.
- Site Concordance Factor (sCF): The percentage of alignment sites supporting a given branch in the species tree, based on parsimony. This is less sensitive to gene tree error [2].
- Interpretation: Under ILS, one expects low but symmetrical gCF/sCF values for the discordant branches. Asymmetry in these values suggests a deviation from the neutral ILS model.
Protocol 2: Statistical Tests for Introgression
This protocol tests specifically for asymmetry indicative of gene flow.
- D-statistics (ABBA-BABA Test):
- Principle: This test uses a four-taxon phylogeny ((P1, P2), P3), Outgroup) to detect an excess of shared derived alleles between a non-sister pair (e.g., P2 and P3) [2] [13].
- Method: Count site patterns "ABBA" (shared allele between P2 and P3) and "BABA" (shared allele between P1 and P3). Under no introgression, these are equal. A significant excess of one over the other (calculated as D = (ABBA - BABA) / (ABBA + BABA)) indicates introgression.
- Implementation: Use packages like
Dsuiteto compute D-statistics across the genome.
- Phylogenetic Network Inference:
- Principle: Model evolutionary history as a network rather than a tree, explicitly inferring reticulate events (hybridization/introgression) [13].
- Method: Use software such as PhyloNet or BEAST with network models on the set of inferred gene trees or sequence alignments. This is crucial in systems like rattlesnakes, where rapid diversification and introgression create complex signals [13].
- QuIBL Analysis:
- Principle: This method tests whether a polytomy (unresolved node) is a better explanation for the data than a bifurcating tree with high ILS, which can help distinguish hard polytomies from other sources of conflict [2].
Diagram 2: Analytical Workflow for Diagnosing Discordance
The following flowchart outlines a decision-making process for analyzing gene tree discordance.
Successful phylogenomic research requires a suite of computational tools and resources. The following table details key solutions used in the field.
Table 2: Key research reagents, software, and resources for analyzing gene tree distributions.
| Category | Item/Software | Primary Function | Application in Discordance Research |
|---|---|---|---|
| Phylogenomic Analysis | OrthoFinder | Inference of orthologous groups from sequence data | Creates the core set of genes for multi-locus analysis [2]. |
| IQ-TREE / RAxML | Maximum Likelihood phylogenetic inference | Infers individual gene trees and a concatenated species tree [2]. | |
| ASTRAL | Species tree inference under the MSC | Estimates the species tree from a set of gene trees, accounting for ILS [2]. | |
| Discordance Quantification | IQ-TREE (sCF/gCF) | Calculation of concordance factors | Quantifies the degree and distribution of gene tree discordance around species tree nodes [2]. |
| Introgression Tests | Dsuite | Calculation of D-statistics and related tests | Provides a standardized pipeline for detecting and quantifying introgression from genomic data [13]. |
| PhyloNet | Inference of phylogenetic networks | Models reticulate evolutionary histories (hybridization/introgression) [13]. | |
| Data Visualization | IcyTree | Browser-based tree/network visualization | Rapid visualization of phylogenetic trees and networks, supports various formats [33]. |
| FigTree | Graphical viewer for phylogenetic trees | Produces publication-ready figures of phylogenetic trees [34]. | |
| Empirical Data | Transcriptomic/Genomic Data | Raw sequence data from studied organisms | Serves as the foundational input for all analyses. Studies use datasets of 50+ transcriptomes [2]. |
| Theoretical Framework | Multispecies Coalescent Model | Population-genetic model of lineage sorting | Provides the null model for expected gene tree distributions under ILS [32] [13]. |
The distinction between symmetrical and asymmetrical gene tree distributions is more than a statistical curiosity; it is a fundamental line of evidence for inferring evolutionary history. The symmetric expectation under the neutral multispecies coalescent model provides a powerful null hypothesis. The detection of asymmetry, through methods like concordance factors and D-statistics, serves as a robust indicator that more complex processes—such as introgression or the interaction of selection with demography—are at play. As phylogenomic datasets continue to grow in size and taxonomic breadth, the analytical frameworks and methodologies outlined in this guide will remain essential for researchers aiming to reconstruct the intricate web of life, distinguishing the signals of vertical descent from those of horizontal exchange and adaptive evolution.
Analytical Frameworks: Detecting and Quantifying ILS and Introgression in Genomic Data
In the era of phylogenomics, the analysis of whole-genome data from multiple species has revealed that incongruence among gene trees is not the exception, but the rule. This gene tree heterogeneity arises primarily from two distinct biological processes: incomplete lineage sorting (ILS) and introgression. ILS occurs when ancestral polymorphisms persist through successive speciation events, leading to gene trees that differ from the species tree [35]. Introgression, the transfer of genetic material between species through hybridization, produces similar discordance patterns, creating a significant challenge for accurate inference of evolutionary history [36]. The D-statistic, commonly known as the ABBA-BABA test, was developed specifically to distinguish between these processes by quantifying patterns of allele sharing consistent with introgression [37] [38]. First applied to detect archaic introgression in hominins, this method has since become a cornerstone of phylogenomic analyses across diverse taxonomic groups, from butterflies to pines to geese [37] [39] [38].
Theoretical Foundation and Mathematical Formulation
Core Principles and Evolutionary Scenarios
The D-statistic tests for a deviation from a strict bifurcating evolutionary history by comparing patterns of derived allele sharing among three ingroup populations and an outgroup. The test operates under a defined phylogenetic framework: (((P1, P2), P3), O), where P1 and P2 are sister populations, P3 is a more distantly related ingroup population, and O is the outgroup used to determine ancestral and derived alleles [37] [35]. Under a scenario of pure bifurcating evolution without introgression, discordant gene trees arise solely from ILS, and the two discordant topologies—those grouping P2 with P3 (((P2,P3),P1),O) or P1 with P3 (((P1,P3),P2),O)—are expected to occur with equal frequency [35]. The D-statistic detects violations of this expectation by identifying significant imbalances in allele sharing patterns that signal genetic exchange between populations.
Table 1: Allele Site Patterns and Their Interpretation in the ABBA-BABA Test
| Pattern | Description | P1 Genotype | P2 Genotype | P3 Genotype | Outgroup Genotype | Interpretation |
|---|---|---|---|---|---|---|
| ABBA | Derived allele shared by P2 and P3 | A (ancestral) | B (derived) | B (derived) | A (ancestral) | Supports genealogy ((P2,P3),P1) |
| BABA | Derived allele shared by P1 and P3 | B (derived) | A (ancestral) | B (derived) | A (ancestral) | Supports genealogy ((P1,P3),P2) |
Mathematical Formulation of the D-Statistic
The D-statistic is calculated as the normalized difference between the counts of ABBA and BABA sites across the genome:
D = (ΣABBA - ΣBABA) / (ΣABBA + ΣBABA)
When working with individual genomes (haploid data), ABBA and BABA are simple counts of sites matching each pattern [38]. For population-level data with multiple samples, the calculation incorporates allele frequencies to maximize statistical power [37] [40]. At each SNP, the probabilities of the ABBA and BABA patterns are calculated based on the derived allele frequencies (p) in each population:
- ABBA = (1 - p₁) × p₂ × p₃
- BABA = p₁ × (1 - p₂) × p₃
These values are then summed across all SNPs in the genome to compute the overall D-statistic [37]. A significant deviation from D=0 indicates an excess of shared derived alleles between either P2 and P3 (D > 0) or P1 and P3 (D < 0), providing evidence of introgression between the respective populations [38].
Experimental Implementation and Protocols
Sample Selection and Data Requirements
Proper experimental design is crucial for reliable D-statistic analysis. The method requires genomic data from at least four taxa: three ingroup populations (P1, P2, P3) and an outgroup (O). The outgroup must be sufficiently divergent to polarize ancestral and derived states unambiguously [37] [38]. For population genomic analyses, multiple individuals per population are recommended to estimate allele frequencies accurately. Data quality filters should be applied to remove potentially misleading sites, including those with low sequencing depth, poor mapping quality, or missing data across populations [37]. For the initial test case on Heliconius butterflies, researchers filtered the dataset to include only bi-allelic sites, ensuring clean signal detection [37].
Computational Workflow and Statistical Testing
A standard workflow for D-statistic analysis involves sequential steps from raw genomic data to statistical inference, incorporating rigorous significance testing.
Significance Testing via Block Jackknife: Because adjacent genomic sites are not independent due to linkage disequilibrium, standard parametric tests are inappropriate for assessing the significance of the D-statistic. Instead, a block jackknife procedure is employed, which divides the genome into multiple independent blocks (typically 1 Mb each) and systematically recalculates D while excluding each block in turn [37]. This approach accounts for genomic autocorrelation and provides a valid estimate of the standard error. The resulting Z-score is calculated as:
Z = D / SE(D)
where SE(D) is the standard error estimated from the jackknife pseudovalues. A |Z| > 3 is generally considered statistically significant, corresponding to a p-value < 0.003 under asymptotic normality [37] [38].
Advanced Extensions: The D Frequency Spectrum (DFS)
Recent methodological advances have extended the basic D-statistic framework to incorporate allele frequency information more comprehensively. The D Frequency Spectrum (DFS) partitions the D-statistic by the frequencies of derived alleles in populations P1 and P2, revealing how the signal of introgression varies across allele frequency classes [40]. This approach can help distinguish recent from ancient introgression, as recent gene flow typically produces a strong signal among low-frequency derived alleles, while ancient introgression shows a more dispersed pattern across frequency classes [40]. DFS analysis can be particularly valuable for identifying potential confounding factors, such as ancestral population structure, which may produce distinctive frequency patterns different from those expected under genuine introgression.
Table 2: Interpretation of D Frequency Spectrum (DFS) Patterns
| DFS Pattern | Biological Interpretation | Key Characteristics |
|---|---|---|
| Low-Frequency Peak | Recent introgression | Strong positive D in low-frequency bins |
| Dispersed Signal | Intermediate-age introgression | Signal spread across multiple frequency bins |
| High-Frequency Signal | Ancient introgression | Signal concentrated in high-frequency/fixed bins |
| Inverted High-Frequency | Recent introgression with ILS | Negative D in high-frequency bins despite overall positive D |
Case Studies in Empirical Research
The D-statistic has been successfully applied across diverse taxonomic groups to address evolutionary questions. In Heliconius butterflies, researchers used the D-statistic to test for introgression between H. melpomene rosina (P2) and H. cydno chioneus (P3), with H. melpomene melpomene (P1) as the control. The analysis revealed a significantly positive D-statistic, indicating excess allele sharing between the sympatric species consistent with adaptive introgression of wing patterning loci [37]. In true geese (Branta spp.), the D-statistic detected significant introgression between Cackling Goose (B. hutchinsii) and Canada Goose (B. canadensis), corroborating known hybrid zones between these taxa [38]. Similarly, in pine trees (Pinus massoniana and P. hwangshanensis), D-statistic analyses helped demonstrate that shared nuclear genetic variation resulted from secondary introgression rather than ILS, with supporting evidence from ecological niche modeling [39].
Limitations and Methodological Considerations
Despite its widespread utility, the D-statistic has several important limitations that researchers must consider. A significant D-statistic does not automatically confirm introgression, as other evolutionary processes can produce similar signals. Ancestral population structure can create allele sharing patterns that mimic introgression, particularly when subpopulations with different relationships persist through speciation events [35] [40]. Selection can also confound results if it differentially affects allele frequencies in the studied populations, though the genome-wide nature of the test provides some robustness against this concern [35]. Additionally, the D-statistic cannot detect introgression that occurred equally between all populations or introgression between sister taxa P1 and P2. The method is also sensitive to the choice of outgroup, which must truly represent the ancestral state to avoid mispolarization of alleles [38] [35]. Finally, the D-statistic provides evidence for the presence of introgression but offers limited information about its timing, directionality, or genomic extent without additional complementary analyses [40].
Table 3: Essential Research Reagents and Computational Tools for D-Statistic Analysis
| Resource Type | Specific Tool/Resource | Primary Function | Key Features |
|---|---|---|---|
| Data Processing | freq.py from genomics_general |
Allele frequency calculation | Processes genotype files, computes derived allele frequencies |
| Statistical Analysis | R with custom scripts | D-statistic computation & jackknife | Flexible statistical testing and visualization capabilities |
| Simulation Framework | dfs package (Simon Martin) |
Explore DFS parameter space | Simulates allele frequency spectra under various introgression scenarios |
| Data Visualization | D3.js | Interactive frequency spectra plots | Creates publication-quality visualizations of DFS patterns |
The D-statistic remains a fundamental tool in the phylogenomics toolkit, providing a powerful and computationally efficient method for detecting introgression from genome-scale data. Its simplicity and intuitive interpretation have contributed to its widespread adoption across evolutionary biology. When applied with appropriate care to its assumptions and limitations, and when complemented with additional analyses such as the D Frequency Spectrum and model-based approaches, the ABBA-BABA test offers robust insights into the pervasive role of introgression in evolution. As genomic datasets continue to grow in size and taxonomic breadth, the D-statistic will undoubtedly remain a critical first step in exploring the complex tapestry of evolutionary history shaped by both vertical descent and horizontal gene flow.
The estimation of species phylogenies from molecular sequence data is a cornerstone of evolutionary biology, yet it is confounded by the frequent observation that gene trees inferred from different loci can have conflicting topologies [41]. This gene tree discordance can arise from several biological processes, including incomplete lineage sorting (ILS), hybridization/introgression, and gene duplication and loss [42] [43]. This technical guide focuses on the challenge of ILS, which is modeled by the multi-species coalescent (MSC) model [41] [43]. ILS occurs when the coalescence of gene lineages in an ancestral population predates a speciation event, causing the gene tree topology to differ from the species tree topology. This phenomenon is particularly common during rapid radiations, where short internal branches on the species tree increase the probability of deep coalescence [44].
Within the context of a broader thesis researching the causes of gene tree discordance, distinguishing between ILS and introgression is critical. While hybridization produces discordance patterns that are best modeled by phylogenetic networks, ILS is consistent with a tree-like species phylogeny, making the MSC model an appropriate statistical framework [41]. A number of coalescent-based species tree estimation methods have been developed that are statistically consistent under the MSC model, meaning that as the number of genes increases, the estimated species tree topology converges in probability to the true topology [45] [46]. Among these, ASTRAL (Accurate Species TRee ALgorithm) and MP-EST are two leading summary methods that balance computational feasibility with high accuracy, enabling their application to genome-scale datasets with hundreds to thousands of genes [45] [46]. This whitepaper provides an in-depth technical guide to these two methods, detailing their theoretical foundations, methodological approaches, performance characteristics, and practical application.
Theoretical Foundation: The Multi-Species Coalescent Model
The multi-species coalescent (MSC) model provides a population-genetic framework for describing the evolution of individual genes within a population-level species tree [41] [43]. The model takes as input a species tree (\mathcal{T} = (T,\Theta)) with topology (T) and branch lengths (\Theta) (in coalescent units) on a set of (n) taxa, (\mathcal{X} = {xi}{i=1}^n). This species tree parameterizes a probability density function for a random variable (G(\mathcal{T})) defined over all possible gene trees on (\mathcal{X}) [41].
The process of generating a random gene tree under the MSC occurs backwards in time. As lineages grow backward, they enter common populations at speciation events. Within a common population, distinct lineages can coalesce (join into a common ancestor) according to a Poisson process. For a population with (k) distinct lineages, the time until the next coalescent event is exponentially distributed with a rate of (\binom{k}{2} \lambda), where (\lambda) is the hazard rate [41]. The MSC model provides the probabilities for different gene tree topologies and coalescence times given the species tree. A key insight is that for a three-taxon species tree, the most probable gene tree topology matches the species tree, a property that underpins the statistical consistency of triplet-based methods like MP-EST and STELAR [46]. Similarly, for a four-taxon species tree, there is no "anomalous zone" for unrooted topologies, meaning the most probable unrooted quartet tree matches the unrooted species tree, which is foundational for quartet-based methods like ASTRAL [44] [46].
Methodological Approaches
ASTRAL: Quartet Aggregation for Species Tree Estimation
ASTRAL is a fast, statistically consistent method for estimating species trees from a set of unrooted gene trees by maximizing quartet agreement [45] [44]. Its optimization problem is formalized as the Maximum Quartet Support Species Tree (MQSST) problem.
- Input: A set of unrooted gene trees, each leaf-labelled by species set (S), and a set (X) of bipartitions on (S) that constrains the search space.
- Output: A tree (T) on species set (S) that draws its bipartitions from (X) and maximizes the sum of the weights of all quartet trees induced by (T), where the weight of a quartet (q) is the number of gene trees in the input that induce quartet topology (q) [44].
ASTRAL uses a dynamic programming (DP) algorithm to solve the MQSST problem efficiently without explicitly enumerating all possible quartets. The DP approach relies on calculating a score for tripartitions (a node in an unrooted tree defines three disjoint leaf subsets) derived from the set of allowed bipartitions (X). The score for a tripartition represents the number of quartet trees from the input gene trees that would be satisfied by any species tree containing that tripartition. The recursion finds the optimal way to combine smaller subtrees into larger ones based on these scores [44]. The default heuristic version of ASTRAL sets (X) to be all bipartitions from the input gene trees, which greatly reduces the search space and enables analysis of large datasets (up to 1000 species and 1000 genes) in polynomial time [44] [47].
MP-EST: Pseudo-likelihood Based on Rooted Triplets
MP-EST (Maximum Pseudo-likelihood Estimate of Species Tree) is a statistically consistent method that estimates the species tree from a collection of rooted gene trees using a pseudo-likelihood framework based on rooted triplets [43] [46]. The method leverages the property that under the MSC, for any three species, the probability of the dominant gene tree triplet matching the species tree triplet is higher than the probabilities of the two alternative topologies, which are equal to each other [46].
The MP-EST method operates by:
- Input: A collection of rooted gene trees.
- Pseudo-likelihood Calculation: For each possible three-taxon set in the species tree, MP-EST calculates the likelihood of the species tree triplet from the frequencies of the three possible gene tree topologies observed in the input data. This calculation uses the MSC probabilities for triplets, which are functions of the species tree branch lengths (in coalescent units).
- Species Tree Estimation: The overall pseudo-likelihood of a candidate species tree is the product of the likelihoods across all possible triplets. MP-EST searches for the species tree topology and branch lengths that maximize this pseudo-likelihood function [43] [46].
Unlike ASTRAL, MP-EST requires rooted gene trees as input. While MP-EST has been widely used and is statistically consistent, it can be computationally intensive for very large numbers of taxa (e.g., hundreds of species) and its performance can degrade under some conditions of high ILS or gene tree estimation error [45] [46].
Performance Comparison and Experimental Evaluation
Accuracy and Scalability
Extensive simulation studies have evaluated the performance of ASTRAL and MP-EST under a wide range of conditions, including varying levels of ILS, gene tree estimation error, numbers of genes and taxa, and patterns of missing data.
Table 1: Comparative Performance of ASTRAL and MP-EST
| Criterion | ASTRAL | MP-EST |
|---|---|---|
| Theoretical Basis | Quartet aggregation from unrooted gene trees [45] [44] | Pseudo-likelihood estimation from rooted gene trees [46] |
| Statistical Consistency | Yes (under MSC) [45] | Yes (under MSC) [46] |
| Scalability | Highly scalable; polynomial time; handles thousands of genes and up to 1000 species [44] [47] | Less scalable; struggles with hundreds of species [46] |
| Input Requirements | Unrooted gene trees | Rooted gene trees |
| Handling of Anomaly Zone | Robust (no anomaly zone for unrooted 4-taxon trees) [44] | Robust (no anomaly zone for rooted 3-taxon trees) [46] |
| Relative Accuracy | Outstanding accuracy; often more accurate than MP-EST and concatenation under moderate-to-high ILS [45] | High accuracy, but generally less accurate than ASTRAL under many simulated conditions [45] [46] |
| Impact of Missing Data | Statistically consistent under some taxon deletion models; maintains high accuracy even with substantial missing data [41] | Performance can be affected by missing data, though coalescent-based methods generally improve with more genes [41] |
Performance Under Missing Data
The statistical consistency of coalescent-based species tree methods has been established under the assumption that every gene is present in every species. However, in real-world phylogenomic datasets, missing data is common due to gene loss, incomplete sequencing, or assembly issues. Research has established that methods like ASTRAL remain statistically consistent under certain models of taxon deletion, such as the i.i.d. model (Miid) where each species is missing from each gene with the same probability, and the full subset coverage model (Mfsc) [41]. Empirical results show that ASTRAL, ASTRID, MP-EST, and SVDquartets all improve in accuracy as the number of genes increases and can produce highly accurate species trees even when the amount of missing data is large [41].
Table 2: Performance Under Different Model Conditions
| Model Condition | Effect on Species Tree Estimation | Performance of ASTRAL & MP-EST |
|---|---|---|
| Low ILS | Gene tree conflict is minimal; concatenation often performs well [45] | ASTRAL is less accurate than concatenation; MP-EST also less accurate [45] |
| Moderate-to-High ILS | High levels of gene tree conflict challenge concatenation [44] | ASTRAL is more accurate than concatenation and MP-EST [45] [44] |
| High Gene Tree Estimation Error | Incorrect gene trees due to limited phylogenetic signal or short sequence lengths [41] | All summary methods decline in accuracy, but ASTRAL often shows greater resilience [41] |
| Large Taxa Sets (500-1000) | Computational burden increases [47] | ASTRAL-II handles 1000 taxa and genes; MP-EST struggles with hundreds of taxa [47] [46] |
| * Substantial Missing Data* | Incomplete gene matrices [41] | Methods remain accurate with large amounts of missing data given sufficient genes [41] |
Experimental Protocols for Performance Evaluation
The performance characteristics of ASTRAL and MP-EST summarized in this guide are derived from rigorous simulation studies. A standard protocol for such evaluations involves the following steps:
- Species Tree Simulation: Species trees are typically generated under a birth-death or Yule process using tools like SimPhy [47]. Parameters such as the number of taxa, tree height (in generations), and speciation rate are varied to create different model conditions, including varying levels of ILS. For example, shorter tree lengths or larger population sizes generally produce higher levels of ILS [47].
- Gene Tree Simulation: For each replicate species tree, a set of gene trees is simulated under the multi-species coalescent model using the species tree as the parameter. The population size is often fixed (e.g., 200,000) across the tree [47]. Tools like SimPhy or MS can perform this step.
- Sequence Simulation: Nucleotide sequences are evolved along each simulated gene tree using a substitution model (e.g., GTR+Γ) with tools like Indelible [47]. Sequence length can be fixed or drawn from a distribution (e.g., log-normal with mean between 300bp and 1500bp) to vary the phylogenetic signal and induce gene tree estimation error [47].
- Gene Tree Estimation: For each simulated sequence alignment, gene trees are estimated using phylogenetic methods such as RAxML (for maximum likelihood) or FastTree [48] [47]. This step introduces gene tree estimation error, making the experiment more realistic.
- Species Tree Inference: The estimated gene trees are used as input to ASTRAL, MP-EST, and other comparison methods. The resulting species tree estimates are compared to the true simulated species tree using metrics like Robinson-Foulds (RF) distance to quantify accuracy [45] [47].
Table 3: Key Software Tools and Datasets for Coalescent-Based Species Tree Estimation
| Resource Name | Type | Function/Description | Access |
|---|---|---|---|
| ASTRAL | Software | Infers species tree from unrooted gene trees by quartet aggregation [45] | https://github.com/smirarab/ASTRAL/ |
| MP-EST | Software | Infers species tree from rooted gene trees using a pseudo-likelihood based on triplets [46] | Available from authors |
| STELAR | Software | Infers species tree by maximizing triplet agreement; an alternative to MP-EST [46] | Available from authors |
| SimPhy | Software | Simulates species trees and gene trees under the multi-species coalescent model [47] | https://github.com/adamallo/SimPhy |
| Indelible | Software | Simulates nucleotide or amino acid sequence evolution along phylogenetic trees [47] | Included in PHAST package |
| ASTRAL Biological & Simulated Datasets | Data | Includes gene trees, species trees, and sequence data for validation and benchmarking [48] | Datasets [45] |
| RAxML | Software | Infers maximum likelihood phylogenetic trees from molecular sequences; used for gene tree estimation [48] | https://github.com/amkozlov/raxml-ng |
| FastTree | Software | Infers approximate maximum-likelihood phylogenetic trees; faster for large datasets [47] | http://www.microbesonline.org/fasttree/ |
ASTRAL and MP-EST represent two powerful and statistically consistent approaches for estimating species trees in the presence of gene tree discordance caused by incomplete lineage sorting. ASTRAL, based on quartet aggregation from unrooted gene trees, offers superior scalability and often better accuracy under a wide range of conditions, particularly with high ILS. MP-EST, based on a pseudo-likelihood function of rooted triplets, has been a widely used and influential method but is less scalable to very large numbers of taxa. Both methods have been shown to be robust to substantial amounts of missing data, making them suitable for real-world phylogenomic analyses where complete data matrices are the exception rather than the rule.
When selecting a method for a given study, researchers must consider factors such as the number of taxa, the availability of reliable root information for gene trees, computational resources, and the expected level of ILS. The ongoing development and refinement of coalescent-based methods, including the emergence of new approaches like STELAR [46], continue to enhance our ability to infer accurate species trees from genome-scale data, thereby providing a solid phylogenetic foundation for investigating evolutionary patterns and processes.
In the field of evolutionary biology, the reconstruction of species relationships has traditionally relied on phylogenetic trees. However, the increasing analysis of whole-genome and multi-locus datasets has revealed widespread gene tree discordance—incongruence between evolutionary histories of different genes—that cannot be adequately represented by tree-like models. This discordance arises primarily from two biological phenomena: incomplete lineage sorting (ILS), the retention of ancestral genetic polymorphisms through successive speciation events, and reticulate evolution including hybridization, introgression, and horizontal gene transfer [49] [29]. Disentangling the contributions of ILS versus introgression to gene tree discordance represents a significant challenge and a central focus in modern phylogenomics [2] [4].
PhyloNet was developed specifically to address this challenge by enabling the representation and analysis of reticulate evolutionary relationships. As a software package for analyzing phylogenetic networks, PhyloNet provides researchers with statistical frameworks to infer evolutionary histories that account for both ILS and gene flow [49] [50]. This technical guide examines PhyloNet's methodologies within the context of discriminating between ILS and introgression, detailing its analytical approaches, implementation protocols, and applications in current phylogenomic research.
Theoretical Framework: Phylogenetic Networks, ILS, and Introgression
The Multispecies Network Coalescent Model
PhyloNet operates under the Multispecies Network Coalescent (MSNC) model, which extends the multispecies coalescent to account for both ILS and reticulation [49] [51]. The MSNC model represents a species phylogeny as a rooted, directed, acyclic graph where nodes with multiple parents (reticulation nodes) capture hybridization or introgression events. Within this network, gene trees evolve according to the coalescent process along each lineage, with specific probabilities of inheritance at reticulation points [49].
Table 1: Key Concepts in Phylogenetic Network Inference
| Concept | Mathematical Representation | Biological Interpretation |
|---|---|---|
| Reticulation Node | Node with in-degree ≥ 2 | Represents hybridization or introgression events |
| Inheritance Probability (γ) | Continuous parameter (0-1) | Proportion of genetic material inherited from a specific parent at a reticulation |
| Coalescent Unit | Branch length parameter | Measure of evolutionary time incorporating population size and divergence time |
| Extra Lineages | Integer count per branch | Number of gene lineages failing to coalesce within a branch, indicating ILS |
Distinguishing ILS from Introgression
The fundamental challenge in phylogenomics lies in distinguishing patterns of gene tree discordance caused by ILS versus those resulting from introgression. ILS produces discordance that is largely random across the genome and proportional to population size and divergence times, while introgression creates discordance that is often localized to specific genomic regions and reflects historical gene flow events [2] [4] [29]. PhyloNet implements multiple statistical frameworks to differentiate these processes by comparing the fit of network models with different reticulation scenarios against null models without gene flow.
PhyloNet Methodologies and Implementation
Core Inference Methods
PhyloNet provides three principal inference approaches, each with distinct strengths for addressing ILS and introgestion [49].
Maximum Parsimony (InferNetwork_MP) extends the "minimizing deep coalescences" criterion to phylogenetic networks. This method seeks the species network that minimizes the number of extra lineages across all gene trees, using only gene tree topologies without branch length information. While computationally efficient, it does not estimate branch lengths or inheritance probabilities and is statistically inconsistent for certain network topologies with short branches [49].
Maximum Likelihood (InferNetwork_ML) implements full likelihood-based inference under the MSNC model. This approach estimates network topology, branch lengths (in coalescent units), and inheritance probabilities simultaneously. It can utilize both gene tree topologies and branch lengths, providing statistically consistent estimation under the model. However, likelihood computation presents significant computational challenges for complex networks [49].
Bayesian Inference (MCMC_BiMarkers) samples from the posterior distribution of networks using Markov Chain Monte Carlo algorithms. This approach naturally incorporates parameter uncertainty, avoids overfitting through model complexity penalties, and enables direct probability statements about network features. Recent implementations analyze biallelic markers directly, integrating over all possible gene trees rather than relying on estimated gene trees [51].
Table 2: Comparison of PhyloNet Inference Methods
| Method | Input Data | Statistical Framework | Output Parameters | Computational Complexity |
|---|---|---|---|---|
| InferNetwork_MP | Gene tree topologies | Maximum Parsimony (MDC) | Topology, inheritance probabilities | Moderate |
| InferNetwork_ML | Gene trees (with or without branch lengths) | Maximum Likelihood | Topology, branch lengths, inheritance probabilities | High |
| MCMC_BiMarkers | Biallelic markers (SNPs) | Bayesian | Posterior distributions of all parameters | Very High |
Workflow for Discriminating ILS vs. Introgression
The following diagram illustrates a comprehensive workflow for analyzing ILS and introgression using PhyloNet:
Experimental Protocol for Network Inference
For researchers investigating ILS and introgression, the following protocol outlines a standard analysis using PhyloNet:
Step 1: Data Preparation and Gene Tree Estimation
- Obtain sequence alignments for multiple unlinked loci across all study taxa
- Estimate gene trees for each locus using preferred phylogenetic methods (e.g., RAxML, MrBayes)
- Format gene trees in Newick format with consistent taxon naming
- For Bayesian methods, prepare biallelic marker data in appropriate formats
Step 2: Initial Network Inference
- Select appropriate inference method based on data size and complexity:
- For rapid exploration: Use
InferNetwork_MPwith increasing reticulation counts - For parameter estimation: Use
InferNetwork_MLwith branch length optimization - For full uncertainty quantification: Use
MCMC_BiMarkerswith appropriate chain lengths
- For rapid exploration: Use
- Specify maximum number of reticulations based on biological knowledge
- Run analyses with multiple replicates to check consistency
Step 3: Statistical Testing for Introgression
- Implement D-statistics (ABBA-BABA tests) to test for asymmetry in allele patterns
- Apply QuIBL (Quantitative Introgression Branch Length) to estimate timing and strength of introgression
- Use PhyloNet's built-in functions for pseudolikelihood comparison of network topologies
Step 4: Model Comparison and Validation
- Compare networks with different numbers of reticulations using information criteria (AIC, BIC)
- Perform cross-validation to assess model fit and prevent overfitting
- Implement bootstrap analysis to evaluate support for inferred reticulations
- Compare network likelihoods against species tree models to test if reticulations significantly improve fit
Step 5: Interpretation and Visualization
- Annotate networks with branch lengths and inheritance probabilities
- Map introgression events onto geographical and temporal frameworks
- Identify genomic regions contributing to discordance patterns
- Interpret ILS regions in context of effective population sizes and divergence times
Case Studies in Phylogenomics
Tribe Tulipeae (Liliaceae) Radiation
A recent phylogenomic study of Tulipa and related genera exemplifies the application of PhyloNet to discriminate ILS from introgression. Researchers analyzed 50 newly sequenced transcriptomes plus 15 published transcriptomes, constructing both plastid (74 protein-coding genes) and nuclear (2,594 orthologous genes) datasets [2]. Despite extensive data, the evolutionary history among Amana, Erythronium, and Tulipa remained unresolved due to pervasive ILS and reticulate evolution. PhyloNet analyses revealed that both processes contributed significantly to discordance, with evidence of pre-speciation introgression complicating phylogenetic reconstruction [2].
Asian Warty Newts Adaptive Radiation
Research on Paramesotriton newts demonstrated extensive gene tree discordance attributed primarily to ILS, supplemented by pre-speciation introgression events. The study integrated restriction-site associated DNA sequencing with mitochondrial genomes, applying ASTRAL, HyDe, Dsuite, and PhyloNet to disentangle these processes [4]. The analysis revealed a hybrid origin for P. zhijinensis and hybridization between P. longliensis and an unidentified Paramesotriton lineage, illustrating how PhyloNet can identify specific hybridization events against a background of ILS [4].
Gossypium Genus Evolution
Analysis of 25 Gossypium genomes, including four novel assemblies, revealed widespread ILS and introgression shaping cotton evolution [29]. Researchers constructed a detailed ILS map for a rapidly diverged lineage containing G. davidsonii, G. klotzschianum, and G. raimondii, finding non-random distribution of ILS regions across the genome. Approximately 15.74% of speciation structural variation genes and 12.04% of speciation-associated genes intersected with ILS signatures, demonstrating the role of ILS in adaptive radiation [29].
The Scientist's Toolkit: Research Reagent Solutions
Table 3: Essential Tools for Phylogenetic Network Analysis
| Tool/Resource | Function | Application Context |
|---|---|---|
| PhyloNet Software Package | Phylogenetic network inference and analysis | Primary platform for all network-based analyses |
| Dendroscope | Network visualization and manipulation | Visualizing networks in extended Newick format |
| ASTRAL | Species tree estimation under ILS | Establishing baseline species tree for comparison |
| Dsuite | D-statistics and f-branch analysis | Testing for introgression and estimating admixture proportions |
| HyDe | Hypothesis testing for hybridization | Detecting hybrid taxa and estimating parental contributions |
| BEAST2 | Bayesian evolutionary analysis | Co-estimation of gene trees and species networks |
| SNaQ | Pseudolikelihood network estimation | Rapid inference of larger networks |
Advanced Visualization and Interpretation
Effective visualization is crucial for interpreting complex phylogenetic networks. The following diagram illustrates the key components of a phylogenetic network and how it represents evolutionary relationships:
Future Directions and Computational Considerations
Recent advances in phylogenetic network inference have focused on improving computational efficiency and scaling to larger datasets. The SnappNet method extends the Snapp approach to networks, using novel algorithms that are exponentially more time-efficient than previous implementations [51]. This is particularly valuable for analyzing large genomic datasets where traditional methods face computational limitations.
Future development priorities include:
- Integration of network inference with demographic history reconstruction
- Development of methods for detecting introgression from genomic windows without pre-defined species assignments
- Improved visualization tools for large networks with complex metadata annotations
- Machine learning approaches to identify patterns of ILS and introgression in phylogenomic datasets
As phylogenetic network methods continue to evolve, they offer increasingly powerful approaches for unraveling the complex interplay of vertical and horizontal inheritance that shapes evolutionary history. PhyloNet remains at the forefront of these developments, providing researchers with robust statistical frameworks to discriminate between incomplete lineage sorting and introgression in genomic data.
Site Concordance Analysis has emerged as a critical methodology in phylogenomics for quantifying the evolutionary signal within genomic datasets. In the context of resolving complex phylogenetic relationships, researchers often encounter significant gene tree discordance—the phenomenon where individual genes tell different evolutionary stories. This discordance primarily arises from two key biological processes: incomplete lineage sorting (ILS), where ancestral genetic polymorphisms fail to coalesce in the immediate ancestor of species, and introgression, involving the transfer of genetic material between separately evolving lineages through hybridization. Site concordance analysis provides powerful tools to measure, visualize, and interpret this discordance, enabling researchers to distinguish between these competing evolutionary scenarios and reconstruct more accurate species trees.
The cornerstone metrics of this approach are the site concordance factor (sCF) and site discordance factor (sDF), which quantify the percentage of decisive alignment sites supporting or conflicting with a particular branch in a reference phylogeny. Unlike gene concordance factors that operate at the level of entire gene trees, site-based metrics leverage information from all informative sites across the genome, making them particularly valuable when analyzing datasets with short gene sequences or extensive evolutionary conflicts. This technical guide explores the theoretical foundations, calculation methodologies, and practical applications of sCF and sDF analyses, providing researchers with a comprehensive framework for implementing these powerful techniques in their phylogenomic investigations.
Core Concepts and Definitions
Site Concordance Factor (sCF)
The site concordance factor (sCF) represents the percentage of phylogenetically informative ("decisive") alignment sites that support a specific branch in a given reference tree [52]. For a particular internal branch defining a split between two sets of taxa, the sCF is calculated by examining sets of four taxa (quartets) that include two taxa from each side of the split. A site is considered "decisive" for a branch when it supports one of the three possible topologies for the quartet and "concordant" when it supports the topology present in the reference tree [53].
The original sCF calculation method used parsimony-based criteria applied to quartets of tip taxa [53]. However, this approach proved susceptible to homoplasy (convergent evolution), particularly when analyzing distantly related taxa or fast-evolving sequences [53]. An updated likelihood-based method has since been developed that samples from probability distributions of ancestral states at internal nodes adjacent to the branch of interest, substantially reducing the confounding effects of homoplasy while maintaining computational efficiency [53].
Site Discordance Factor (sDF)
The site discordance factor (sDF) represents the percentage of decisive alignment sites that support alternative topologies conflicting with the reference tree [52]. For any branch in the phylogeny, there are two possible discordant topologies, typically labeled as sDF1 and sDF2. These three values—sCF, sDF1, and sDF2—necessarily sum to 100% for each branch, as every decisive site must support one of the three possible quartet resolutions [52].
The distribution of these three values provides crucial insights into evolutionary processes. When sCF significantly exceeds both sDF values, this indicates strong support for the reference topology. When sDF1 and sDF2 are roughly equal and substantially greater than zero, it suggests the presence of incomplete lineage sorting. When one sDF value is markedly higher than the other, this may indicate introgression between specific lineages or other asymmetric evolutionary processes.
Relationship to Other Phylogenetic Measures
Site concordance factors complement but are distinct from other common phylogenetic support measures:
Table: Comparison of Phylogenetic Support Measures
| Measure | Basis of Calculation | What It Quantifies | Typical Interpretation |
|---|---|---|---|
| sCF/sDF | Proportion of informative sites supporting/conflicting with a branch | Underlying signal in the raw data | High sCF indicates strong phylogenetic signal; sDF distribution reveals conflict patterns |
| Gene Concordance Factor (gCF) | Proportion of gene trees containing a branch | Resolution in individual locus trees | Low gCF indicates gene tree discordance due to ILS or estimation error |
| Bootstrap Support | Resampling of sites or genes | Sampling variance/support stability | High bootstrap indicates low sampling variance |
| Posterior Probability | Bayesian model-based sampling | Probability of a branch given model and data | High posterior probability indicates strong model-based support |
Notably, bootstrap values can reach 100% in large datasets even when sCF values are modest (e.g., 37%), highlighting their different interpretations: bootstraps measure sampling variance, while sCF measures the actual distribution of phylogenetic signal in the data [52].
Methodological Framework
Calculation Workflows
The standard workflow for calculating site concordance factors involves three key stages, typically implemented in the IQ-TREE software package [52] [53]:
Stage 1: Reference Tree Estimation
- Perform maximum likelihood analysis on a concatenated alignment
- Generate a reference species tree that will serve as the framework for concordance factor calculation
- This tree represents the best-estimate phylogeny based on the total evidence
Stage 2: Locus Tree Estimation (for gCF)
- Estimate individual trees for each locus or gene alignment
- These gene trees capture the phylogenetic signal present in individual genomic regions
- Shorter loci typically produce noisier gene trees with lower resolution
Stage 3: Concordance Factor Calculation
- For each branch in the reference tree, calculate sCF and sDF values by analyzing site patterns
- The updated method uses likelihood-derived ancestral state probabilities at internal nodes
- Results are output in multiple formats for visualization and further analysis
The following workflow diagram illustrates this process and the key relationships between analysis components:
Updated Likelihood-Based Method
The updated method for calculating sCF addresses significant limitations of the original parsimony-based approach [53]:
Ancestral State Probability Sampling: Instead of sampling observed states from tip taxa, the updated method uses likelihood to generate probability distributions of ancestral states at internal nodes adjacent to the branch of interest.
Reduced Homoplasy Sensitivity: By focusing on internal nodes rather than distantly related tips, the method minimizes artifacts caused by multiple substitutions at the same site.
Improved Taxon Sampling Robustness: The updated approach is less affected by the addition of distantly related taxa, which previously artificially depressed sCF values due to increased homoplasy.
Simulation studies demonstrate that while the original sCF calculation could decline from ~98% to below 80% with the addition of 20 distant taxa, the updated method maintains values above 95% under the same conditions [53].
Implementation in IQ-TREE
The calculation of concordance factors is implemented in IQ-TREE, with the updated likelihood-based method available from version 2.2.2 onward [53]. The software provides:
- Efficient computation for large phylogenomic datasets
- Support for both nucleotide and amino acid sequence data
- Multiple output formats for visualization in tree viewers and further statistical analysis
- Integration with other IQ-TREE features for comprehensive phylogenomic inference
Practical Application and Interpretation
Case Study: Avian Phylogenomics
A landmark application of site concordance analysis examined 88 loci (137,324 sites) across 235 bird species [52]. This study revealed critical patterns that would be obscured by traditional support measures:
Table: Concordance Factors in Avian Phylogeny
| Branch Description | Bootstrap Support | gCF | sCF | sDF1 | sDF2 | Biological Interpretation |
|---|---|---|---|---|---|---|
| Penguin-tubenose split | 100% | 1.15% | 37.34% | 30% | 33% | Strong concatenated signal but extensive gene tree discordance |
| Typical high-support branch | 100% | >50% | >70% | <20% | <20% | Consistent signal across measures |
| Anomalous zone branch | High | Low | Intermediate | Variable | Variable | Potential ILS or estimation error |
The penguin-tubenose split exemplifies a common pattern in phylogenomics: 100% bootstrap support coexisting with a low sCF (~37%) and extremely low gCF (~1%) [52]. This combination indicates that while the concatenated analysis strongly supports this split (low sampling variance), the underlying genomic data contain substantial conflicting signal. The roughly equal sDF values (30% and 33%) suggest incomplete lineage sorting rather than introgression as the primary cause of discordance.
Case Study: Eucalyptus Phylogenomics
Research on Eucalyptus subgenus Eudesmia utilizing a custom target-capture bait set (568 genes) revealed "extreme gene tree discordance at deeper nodes" despite clear species groupings [9]. Site concordance analysis identified widespread discordance patterns consistent with both incomplete lineage sorting and hybridization/introgression. Filtering strategies (removing genes or samples) failed to reduce conflict at key nodes, supporting a biological rather than analytical explanation for the observed discordance [9].
Case Study: Liliaceae Tribe Tulipeae
A recent transcriptome-based study of Tulipa and related genera calculated "site con/discordance factors (sCF and sDF1/sDF2)" to identify nodes with high or imbalanced discordance [2]. These metrics guided subsequent phylogenetic network analyses and polytomy tests to distinguish between ILS and reticulate evolution. The research found "especially pervasive ILS and reticulate evolution" among Amana, Erythronium, and Tulipa genera, demonstrating how sCF/sDF analyses can pinpoint evolutionary radiations complicated by both sorting and introgression events [2].
Distinguishing Evolutionary Processes
Diagnostic Patterns
Site concordance factors provide distinctive signatures that help discriminate between major sources of gene tree discordance:
Incomplete Lineage Sorting (ILS)
- sCF is moderately reduced (often 30-60%)
- sDF1 and sDF2 values are roughly balanced
- Pattern is consistent across multiple branches, especially in rapid radiations
- Example: The bird dataset showed sCF ~37% with sDF1 ~30% and sDF2 ~33% [52]
Introgression/Hybridization
- sCF is significantly reduced on specific branches
- One sDF value is substantially elevated compared to the other
- Pattern is localized to specific phylogenetic splits
- Example: Eucalyptus studies identified branches with imbalanced sDF values suggesting introgression [9]
Gene Tree Estimation Error
- sCF is low while gCF is very low or zero
- sCF substantially exceeds gCF
- Pattern is associated with short branches and limited informative sites
- Example: Short internal branches in bird phylogeny showed gCF ~1% but sCF ~37% [52]
The following decision framework illustrates how to interpret sCF/sDF patterns in biological context:
Complementary Analysis Methods
Site concordance factors are most powerful when integrated with complementary phylogenetic methods:
- D-statistics (ABBA-BABA tests): Detect asymmetric introgression between specific lineages
- Phylogenetic Networks: Visualize and test alternative reticulate evolutionary scenarios
- Multi-species Coalescent Methods: Explicitly model ILS while estimating species trees
- Polytomy Tests: Distinguish hard polytomies from unresolved bifurcating relationships
The Liliaceae study exemplified this integrated approach, using sCF/sDF to identify problematic nodes, then applying D-statistics and QuIBL to further investigate ILS vs. introgression [2].
Research Toolkit
Table: Essential Resources for Site Concordance Analysis
| Tool/Resource | Function | Application Notes |
|---|---|---|
| IQ-TREE | Phylogenetic inference & concordance factor calculation | Primary software for sCF/sDF calculation; version 2.2.2+ recommended for updated method [53] |
| Custom Bait Sets | Target capture sequencing | Gene set design critical for resolving specific clades (e.g., 568-gene set for Eucalyptus) [9] |
| Transcriptome Sequencing | Gene assembly without whole genomes | Effective for organisms with large genomes (e.g., Tulipa, 32-69 pg) [2] |
| ASTRAL | Species tree estimation under MSC | Handles gene tree discordance from ILS [2] |
| Phylogenetic Network Software | Reticulate evolution visualization | Tests hybridization/introgression scenarios |
| R/phylogenetics packages | Data analysis & visualization | Custom analyses and visualization of concordance factors |
Site concordance analysis represents a fundamental advancement in phylogenomics by providing direct quantification of the phylogenetic signal and conflict inherent in genome-scale datasets. The sCF and sDF metrics empower researchers to move beyond simplistic measures of branch support to more nuanced interpretations of evolutionary history. By distinguishing between incomplete lineage sorting and introgression—two pervasive biological processes that confound traditional phylogenetic methods—site concordance analysis enables more accurate reconstruction of evolutionary relationships and processes.
The ongoing refinement of sCF methodology, particularly the shift from parsimony-based to likelihood-based calculations, continues to enhance the accuracy and biological relevance of these measures. As phylogenomic datasets grow in both size and taxonomic breadth, site concordance factors will remain essential tools for interpreting complex evolutionary histories shaped by the interplay of vertical descent and horizontal exchange.
In phylogenomics, a fundamental challenge is resolving the evolutionary relationships between closely related species or genera that have diverged over short periods of time. A common manifestation of this challenge is gene tree discordance, where evolutionary histories inferred from different genes contradict each other and the presumed species tree. Two primary biological processes are responsible for this phenomenon: Incomplete Lineage Sorting (ILS) and introgression [2].
ILS occurs when ancestral genetic polymorphisms persist through successive speciation events, leading to the random retention of different ancestral alleles in descendant lineages. In contrast, introgression (or reticulate evolution) involves the transfer of genetic material between species via hybridization, resulting in a mosaic genome. Distinguishing between these processes is critical for reconstructing accurate evolutionary histories. This guide details modern phylogenomic methods, with a focus on QuIBL (Quantifying Introgression via Branch Lengths), for testing hypotheses of ILS versus introgression.
Core Concepts and Theoretical Framework
Gene tree discordance arises from several biological and analytical sources [2]:
- Incomplete Lineage Sorting (ILS): The failure of two or more lineages to coalesce in the ancestral population, leading to the random sorting of ancestral polymorphisms.
- Introgression: The transfer of genetic material from one species to another through hybridization and backcrossing.
- Other Factors: These include errors in gene tree estimation (often due to limited phylogenetic signal) and, more rarely, de novo gene duplications.
The Multi-Species Coalescent Model
The Multi-Species Coalescent (MSC) model provides a statistical framework for understanding how gene trees are embedded within a species tree. It explicitly models ILS, thereby allowing researchers to test whether observed levels of gene tree discordance are consistent with a pure ILS expectation or if additional processes like introgression must be invoked. Methods based on the MSC, such as ASTRAL, are used to infer a primary species tree while accounting for ILS [2].
Quantitative Methods and Test Statistics
Researchers employ a suite of quantitative metrics to diagnose and quantify discordance.
Table 1: Key Quantitative Methods for Testing ILS vs. Introgression
| Method | Full Name | Primary Use | Key Output(s) | Underlying Principle |
|---|---|---|---|---|
| QuIBL | Quantifying Introgression via Branch Lengths | Test for presence of introgression | Distribution of branch length estimates; likelihood scores | Compares branch lengths in alternative phylogenetic networks; introgression predicts shorter internal branches in introgressed trees [2]. |
| D-statistics (ABBA-BABA) | Patterson's D | Test for allele-sharing asymmetry | D-statistic, Z-score, p-value | Detects an excess of shared derived alleles between a sister species and an outgroup that violates a strict bifurcating tree, suggestive of introgression [2]. |
| sCF/sDF | Site Concordance / Discordance Factors | Quantify gene tree conflict per site | sCF, sDF1, sDF2 (percentages) | sCF: proportion of sites supporting a branch. sDF1/sDF2: proportions supporting the two alternative topologies. Imbalanced sDFs can indicate introgression [2]. |
| PhyloNetworks | - | Infer phylogenetic networks | Reticulate phylogenetic network | Uses summary statistics (like quartets) or sequence-based likelihood to model evolutionary histories that include hybridization events. |
Experimental Metrics and Interpretation
Table 2: Interpreting Key Quantitative Metrics
| Metric | Result Consistent with ILS | Result Consistent with Introgression | Notes & Caveats |
|---|---|---|---|
| D-statistic | Not significantly different from zero (D ≈ 0) | Significantly greater or less than zero ( | Significant D indicates gene flow but does not specify direction; requires careful taxon sampling (P1, P2, P3, Outgroup). |
| QuIBL Analysis | Better fit for a species tree model | Better fit for a phylogenetic network model with introgression | Directly compares the likelihood of trees vs. networks given the distribution of gene tree branch lengths [2]. |
| sDF1 / sDF2 Ratio | Roughly balanced (sDF1 ≈ sDF2) | Imbalanced (sDF1 >> sDF2 or vice versa) | An imbalance suggests a predominant discordant signal, which can be caused by introgression [2]. |
Detailed Experimental Protocol
This protocol outlines a comprehensive workflow for testing ILS vs. introgression hypotheses, as implemented in recent phylogenomic studies [2].
Step 1: Data Collection and Dataset Construction
- Taxon Sampling: Select multiple accessions for the target species and genera to adequately represent diversity. Include a well-chosen outgroup from a sister lineage to root the trees [2].
- Sequencing: Use transcriptome (RNA-Seq) or whole-genome sequencing. For organisms with large genomes, transcriptomics is a cost-effective method for obtaining numerous nuclear genes [2].
- Orthology Inference: Process raw sequence data (assembly, quality control) and use tools like OrthoFinder to identify groups of orthologous genes (OGs). This results in a nuclear dataset of hundreds to thousands of orthologous groups [2].
- Plastid Genome Extraction: Assemble a separate dataset of plastid protein-coding genes (PCGs) from the same data for comparative analysis [2].
Step 2: Phylogenetic Tree Reconstruction
- Gene Tree Estimation: For each orthologous group, infer an individual maximum likelihood (ML) gene tree [2].
- Species Tree Inference:
- Concatenation: Use ML analysis on a supermatrix of all concatenated OGs.
- Coalescent-based: Use a multi-species coalescent method (e.g., ASTRAL) on the set of individual gene trees to estimate the species tree, which is robust to ILS [2].
- Plastid Tree Inference: Reconstruct an ML tree from the concatenated plastid PCGs [2].
Step 3: Diagnosing and Quantifying Discordance
- Calculate Concordance Factors: Compute site concordance factors (sCF) and discordance factors (sDF1, sDF2) to identify phylogenetic nodes with high or imbalanced conflict [2].
- Perform D-statistics: Apply the ABBA-BABA test to specific taxon quartets to test for significant evidence of introgression [2].
- Polytomy Tests: Test whether poorly resolved nodes are better represented as hard polytomies, which can be indicative of rapid radiation and ILS [2].
Step 4: Testing Introgression with QuIBL
- Select Conflicting Topologies: Based on the results from Step 3, identify the primary species tree topology and the major conflicting alternative topologies [2].
- Model Comparison: Use QuIBL to compare the fit of the data to different models:
- A pure coalescent model (species tree) with ILS.
- A phylogenetic network model that includes one or more introgression events.
- Evaluate Results: The model with the better statistical fit (e.g., higher likelihood) is preferred. QuIBL is particularly powerful because it leverages information in gene tree branch lengths, which are expected to be shorter for introgressed lineages [2].
Figure 1: A high-level workflow for phylogenomic analysis of ILS and introgression.
The Scientist's Toolkit: Essential Research Reagents and Materials
Table 3: Essential Materials and Computational Tools for Phylogenomic Analysis
| Category / Item | Specific Examples | Function in Analysis |
|---|---|---|
| Wet Lab Materials | RNA/DNA extraction kits, sequencing reagents (for RNA-Seq/WGS) | Generate the raw nucleotide sequence data for assembling transcriptomes or genomes [2]. |
| Bioinformatics Software | OrthoFinder, MAFFT, IQ-TREE, ASTRAL | Orthology inference, multiple sequence alignment, maximum likelihood tree inference, and coalescent-based species tree estimation [2]. |
| Discordance & Introgression Tools | IQ-TREE (for sCF/sDF), Dsuite, QuIBL, PhyloNetworks | Quantifying site/gene tree conflict, calculating D-statistics, and modeling introgression via branch lengths or networks [2]. |
| High-Performance Computing | Computer cluster or cloud computing (AWS, GCP, Azure) | Provides the necessary computational power for analyzing large phylogenomic datasets (1000s of genes) [54]. |
A Case Study: Phylogenomics of Tribe Tulipeae
A 2025 study on the plant tribe Tulipeae (Tulipa, Amana, Erythronium, Gagea) provides a clear application of this protocol. The research used 50 newly sequenced and 15 published transcriptomes, constructing datasets of 2,594 nuclear orthologous genes and 74 plastid genes [2].
Key Findings [2]:
- Incongruence: The plastid tree topology ((Tulipa, (Erythronium, Amana))) conflicted with nuclear coalescent topologies ((Erythronium, (Tulipa, Amana)) or (Tulipa, (Erythronium, Amana))).
- Pervasive Discordance: High and imbalanced gene tree discordance was detected around the nodes connecting Amana, Erythronium, and Tulipa.
- Application of QuIBL and D-statistics: Both methods were applied to these key relationships. The study concluded that the evolutionary history was obscured by a combination of "especially pervasive ILS and reticulate evolution," making it difficult to resolve a single, unambiguous species tree [2].
This case highlights that in complex evolutionary scenarios, a multi-faceted approach using the methods described herein is necessary to unravel the intertwined signals of ILS and introgression.
The standard Brownian motion (BM) model has long served as a cornerstone in phylogenetic comparative methods for analyzing quantitative trait evolution. This model traditionally operates under the critical assumption that traits evolve along a single species phylogeny. However, the unprecedented growth in genomic-scale datasets has revealed a pervasive biological reality: genealogical discordance is widespread across the tree of life [55]. Gene trees often conflict with the species tree and with one another due to biological processes including incomplete lineage sorting (ILS) and introgression [9] [13].
This disconnect between model assumption and biological reality creates significant challenges for evolutionary inferences. When standard Brownian motion models are applied to species trees while ignoring underlying gene tree discordance, researchers risk substantial errors in estimating key evolutionary parameters. These include inflated evolutionary rate estimates, decreased phylogenetic signal, and mistaken inferences about shifts in mean trait values [55] [23].
This technical guide synthesizes recent methodological advances that extend Brownian motion models to incorporate gene tree discordance. We focus specifically on frameworks applicable within the context of a broader thesis research comparing the effects of incomplete lineage sorting versus introgression. By integrating these processes into trait evolution models, researchers can achieve more accurate parameter estimates and develop a more nuanced understanding of evolutionary processes.
Theoretical Foundations: From Standard Brownian Motion to Discordance-Aware Models
The Standard Brownian Motion Model
Under the standard Brownian motion model, trait values across species follow a multivariate normal distribution where the variance-covariance structure is determined entirely by the species tree topology and branch lengths [56]. For a three-taxon phylogeny with topology ((A,B),C) and branch lengths measured in time, the expected variance-covariance matrix T takes the form:
Table 1: Variance-Covariance Structure Under Standard Brownian Motion
| Species Pair | Covariance Calculation | Biological Interpretation |
|---|---|---|
| A vs. B | σ² × (t₂ - t₁) | Shared evolutionary history since divergence |
| A vs. C | σ² × 0 | No shared internal branches |
| B vs. C | σ² × 0 | No shared internal branches |
| Variance (A, B, or C) | σ² × t₂ | Total evolutionary time from root to tip |
In this formulation, σ² represents the evolutionary rate parameter, t₂ denotes the time from root to present, and t₁ indicates the time of the most recent speciation event [23]. The diagonal elements represent trait variances resulting from the total evolutionary time along each lineage, while off-diagonal elements represent covariances arising from shared evolutionary history before divergence.
The Multispecies Coalescent Model for Quantitative Traits
The multispecies coalescent model for quantitative traits incorporates genealogical discordance by modeling trait evolution as an aggregate process across many loci, each with its own genealogical history [55]. This approach recognizes that quantitative traits are typically influenced by many loci, each potentially having different genealogical histories due to ILS.
Under this framework, the expected trait covariance between species becomes a weighted average of the covariances expected from all possible gene trees:
Cov(X,Y) = σ² × Σ [freq(G) × sharedbranchlength(X,Y)|G]
Where freq(G) represents the frequency of gene tree G, and sharedbranchlength(X,Y)|G is the branch length shared by species X and Y in gene tree G [55]. This model predicts that genealogical discordance decreases the expected trait covariance between closely related species relative to more distantly related species, a pattern that contrasts sharply with expectations under the standard BM model.
Effects of Introgression on Trait Covariances
Introgression introduces additional complexity by creating shared evolutionary history not captured by the species tree. The multispecies network coalescent framework extends the multispecies coalescent to include both ILS and introgression, modeling how introgressed genomic regions create additional trait covariances between species [23].
When averaged across thousands of quantitative traits, such as gene expression values, introgression produces predictable patterns of trait similarity that deviate from species tree expectations. These patterns manifest as consistently increased trait similarity between introgressing lineages compared to what would be expected under pure ILS [23].
Methodological Approaches and Experimental Protocols
Model Implementation and Workflow
Implementing discordance-aware Brownian motion models requires a structured workflow that integrates genomic data with trait evolution modeling:
Figure 1: Phylogenomic Analysis Workflow for Discordance-Aware Trait Models
This workflow begins with genomic data collection, proceeds through simultaneous species tree and gene tree estimation, quantifies discordance patterns, estimates trait covariances incorporating discordance, and finally enables evolutionary inferences about trait dynamics.
Quantifying Gene Tree Discordance
A critical step in implementing these models involves quantifying gene tree discordance. Two key metrics have emerged for this purpose:
- Site Concordance Factors (sCF): Measure the proportion of informative sites supporting a specific branch in the species tree
- Site Discordance Factors (sDF1/sDF2): Quantify the proportion of sites supporting alternative topologies [2]
These metrics help distinguish between different biological sources of discordance. Imbalanced sDF values (where one alternative topology is much more common than the other) often suggest introgression, while more balanced distributions typically indicate ILS [2].
Table 2: Key Analytical Methods for Gene Tree Discordance Analysis
| Method | Primary Function | Discordance Sources Handled | Application Context |
|---|---|---|---|
| sCF/sDF Calculation | Quantifies branch support from site patterns | ILS, Introgression | Initial discordance screening |
| D-Statistics | Tests for allele sharing asymmetry | Introgression | Detecting historical gene flow |
| ASTRAL | Species tree estimation from gene trees | ILS | Coalescent-based phylogeny |
| PhyloNet/QuIBL | Phylogenetic network inference | ILS, Introgression | Reticulate evolution |
| Multi-Species Coalescent | Models gene tree heterogeneity | ILS | Trait covariance estimation |
Protocol for Discordance-Aware Trait Analysis
For researchers implementing these methods, the following protocol provides a detailed roadmap:
Gene Tree Estimation: Estimate gene trees for multiple independent loci using maximum likelihood or Bayesian methods. Loci should be carefully selected to minimize linkage and represent independent genealogies [57].
Species Tree/Network Estimation: Reconstruct the species tree using coalescent-based methods (e.g., ASTRAL) or phylogenetic networks (e.g., PhyloNet) that account for gene tree heterogeneity [2] [13].
Discordance Quantification: Calculate concordance and discordance factors for key nodes to identify regions of the phylogeny with high discordance [2].
Trait Covariance Matrix Estimation: Compute the expected trait variance-covariance matrix by integrating over all possible gene trees, weighted by their probabilities under the multispecies coalescent [55] [23].
Parameter Estimation: Estimate evolutionary parameters (e.g., evolutionary rates, ancestral states) using the discordance-aware covariance matrix in comparative phylogenetic analyses.
Model Comparison: Compare model fit between standard BM and discordance-aware models using information criteria (AIC, BIC) to determine whether incorporating discordance improves explanatory power.
Empirical Evidence and Case Studies
Plant Systems: Eucalypts and Tulips
Comprehensive phylogenomic studies in Eucalyptus subgenus Eudesmia have revealed extreme gene tree discordance despite clear species groupings. Phylogenomic analyses of 568 genes across 22 species showed that gene tree discordance generally increases with phylogenetic depth, with three major clades identified but their branching order remaining unresolved despite extensive filtering approaches [9]. Both ILS and hybridization contribute to this discordance, creating challenges for resolving deep evolutionary relationships.
Similarly, research on Liliaceae tribe Tulipeae (including tulips) demonstrated pervasive ILS and reticulate evolution among genera Amana, Erythronium, and Tulipa. Analyses of 2,594 nuclear orthologous genes revealed substantial discordance between plastid and nuclear phylogenies, with D-statistics and QuIBL analyses confirming contributions from both ILS and introgression to this conflict [2].
Animal Systems: Rattlesnakes and Wild Tomatoes
Rattlesnakes (genera Crotalus and Sistrurus) represent a compelling vertebrate example, where rapid diversification coupled with introgression has produced high gene tree heterogeneity. Phylogenomic analyses using transcriptome data have shown that previous phylogenetic conflicts stem from both ILS and introgression, necessitating network-based approaches for accurate evolutionary reconstruction [13].
In wild tomatoes (Solanum), research on ovule gene expression across 13 species has quantitatively demonstrated how introgression affects quantitative trait evolution. Studies examining thousands of gene expression traits found patterns consistent with Brownian motion on a network that includes both ILS and introgression, with stronger signals in clades experiencing higher rates of introgression [23].
Table 3: Comparative Analysis of Empirical Systems Exhibiting Gene Tree Discordance
| System | Data Type | Discordance Sources | Impact on Trait Evolution |
|---|---|---|---|
| Eucalyptus | 568 target capture genes | ILS, Hybridization | Complicates deep relationship inference |
| Tulips | 2,594 nuclear orthologs | ILS, Introgression | Nuclear-plastid incongruence |
| Rattlesnakes | Transcriptomes | ILS, Introgression, Anomalous Gene Trees | Previous phylogenetic conflicts |
| Wild Tomatoes | RNA-seq expression | ILS, Introgression | Altered trait covariance structure |
Table 4: Essential Research Reagents and Computational Tools
| Resource Type | Specific Examples | Function in Analysis |
|---|---|---|
| Bait Sets/Kits | Eucalypt-specific bait kit (568 genes), Angiosperms353 | Target capture sequencing across taxa |
| Sequencing Platforms | Illumina NovaSeq, HiSeq | High-throughput DNA/RNA sequencing |
| Phylogenetic Software | ASTRAL, IQ-TREE, RAxML | Species tree and gene tree inference |
| Network Analysis | PhyloNet, TreeMix, HyDe | Phylogenetic network inference |
| Discordance Metrics | sCF/sDF calculation scripts | Quantifying gene tree conflict |
| Comparative Methods | phylolm (R), mvMORPH (R) |
Trait evolution modeling |
| Coalescent Simulations | msprime, SLiM |
Simulating genomic data under complex models |
Implications for Evolutionary Inference and Drug Development
Incorporating gene tree discordance into quantitative trait models has profound implications for evolutionary inference. When ignored, genealogical discordance can lead to overestimation of evolutionary rates by up to 50% in some empirical examples, while simultaneously decreasing measured phylogenetic signal [55]. This occurs because discordance effectively redistributes trait covariances, reducing covariance among closely related species while increasing it among more distantly related species.
For biomedical researchers studying quantitative traits in non-model organisms or those using comparative approaches, these methodological refinements offer more accurate frameworks for identifying evolutionary constraints and convergences. In drug development contexts, where understanding the evolution of gene families and regulatory pathways is crucial, discordance-aware models provide more reliable inference of ancestral states and evolutionary rates [57].
The development of Brownian motion models that incorporate both ILS and introgression represents a significant step toward more biologically realistic models of quantitative trait evolution. As phylogenomic datasets continue to grow in both size and taxonomic breadth, these approaches will become increasingly essential for accurate evolutionary inference across the tree of life.
The advent of whole-genome sequencing has revolutionized evolutionary biology, enabling researchers to investigate phylogenetic relationships with unprecedented depth. A central challenge in this field is resolving gene tree discordance, where evolutionary histories inferred from different genomic regions conflict with one another and with the species tree. This discordance primarily arises from two biological processes: incomplete lineage sorting (ILS) and introgression (hybridization). ILS occurs when ancestral genetic polymorphisms persist through multiple speciation events and are sorted randomly into descendant lineages, creating a gene tree that does not match the species tree [1]. In contrast, introgression results from the transfer of genetic material between species through hybridization, leading to phylogenetic incongruence [36]. Distinguishing between these processes is crucial for accurate phylogenetic inference and understanding evolutionary history. This technical guide explores how modern genomic applications, from transcriptomics to phylogenomics, are addressing these challenges across diverse biological systems.
Core Concepts: Incomplete Lineage Sorting vs. Introgression
Biological Mechanisms and Distinguishing Features
Incomplete Lineage Sorting (ILS) is a neutral process where multiple alleles from an ancestral population persist through rapid speciation events and are randomly sorted into daughter species [1]. The probability of ILS increases when the effective population size (Nₑ) is large and the time between speciation events is short, as this provides insufficient time for alleles to coalesce. ILS produces a relatively uniform distribution of shared polymorphisms across the genome and is not geographically structured, meaning shared ancestral variation should appear evenly across populations, including those in allopatry [39].
Introgression involves the transfer of genetic material between distinct species through hybridization and backcrossing. Unlike ILS, introgression often leaves a heterogeneous genomic signature, with introduced genomic blocks showing reduced differentiation between species while the remainder of the genome remains highly differentiated [36]. Introgression signals are typically stronger in parapatric populations where species ranges overlap, compared to allopatric populations [39].
Table 1: Key Characteristics Differentiating ILS and Introgression
| Characteristic | Incomplete Lineage Sorting (ILS) | Introgression |
|---|---|---|
| Underlying Process | Random retention of ancestral polymorphisms | Transfer of alleles through hybridization |
| Genomic Distribution | Uniform across genome | Heterogeneous, localized to introgressed regions |
| Geographic Pattern | Shared variation uniform across allopatric and parapatric populations | Stronger signal in parapatric/sympatric populations |
| Impact on Divergence | Reduces divergence time estimates | Creates mosaic patterns of divergence |
| Detection Methods | Multispecies coalescent models, hemiplasy risk factor | D-statistics, phylogenetic network methods |
Quantifying Contributions in Evolutionary Studies
Studies across diverse taxa have quantified the relative contributions of ILS and introgression to phylogenetic discordance:
- In Fagaceae (oak family), decomposition analysis attributed 21.19% of gene tree variation to gene tree estimation error, 9.84% to ILS, and 7.76% to gene flow [21].
- Research on tuco-tucos (Ctenomys) estimated that approximately 9% of loci were affected by ILS in this rapidly radiating rodent genus [58].
- A study on murine rodents found that phylogenies built from proximate chromosomal regions were more similar, with linked selection influencing discordance patterns [59].
- In Allium subg. Cyathophora, 27-38.9% of single-copy gene trees conflicted with the species tree, with coalescent simulations indicating ILS as the primary cause [60].
Genomic Methodologies and Experimental Frameworks
Transcriptome-Based Phylogenomics
Transcriptome sequencing provides a cost-effective approach for generating large nuclear datasets without the challenges of whole-genome assembly. The typical workflow involves:
RNA Extraction and Sequencing: Extract high-quality RNA from fresh or flash-frozen tissues, followed by cDNA synthesis and Illumina sequencing [60] [61].
De Novo Assembly: Use tools like Trinity v.2.1.5 to assemble raw reads into transcripts, followed by coding sequence prediction with TRANSDECODER [60].
Orthology Assessment: Identify single-copy orthologs using OrthoMCL or similar tools with a sequence similarity threshold of 0.95 to avoid paralogy issues [60].
Dataset Construction: Align orthologous sequences using MAFFT and trim with Gblocks to remove poorly aligned regions [61].
A study on Mepraia triatomines demonstrated this approach, using transcriptomes from heads and salivary glands to resolve relationships among three species despite evidence of ancient hybridization [61]. Similarly, research on Allium utilized transcriptomes to quantify genome-wide gene tree discordance and identify ILS as the primary driver [60].
Target Sequence Capture Phylogenomics
Target sequence capture enriches predefined genomic regions before sequencing, balancing cost with phylogenetic utility:
Table 2: Target Capture Bait Sets for Phylogenomic Studies
| Bait Set Name | Target Clade | Number of Targeted Loci | Reference |
|---|---|---|---|
| AHE | Chordata | 512 | Lemmon et al., 2012 [62] |
| UCE Arachnida 1.1Kv1 | Arthropoda: Arachnida | 1,120 | Faircloth, 2017 [62] |
| UCE Hymenoptera 2.5Kv2 | Arthropoda: Hymenoptera | 2,590 | Branstetter et al., 2017 [62] |
| FrogCap | Chordata: Anura | ~15,000 | Hutter et al., 2019 [62] |
| SqCL | Chordata: Squamata | 5,312 | Singhal et al., 2017 [62] |
Experimental Workflow:
- Bait Design: Design RNA baits complementary to target loci, often focusing on ultraconserved elements (UCEs) or conserved exon regions with variable flanking sequences [62].
- Library Preparation and Hybridization: Prepare sequencing libraries, then hybridize with biotinylated baits for target enrichment.
- Sequencing and Data Processing: Sequence captured regions on Illumina platforms, then process reads through assembly and alignment pipelines.
This approach was applied to pine species (Pinus massoniana and P. hwangshanensis), using 33 intron loci to demonstrate that shared nuclear variation resulted primarily from secondary introgression rather than ILS [39].
Whole-Genome Approaches
Whole-genome sequencing provides the most comprehensive data for discriminating between ILS and introgression:
- Genome Assembly: De novo assembly using linked-read technologies (e.g., 10x Genomics) followed by scaffolding to chromosome level [59].
- Variant Calling: Map reads to reference genome, identify SNPs with GATK, and filter based on quality scores, depth, and missing data [21].
- Multi-Species Coalescent Analysis: Use methods like ASTRAL to estimate species trees while accounting for ILS [21] [59].
- Introgression Tests: Apply D-statistics (ABBA-BABA tests) and related methods to detect asymmetric gene flow [58] [59].
A study on murine rodents combined new genome assemblies with published resources to show that phylogenetic discordance correlates with genomic proximity, independent of contemporary recombination landscapes [59].
Analytical Framework and Visualization
Computational Workflow for Discriminating ILS and Introgression
The following diagram illustrates the integrated analytical pipeline for distinguishing ILS and introgression using genomic data:
Diagram 1: Analytical pipeline for ILS and introgression detection. Yellow nodes represent data processing steps, green nodes indicate introgression tests, and red nodes represent ILS analyses.
Key Statistical Tests and Their Applications
- D-Statistics (ABBA-BABA Test): Measures allele frequency patterns to detect asymmetric introgression. Significant D-statistics indicate gene flow between non-sister lineages [58] [59].
- Multispecies Coalescent Methods: Estimate species trees while accounting for ILS, implemented in software like ASTRAL and SVDquartets [21] [61].
- Approximate Bayesian Computation (ABC): Compares alternative demographic models to distinguish between ILS and introgression scenarios [39].
- Hemiplasy Risk Factor (HRF): Quantifies the probability that trait discordance results from ILS rather than convergent evolution [60].
Case Studies Across Diverse Taxa
Primate Evolution (Hominidae)
Studies of great apes and humans reveal that approximately 23% of 23,000 DNA sequence alignments in Hominidae did not support the known sister relationship of chimpanzees and humans [1]. Analysis shows that about 1.6% of the bonobo genome is more closely related to human homologs than to chimpanzees, primarily due to ILS [1]. The average divergence time between genes in human and chimpanzee genomes is older than the split between humans and gorillas, indicating persistent ancestral polymorphisms [1].
Plant Phylogenomics (Fagaceae)
Research on oaks and related species demonstrated strong discordance between cytoplasmic (cpDNA, mtDNA) and nuclear phylogenies [21]. Chloroplast and mitochondrial genomes divided Fagaceae species into New World and Old World clades, conflicting with nuclear genomic data - a pattern attributed to ancient interspecific hybridization [21]. This study highlighted the importance of analyzing all three genomic compartments (nuclear, chloroplast, mitochondrial) to detect complex evolutionary histories.
Rapid Rodent Radiations (Ctenomys)
The tuco-tuco genus Ctenomys comprises 64 species that diversified rapidly over approximately 1.3 million years [58]. Transcriptome analysis of three closely related species revealed significant gene tree discordance, with about 9% of loci affected by ILS [58]. D-statistics also detected introgression from C. torquatus into C. brasiliensis, demonstrating how both processes can simultaneously influence genomic evolution in recent radiations [58].
Table 3: Key Research Reagents and Computational Tools for Phylogenomics
| Category | Specific Tools/Reagents | Function/Application | Example Use Case |
|---|---|---|---|
| Sequencing Technologies | Illumina short-read, Linked-read genomes | Generate raw sequence data | Whole-genome sequencing of murine rodents [59] |
| Assembly & Alignment | Trinity, OrthoMCL, MAFFT, BWA | Process raw data into aligned sequences | Transcriptome assembly in Allium [60] |
| Phylogenetic Inference | IQ-TREE, ASTRAL, MrBayes | Estimate gene and species trees | Oak family phylogeny reconstruction [21] |
| Introgression Tests | D-Statistics, PhyloNetworks | Detect hybridization signals | Identifying gene flow in tuco-tucos [58] |
| ILS Analysis | TreeExp2, Hemiplasy Risk Factor | Quantify incomplete lineage sorting | Expression evolution analysis [63] |
| Demographic Modeling | Approximate Bayesian Computation | Test alternative divergence scenarios | Pine species speciation history [39] |
Whole-genome applications have fundamentally transformed our understanding of evolutionary processes, revealing the pervasive nature of both ILS and introgression across the tree of life. Transcriptomic and phylogenomic approaches provide complementary insights, with target capture enabling broad taxonomic sampling and whole-genome sequencing offering complete genomic context. Future directions in this field include improved phylogenetic network methods that simultaneously model ILS and introgression, development of more efficient algorithms for analyzing massive datasets, and integration of functional genomic data to understand the phenotypic consequences of discordant evolutionary histories. As genomic resources continue to expand across diverse taxa, researchers will be increasingly equipped to unravel the complex interplay of neutral and selective processes that shape biodiversity.
Resolving Analytical Challenges: Strategies for Disentangling Complex Evolutionary Histories
Gene tree incongruence is a pervasive challenge in modern phylogenomics, complicating our understanding of species evolution across the tree of life [21] [3]. This discordance among gene trees arises from multiple biological and analytical factors, primarily incomplete lineage sorting (ILS), introgression (gene flow), and gene tree estimation error (GTEE) [21] [3] [64]. Disentangling the relative contributions of these processes is crucial for reconstructing accurate evolutionary histories, particularly during rapid radiations where multiple conflicting signals are common.
The decomposition of these sources of conflict represents a methodological frontier in evolutionary biology. While numerous studies have explored underlying causes of gene tree conflict [3], the quantitative dissection of their contributions remains methodologically challenging because these processes can produce similar patterns of phylogenomic discord [65] [64]. This technical guide provides a comprehensive framework for implementing decomposition analysis, framed within the broader context of discriminating between ILS and introgression as drivers of gene tree discordance.
Theoretical Framework and Key Concepts
Incomplete lineage sorting (ILS) occurs when ancestral polymorphisms persist through multiple speciation events, causing alleles to coalesce in a non-sister species relationship more recently than with the sister species [21] [64]. This phenomenon is particularly prevalent in rapid radiations with short speciation intervals and large ancestral population sizes [64]. Introgression (gene flow) involves the transfer of genetic material between species through hybridization, introducing alleles with evolutionary histories that differ from the species tree [65] [64]. Gene tree estimation error (GTEE) constitutes an analytical rather than biological source of discordance, arising from limitations in phylogenetic inference methods, insufficient phylogenetic signal, or data quality issues [21] [3].
The Decomposition Analysis Approach
Decomposition analysis refers to a suite of computational methods designed to quantify the relative contributions of ILS, introgression, and GTEE to overall gene tree discordance. This approach operates on the principle that each process leaves distinct statistical signatures in phylogenomic datasets, which can be disentangled through careful modeling and hypothesis testing [21] [2] [65]. The framework typically involves generating a distribution of gene trees from multiple loci, comparing these trees to a reference species tree, and applying statistical methods to attribute discordance to specific causes.
Quantitative Decomposition: Empirical Findings from Current Research
Recent studies across diverse taxa have employed decomposition analysis to quantify sources of gene tree discordance, revealing substantial variation in the relative importance of different processes.
Table 1: Empirical Measurements of Contributions to Gene Tree Discordance
| Study System | ILS Contribution | Introgression Contribution | GTEE Contribution | Consistent Genes | Reference |
|---|---|---|---|---|---|
| Fagaceae (Oak family) | 9.84% | 7.76% | 21.19% | 58.1-59.5% | [21] [3] |
| Asian warty newts (Paramesotriton) | Primary driver | Secondary driver (pre-speciation) | Not quantified | Not reported | [4] |
| Oaks (Quercus) and relatives | Significant (with gene flow) | Extensive (ancient reticulation) | Not quantified | Not reported | [65] |
| Aspidistra plants (Taiwan) | Substantial (20.8% genes alternative topologies) | Detected | Not quantified | Not reported | [64] |
| Liliaceae tribe Tulipeae | Pervasive | Significant | Not quantified | Not reported | [2] |
Table 2: Characteristics of Consistent vs. Inconsistent Genes in Fagaceae
| Characteristic | Consistent Genes | Inconsistent Genes | Statistical Significance |
|---|---|---|---|
| Proportion | 58.1-59.5% | 40.5-41.9% | Not applicable |
| Phylogenetic signal | Stronger | Weaker | Significant |
| Recovery of species tree | More likely | Less likely | Significant |
| Sequence-based features | No systematic difference | No systematic difference | Not significant |
| Tree-based characteristics | No systematic difference | No systematic difference | Not significant |
Methodological Framework: Experimental Protocols and Workflows
Core Analytical Workflow for Decomposition Analysis
The following diagram illustrates the comprehensive workflow for conducting decomposition analysis, integrating multiple data types and analytical steps:
Detailed Experimental Protocols
Data Collection and Processing
Genome Assembly and Orthology Inference For mitochondrial genome assembly as performed in Fagaceae research [21] [3], researchers used GetOrganelle v1.7.1 with depth filtering (<25× coverage) to eliminate nuclear contamination. Contigs shorter than 100 bp were discarded, and the assembly was improved through iterative mapping (Bowtie2) and reassembly (Unicycler). For transcriptome-based studies like those in Liliaceae [2], orthologous genes were inferred using orthology inference tools, producing datasets of 2,594 nuclear orthologous genes for subsequent analysis.
Variant Calling and Filtering The Fagaceae protocol [21] [3] involved mapping three million paired-end reads per individual to a reference genome using BWA v0.7.17, followed by SNP calling with GATK HaplotypeCaller. Quality filters included minimum base quality score (Q30), mapping quality (Q30), depth thresholds (10-300×), and exclusion of heterozygous sites for haploid genomes. Potential contaminating sequences were identified via BLASTN against nuclear and chloroplast genomes (E-value < 1E−5, identity ≥ 95%, length ≥ 150 bp) and removed.
Phylogenetic Inference Methods
Tree Estimation Protocols Studies consistently employ both concatenation and coalescent approaches [21] [2] [3]. Maximum Likelihood analysis using IQ-TREE involves generating 1000 ML trees with 1000 non-parametric bootstrap replicates. Bayesian inference using MrBayes typically runs 10 million generations of Markov chain Monte Carlo, sampling trees every 1000 generations after discarding an appropriate burn-in (25% in Fagaceae studies). Coalescent-based species trees are often inferred using ASTRAL, which accounts for ILS while potentially being misled by gene flow [2].
Detection and Quantification of Introgression The D-statistic (ABBA-BABA test) is widely applied to test for introgression between lineages [2] [64]. This method detects allelic patterns that deviate from a strict bifurcating tree. For more complex scenarios, PhyloNet is used to infer phylogenetic networks that explicitly model hybridization events [4]. The QuIBL (Quantitative Introgression Branch Length) method provides additional power to distinguish ILS from introgression by comparing branch lengths across different tree topologies [2].
Discordance Decomposition Methods
Quartet-based Concordance Analysis Site concordance factors (sCF) and discordance factors (sDF1, sDF2) calculate the proportion of informative sites supporting each possible quartet relationship around a node [2]. Imbalanced sDF1/sDF2 values indicate potential introgression, while balanced values suggest ILS. This approach was central to resolving conflicts in Liliaceae [2].
Gene Tree Discordance Assessment The proportion of gene trees supporting each topological relationship at conflicting nodes is calculated. In Fagaceae, researchers categorized genes as "consistent" or "inconsistent" based on their support for the dominant species tree topology [21] [3]. This classification enabled quantitative assessment of how excluding inconsistent genes affects concordance between concatenation and coalescent methods.
Polytomy Tests For nodes with extensive conflict, likelihood-based polytomy tests determine whether a hard polytomy (simultaneous divergence) better explains the data than a bifurcating tree [2]. This helps identify ancient rapid radiations where ILS is expected to be high.
The Scientist's Toolkit: Essential Research Reagent Solutions
Table 3: Essential Computational Tools and Analytical Resources
| Tool/Resource | Primary Function | Application in Decomposition Analysis |
|---|---|---|
| IQ-TREE | Maximum likelihood phylogenetic inference | Gene tree and species tree estimation with model selection [21] [3] |
| ASTRAL | Coalescent-based species tree inference | Species tree estimation accounting for ILS [2] |
| PhyloNet | Phylogenetic network inference | Modeling reticulate evolution and hybridization events [4] |
| Dsuite | D-statistics and related tests | Introgression detection between lineages [4] |
| HyDe | Hypothesis of hybridization detection | Testing and quantifying hybridization events [4] |
| GetOrganelle | Organelle genome assembly | Generating mitochondrial and chloroplast references [21] [3] |
| OrthoFinder | Orthogroup inference | Identifying orthologous genes across species [2] |
| BWA/GATK | Read mapping and variant calling | SNP identification and filtering for phylogenomic datasets [21] [3] |
Advanced Integration: Paleontological and Biogeographic Context
For deep-time decomposition analysis, researchers are increasingly integrating paleontological and biogeographic data to establish the plausibility of ancient hybridization [65]. This involves:
Ancestral Range Reconstruction Using tools like BioGeoBEARS to infer historical distributions of lineages, identifying periods of sympatry that would enable hybridization [65].
Fossil-Calibrated Divergence Time Estimation Incorporating carefully identified fossils to establish temporal windows for potential gene flow events [65].
Paleoclimate Modeling Reconstructing past climatic conditions to identify periods of range shifts and secondary contact that might facilitate introgression [65].
In oak studies, this integrative approach revealed that ancestors of major Quercoideae lineages likely co-occurred in North America and Eurasia during the Early-Middle Eocene, providing ample opportunity for the ancient hybridization detected through genomic analyses [65].
Decomposition analysis provides a powerful quantitative framework for discriminating between ILS and introgression as drivers of gene tree discordance. The methodologies outlined in this guide—from basic phylogenetic inference to advanced network analysis and paleontological integration—represent the current state of the art in resolving complex evolutionary histories. As these approaches continue to mature, they will increasingly illuminate the rich tapestry of evolutionary processes that shape biodiversity across the tree of life.
In the era of phylogenomics, a central challenge has emerged: widespread conflict among phylogenetic trees inferred from different genes. This gene tree discordance complicates our understanding of species evolution and can be attributed to various biological processes including incomplete lineage sorting (ILS), gene flow (introgression), and gene tree estimation error (GTEE) [3] [21]. Disentangling these sources is crucial for reconstructing accurate evolutionary histories, particularly in rapidly radiating groups where these phenomena are most pronounced [13] [66].
The concepts of "consistent genes" (those exhibiting phylogenetic signals aligning with the dominant species tree) and "inconsistent genes" (those displaying conflicting signals) provide a powerful framework for addressing this challenge. Research on Fagaceae has revealed that approximately 58.1–59.5% of genes are consistent, while 40.5–41.9% are inconsistent [3] [21]. This technical guide explores advanced strategies for identifying and filtering these gene categories, enabling researchers to resolve evolutionary relationships amid pervasive phylogenetic conflict.
Understanding the relative contributions of different discordance sources is the first step in developing effective filtering strategies. Decomposition analyses allow researchers to quantify what proportion of gene tree variation stems from biological processes versus analytical artifacts.
Table 1: Relative Contributions to Gene Tree Discordance in Empirical Studies
| Study System | Gene Tree Estimation Error | Incomplete Lineage Sorting | Gene Flow/Introgression | Citation |
|---|---|---|---|---|
| Fagaceae (Oak family) | 21.19% | 9.84% | 7.76% | [3] [21] |
| Rattlesnakes (Crotalus & Sistrurus) | Significant (not quantified) | Dominant process | Significant contributor | [13] |
| Eucalyptus subgenus Eudesmia | Not significant | Major contributor | Widespread hybridization | [9] |
| Loricaria (Asteraceae) | Methodological artifacts | Strong evidence | Strong evidence | [66] |
The data reveal that GTEE often constitutes the largest source of variation, sometimes exceeding the combined contribution of biological processes [3] [21]. This highlights the critical importance of analytical methods in phylogenomic studies. In rapid radiations, the combined effects of ILS and introgression can create particularly challenging scenarios, as seen in rattlesnakes where these processes have "blurred" deep evolutionary relationships [13].
An Integrated Workflow for Gene Classification and Filtering
A systematic, multi-step approach is essential for distinguishing consistent and inconsistent genes. The following workflow integrates state-of-the-art methods from recent phylogenomic studies.
Diagram 1: Integrated workflow for identifying and filtering consistent genes, showing the three main phases of the process.
Phase 1: Foundational Analyses
Data Preprocessing & Gene Tree Inference Begin with rigorous orthology assessment using tools like OrthoFinder or HybPiper to identify orthologous loci [2]. For each locus, infer individual gene trees using model-based methods (IQ-TREE, RAxML) with appropriate substitution models [3] [21]. Assess gene tree support using bootstrap analyses (≥1000 replicates) [3].
Species Tree Estimation Generate a reference species tree using both concatenation (IQ-TREE, MrBayes) and coalescent-based methods (ASTRAL, SVDquartets) [3] [2] [66]. This reference tree serves as the hypothesis against which individual genes are evaluated for consistency. Note that strong conflict between concatenation and coalescent approaches often indicates regions of high discordance requiring further investigation [3] [21].
Phase 2: Gene Classification
Calculate Concordance Factors Quantify gene tree heterogeneity using gene and site concordance factors (gCF and sCF). These metrics measure the proportion of informative genes or sites supporting a particular branch in the species tree [2]. Tools for calculating concordance factors are implemented in IQ-TREE.
Identify Gene Categories Classify genes based on their agreement with the reference species tree:
- Consistent genes: Exhibit strong phylogenetic signal aligning with species tree topology (higher gCF/sCF values) [3] [21]
- Inconsistent genes: Display conflicting signals (lower gCF/sCF values) [3] [21]
In Fagaceae, consistent genes were more likely to recover the species tree topology despite showing no significant differences in sequence- or tree-based characteristics compared to inconsistent genes [3] [21].
Phase 3: Discordance Source Analysis and Filtering
Hypothesis Testing Employ statistical tests to distinguish biological sources of discordance:
- D-statistics (ABBA-BABA): Test for introgression by examining allele frequency patterns [2] [66]
- QuIBL (Quantitative Introgression using Branch Lengths): Estimate timing and strength of introgression events [2]
- Polytomy tests: Distinguish hard polytomies from bifurcating relationships with short internal branches [2]
- Phylogenetic networks: Model reticulate evolution (PhyloNet, SNaQ) [13] [66]
Apply Filtering Strategies Based on the identified sources, implement appropriate filtering:
- For GTEE-dominated discordance: Filter genes by missing data, parsimony informative sites, or branch support [3]
- For ILS-dominated discordance: Prioritize coalescent-based methods rather than aggressive gene filtering [13] [9]
- For introgression-dominated discordance: Remove introgressed loci if seeking a species tree, or use network approaches [13] [66]
Experimental Protocols for Discordance Analysis
Protocol: Concordance Factor Analysis
- Generate genome-wide gene trees using IQ-TREE with command:
iqtree -s alignment.phy -B 1000 -T AUTO - Infer reference species tree from concatenated data:
iqtree -s concatenated.phy -p partition.nex -B 1000 -T AUTO - Calculate concordance factors:
iqtree -t species_tree.treefile --gcf gene_trees.treefile -s concatenated.phy --scf 100 - Visualize results using R packages (ggtree, phytools) to identify branches with low concordance
Protocol: D-Statistics for Introgression
- Generate sequence alignments in VCF format for all taxa
- Set up phylogenetic quartet with topology ((P1,P2),P3),Outgroup
- Run D-statistic test using Dsuite:
dsuite Dtrios -o output input.vcf species_tree.treefile - Interpret significant results: D-statistics significantly different from zero indicate introgression
Protocol: Identifying Anomaly Zones
- Estimate branch lengths in coalescent units for the species tree
- Calculate theoretical probabilities of gene tree topologies under the multispecies coalescent
- Compare empirical gene tree frequencies to theoretical expectations
- Identify anomaly zones where the most common gene tree topology differs from the species tree [13]
The Scientist's Toolkit: Essential Research Reagents
Table 2: Key Bioinformatics Tools for Discordance Analysis
| Tool Name | Primary Function | Application in Discordance Research | Key Reference |
|---|---|---|---|
| IQ-TREE | Phylogenetic inference | Gene tree and species tree estimation; concordance factor calculation | [3] [21] |
| ASTRAL | Coalescent-based species tree | Species tree inference accounting for ILS | [13] [2] |
| PhyloNet/SNaQ | Phylogenetic networks | Modeling reticulate evolution and hybridization | [13] [66] |
| Dsuite | Introgression testing | D-statistics for detecting gene flow | [2] |
| OrthoFinder | Orthology assessment | Identifying orthologous gene groups | [2] |
| GetOrganelle | Organelle genome assembly | Assembling mitochondrial and chloroplast genomes | [3] [21] |
Case Studies in Filtering Strategy Implementation
A landmark study on Fagaceae demonstrated a comprehensive approach to discordance decomposition [3] [21]. Researchers assembled data across three genomes (nuclear, chloroplast, mitochondrial) and found stark contrasts between cytoplasmic and nuclear phylogenies. By applying discordance decomposition, they quantified that GTEE accounted for 21.19% of gene tree variation, while biological processes (ILS and gene flow) contributed 17.6% combined. After identifying consistent genes (58.1-59.5% of the dataset), they showed that excluding inconsistent genes significantly reduced conflicts between concatenation- and coalescent-based approaches [3] [21].
Rattlesnakes: ILS and Introgression in a Rapid Radiation
Rattlesnake phylogenomics reveals how rapid diversification creates challenging scenarios for phylogenetic inference [13]. Consecutive short internal branches produced anomalous gene trees, with both ILS and introgression contributing significantly to discordance. Filtering strategies based on gene or taxon removal failed to reduce conflict at key nodes, suggesting biological rather than analytical causes. This case study highlights that in anomaly zones, even extensive filtering may not resolve discordance, requiring network-based approaches instead [13].
Eucalyptus: When Filtering Fails
In Eucalyptus subgenus Eudesmia, researchers found that species groupings were clear but deep evolutionary relationships were blurred by ILS and hybridization [9]. Multiple filtering approaches (removing genes with low support or high missing data, excluding potentially introgressed samples) could not reduce gene tree conflict at deeper nodes. This important finding demonstrates that filtering has limitations when biological processes dominate discordance, and alternative approaches like phylogenetic networks are necessary [9].
Identifying consistent versus inconsistent genes provides a powerful framework for addressing phylogenomic discordance. The strategies outlined in this guide enable researchers to distinguish biological conflict from analytical artifacts and implement appropriate filtering protocols. Key principles emerge across empirical studies:
- GTEE often contributes substantially to discordance and can be mitigated through careful gene filtering [3] [21]
- ILS-dominated radiations may not benefit from aggressive filtering, requiring coalescent methods instead [13] [9]
- Introgression creates distinct patterns best addressed through network-based approaches [13] [66]
- Multi-method approaches combining trees and networks provide the most realistic evolutionary histories [13] [2] [66]
As phylogenomic datasets continue growing, these filtering strategies will remain essential for reconstructing robust phylogenetic hypotheses amid widespread gene tree discordance. The integrated workflow presented here offers a systematic pathway for researchers navigating these complex analytical challenges.
Accurate reconstruction of evolutionary histories is a cornerstone of modern biological sciences, with implications for understanding biodiversity, trait evolution, and disease mechanisms. In the era of phylogenomics, researchers routinely sequence entire genomes or transcriptomes to infer species relationships. However, a significant challenge emerges from the widespread observation that trees inferred from different genes often present conflicting evolutionary histories, a phenomenon known as gene tree discordance. This discordance can stem from two primary types of biological processes: deep coalescence due to incomplete lineage sorting (ILS) or reticulate evolution such as hybridization and introgression [67]. Compounding this biological complexity is the technical challenge of gene tree estimation error (GTEE), which arises when inferred gene trees do not match the true genealogical history of the sequences.
The interpretation of gene tree discordance is particularly crucial when distinguishing between ILS and introgression, as each process implies different evolutionary scenarios. ILS occurs when ancestral polymorphisms persist through multiple speciation events, leading to gene trees that differ from the species tree without any gene flow [4]. In contrast, introgression results from hybridization and the transfer of genetic material between species [67]. Accurate discrimination between these processes requires high-quality gene tree estimates, as GTEE can masquerade as or obscure the signal of both ILS and introgression, potentially leading to erroneous evolutionary conclusions [68] [21].
This technical guide examines the sources and impacts of GTEE, provides validated strategies for its mitigation, and presents analytical frameworks for accurate interpretation of gene tree discordance in the context of ILS and introgression research.
Defining and Quantifying GTEE
Gene Tree Estimation Error (GTEE) refers to the discrepancy between inferred gene trees and the true genealogical history of the sequences. It is formally quantified as the normalized Robinson-Foulds (RF) distance between inferred gene trees and simulated true gene trees [68]. The RF distance measures the number of bipartitions that differ between two trees, providing a standardized metric for topological accuracy.
GTEE arises from multiple interacting factors. Biological sources include short internal branches, low mutation rates, and limited numbers of parsimony-informative sites, all of which reduce phylogenetic signal [68]. Analytical sources encompass suboptimal model selection, inadequate alignment methods, and insufficient phylogenetic signal in the data [69]. The interplay between these factors creates substantial challenges for accurate gene tree estimation, particularly in rapidly radiating lineages where short internal branches are common.
Impact of GTEE on Discordance Interpretation
GTEE significantly complicates the interpretation of gene tree discordance in multiple ways. First, it can inflate perceived discordance levels, creating the illusion of extensive ILS or introgression where none exists. Second, GTEE can bias species tree estimation, as summary methods like ASTRAL assume that input gene trees are at least more correct than incorrect [69]. Third, and most critically, GTEE can obscure the distinctive patterns of ILS and introgression, potentially leading to misidentification of the underlying biological processes.
The impact of GTEE is particularly pronounced in the "anomaly zone" – regions of parameter space where the most likely gene tree topology differs from the species tree due to ILS alone [68]. In such cases, error correction methods that naïvely "correct" gene trees to be more similar to the species tree can actually increase topological error [68]. This demonstrates that simplistic approaches to GTEE mitigation may exacerbate rather than alleviate the problem.
Table 1: Factors Contributing to Gene Tree Estimation Error and Their Impacts
| Factor Category | Specific Factors | Impact on GTEE | Downstream Consequences |
|---|---|---|---|
| Biological | Short internal branches | Increases error | Mimics rapid radiation signature |
| Low mutation rates (θ) | Reduces signal | Increases stochastic error | |
| Rapid radiations | Increases ILS potential | Confounds species tree inference | |
| Analytical | Limited sequence length | Reduces informative sites | Increases estimation variance |
| Inadequate model selection | Model misspecification | Systematic estimation biases | |
| Poor alignment quality | Introduces noise | Topological inaccuracies | |
| Methodological | Inappropriate tree inference | Suboptimal searches | Inaccurate gene trees |
| Naïve error correction | Over-correction | Increased distance to true trees |
Methodological Framework for Mitigating GTEE
Gene Tree Estimation Best Practices
Effective mitigation of GTEE begins with optimized gene tree estimation procedures. Empirical studies comparing gene tree inference methods have revealed significant differences in performance. Research on Pseudapis bees demonstrated that Bayesian methods with reversible jump model search (MrBayes) produced gene trees with higher concordance and better "stemminess" values (relative length of internal branches), while IQ-Tree with ModelFinder produced gene trees that, when summarized with ASTRAL, most frequently recovered the correct species topology [69].
The gene tree estimation pipeline should include:
- Model Selection: Use automated model selection tools (e.g., ModelFinder in IQ-Tree) to identify the best-fit substitution model for each locus [69].
- Branch Support Assessment: Employ appropriate measures (ULTRAFAST bootstrap, Bayesian posterior probabilities) to quantify uncertainty.
- Data Filtering: Implement careful filtering of uninformative loci, as aggressive filtering can remove phylogenetic signal while lenient filtering retains noisy data [69].
- Polytomy Handling: Collapse weakly supported branches (e.g., bootstrap support <10%) into polytomies to reduce false resolution [69].
Advanced Error Correction Approaches
Traditional gene tree error correction methods such as TRACTION and TreeFix operate on the principle of reducing the distance between gene trees and a reference species tree. However, these methods can be counterproductive when the true gene trees are discordant from the species tree due to ILS. As demonstrated in simulation studies, TRACTION frequently increased topological error under higher levels of ILS, while TreeFix performed poorly under higher mutation rates [68].
Superior approaches include:
- Full Bayesian Coalescent Methods: Joint inference of gene and species trees under the multispecies coalescent model (e.g., StarBEAST2) substantially outperforms independent gene tree inference followed by error correction [68].
- Model-Based Correction: Methods incorporating explicit statistical models of evolution rather than relying on distance-based heuristics.
- Probabilistic Reconciliation: Approaches that account for uncertainty in both gene trees and species trees simultaneously.
Table 2: Performance Comparison of GTEE Mitigation Strategies
| Method | Underlying Principle | Advantages | Limitations | Effectiveness |
|---|---|---|---|---|
| TRACTION | Nonparametric RF-optimal tree refinement | Fast, trivially parallelizable | Worsens accuracy under high ILS | Variable [68] |
| TreeFix | Species tree attraction with sequence data | Incorporates sequence likelihood | Poor performance with high mutation rates | Variable [68] |
| Bayesian Coalescent (StarBEAST2) | Joint gene tree/species tree inference | More accurate than two-step methods | Computationally intensive | High [68] |
| ASTRAL | Quartet-based species tree estimation | Consistent under ILS | Sensitive to GTEE | High with accurate gene trees [69] |
| BUCKy | Bayesian concordance analysis | Estimates genome-wide concordance | Requires prior expectation of discordance | Moderate [70] |
Species Tree Inference Robust to GTEE
When GTEE cannot be sufficiently reduced, employing species tree methods that are robust to such errors becomes essential. Quartet-based methods like ASTRAL demonstrate greater resilience to GTEE compared to concatenation approaches, particularly when gene trees contain moderate levels of error [69]. However, this resilience has limits, and excessive GTEE will degrade all species tree methods.
Gene tree parsimony approaches, as implemented in iGTP, seek species trees that minimize reconciliation costs under duplication, duplication-loss, or deep coalescence models [71]. These methods can handle large-scale phylogenomic datasets but require binary trees and may be sensitive to high levels of GTEE.
Discriminating Between ILS and Introgression in the Presence of GTEE
Analytical Frameworks for Discordance Decomposition
Advanced statistical frameworks enable researchers to decompose gene tree discordance into its constituent causes. A study on Fagaceae demonstrated how to quantify the relative contributions of different factors, finding that GTEE accounted for 21.19% of gene tree variation, while ILS and gene flow contributed 9.84% and 7.76%, respectively [21]. This decomposition is essential for accurate interpretation of evolutionary histories.
Key approaches include:
- Site-based Concordance Analysis: Calculation of "site concordance factors" (sCF) and "site discordance factors" (sDF1/sDF2) to identify nodes with high or imbalanced discordance [2].
- Phylogenetic Network Methods: Use of tools like PhyloNet to detect hybridization events and estimate their contribution to discordance [4] [67].
- D-statistics (ABBA-BABA Tests: Detection of allele sharing patterns indicative of introgression [2] [4].
- QuIBL (Quantitative Introgression Branch Length): Inference of introgression timing and strength [2].
Case Studies in Discordance Interpretation
Empirical examples illustrate successful discrimination between ILS and introgression:
In Asian warty newts (Paramesotriton), phylogenomic analyses identified ILS as the primary cause of gene tree discordance, supplemented by pre-speciation introgression events. This discrimination was achieved through integrated application of ASTRAL, HyDe, Dsuite, and PhyloNet [4].
In Petunia and related genera, high gene tree discordance in shallow nodes was attributed to both ILS and hybridization. Network analyses estimated ancient hybridization events between genera with different chromosome numbers, despite current reproductive barriers [67].
In the Liliaceae tribe Tulipeae, researchers faced persistent unresolved relationships among Amana, Erythronium, and Tulipa due to "especially pervasive ILS and reticulate evolution." This complexity required combined application of D-statistics and QuIBL to assess alternative contributions of ILS and introgression [2].
Integrated Workflows and Visualization Tools
Comprehensive Analytical Pipeline
An effective workflow for mitigating GTEE and interpreting discordance incorporates multiple steps from data collection to final inference:
Diagram 1: Integrated workflow for GTEE mitigation and discordance interpretation
Visualization of Discordance Patterns
Effective visualization is crucial for interpreting complex patterns of gene tree discordance. Tools like DiscoVista generate interpretable visualizations of gene tree discordance, enabling researchers to identify consensus patterns and outliers across the genome [72]. DiscoVista produces multiple visualization types:
- Discordance Distribution Plots: Histograms showing the frequency of different topological relationships.
- Occupancy Analysis: Assessment of taxon representation across gene trees.
- Clade Support Visualization: Graphical representation of support for specific clades across different analyses.
Diagram 2: Discordance visualization pipeline with DiscoVista
Table 3: Essential Computational Tools for GTEE Mitigation and Discordance Analysis
| Tool/Resource | Primary Function | Application Context | Key Features |
|---|---|---|---|
| IQ-Tree | Gene tree estimation | Maximum likelihood tree inference | ModelFinder, ULTRAFAST bootstrap [69] |
| MrBayes | Bayesian gene tree estimation | Probabilistic tree inference | reversible jump models, posterior probabilities [69] |
| ASTRAL | Species tree inference | Coalescent-based species tree from gene trees | Quartet-based, consistent under ILS [69] |
| StarBEAST2 | Joint species/gene tree inference | Bayesian coalescent analysis | Co-estimation, handles uncertainty [68] |
| BUCKy | Bayesian concordance analysis | Genome-wide concordance estimation | Estimates predominant history [70] |
| DiscoVista | Discordance visualization | Interpretable graphs of gene tree conflict | Multiple visualization types [72] |
| PhyloNet | Phylogenetic networks | Reticulate evolution detection | Hybridization inference [67] |
| iGTP | Gene tree parsimony | Species tree via reconciliation costs | Handles duplication, loss, deep coalescence [71] |
| Dsuite | Introgression detection | D-statistics, f-branch method | Tests for gene flow [4] |
Accurate interpretation of gene tree discordance in the critical distinction between incomplete lineage sorting and introgression requires sophisticated approaches to gene tree estimation error. GTEE is not merely a technical nuisance but a substantive factor that can fundamentally alter evolutionary inferences if improperly addressed.
The most promising path forward involves model-based approaches that explicitly account for the sources of error and biological complexity rather than relying on oversimplified heuristics. Full Bayesian coalescent methods, while computationally demanding, provide the most robust framework for jointly estimating gene and species trees while accounting for uncertainty [68]. Additionally, continued development of discordance decomposition methods will enable more precise quantification of the relative contributions of ILS, introgression, and GTEE to observed phylogenetic patterns.
As phylogenomic datasets continue to grow in size and taxonomic scope, researchers must remain vigilant about the pervasive influence of GTEE. By implementing the integrated workflows, validation procedures, and visualization tools outlined in this guide, researchers can significantly improve the accuracy of their evolutionary inferences and make more confident distinctions between the contrasting evolutionary histories suggested by incomplete lineage sorting and introgression.
The evolutionary history of a species has traditionally been inferred from a single gene tree or a concatenated dataset, under the assumption that it represents the true species tree. However, the era of phylogenomics has revealed widespread discordance between gene trees inferred from different genomic compartments, particularly between cytoplasmic (plastid and mitochondrial) and nuclear genomes [2] [73]. This cytoplasmic-nuclear incongruence presents a significant challenge for reconstructing species relationships but also offers a valuable opportunity to investigate complex evolutionary processes. The fundamental conflict lies in distinguishing whether observed discordances result from incomplete lineage sorting (ILS), the failure of gene lineages to coalesce in successive speciation events, or from introgression, the transfer of genetic material between incompletely isolated lineages [2] [74]. Resolving this distinction is not merely a technical exercise in phylogenetics; it is essential for understanding the genetic basis of speciation, the mechanisms of reproductive isolation, and the evolutionary history of traits relevant to drug discovery from natural products.
This technical guide examines the principles and methodologies for resolving cytoplasmic-nuclear incongruence within the broader context of gene tree discordance research. We synthesize current phylogenomic frameworks, provide detailed experimental protocols, and illustrate analytical approaches through case studies, with a particular focus on quantitative comparisons and the interpretation of conflicting signals in multi-genome datasets.
Biological Mechanisms of Discordance
The conflicting phylogenetic signals between cytoplasmic and nuclear genomes primarily arise from two biological processes with distinct population genetic causes and predictable patterns:
Incomplete Lineage Sorting (ILS): ILS occurs when ancestral polymorphisms persist through multiple speciation events, causing gene trees to differ from the species tree. The probability of ILS increases with larger effective population sizes and shorter intervals between successive speciations [74]. In such cases, the cytoplasmic genomes (especially plastids in plants) and nuclear genome may each retain different ancestral polymorphisms, leading to incongruent trees without any hybridization. The expected frequency of the dominant discordant topology under ILS alone is typically less than one-third for a three-taxon case [74].
Introgression: Introgression involves the transfer of genetic material between species through hybridization and backcrossing. This process can affect genomic compartments differently due to their distinct modes of inheritance. Cytoplasmic genomes, often maternally inherited, may introgress more readily than the nuclear genome, leading to patterns of "cytoplasmic capture" [2] [73]. In contrast to ILS, introgression can produce a dominant discordant topology that exceeds the one-third frequency expectation from ILS alone [74].
Distinct Evolutionary Dynamics of Genomic Compartments
The differential behavior of genomic compartments further complicates phylogenetic reconciliation:
Mutation Rate Variation: Cytoplasmic genomes generally exhibit lower mutation rates compared to nuclear genomes, leading to different estimates of evolutionary relationships [73]. This rate variation can create apparent incongruence even without biological discordance.
Effective Population Size Differences: Cytoplasmic genomes, particularly haploid and uniparentally inherited organelles, have smaller effective population sizes than the nuclear genome, reducing the efficiency of selection and allowing faster accumulation of deleterious mutations (increased genetic load) [73].
Inheritance Patterns: While nuclear genomes typically follow biparental inheritance, cytoplasmic genomes are often uniparentally (usually maternally) inherited. This differential inheritance affects how genomic compartments are reshuffled during hybridization events [73].
Table 1: Characteristics of Genomic Compartments Influencing Phylogenetic Discordance
| Genomic Compartment | Inheritance Pattern | Effective Population Size | Mutation Rate | Primary Discordance Sources |
|---|---|---|---|---|
| Nuclear Genome | Biparental | Larger | Higher | ILS, Introgression |
| Plastid Genome | Usually Maternal | Smaller | Lower | Introgression (Plastid Capture) |
| Mitochondrial Genome | Usually Maternal | Smaller | Variable | Introgression, Structural Variation |
Methodological Approaches for Detection and Analysis
Phylogenomic Tree Inference Methods
Robust inference of species relationships requires approaches that account for gene tree heterogeneity:
Multi-Species Coalescent (MSC) Methods: MSC methods explicitly model ILS by estimating species trees from multiple gene trees while accommodating discordance. Implementations such as ASTRAL are particularly effective for handling large datasets [2]. These methods assume discordance arises primarily from ILS rather than introgression.
Maximum Likelihood (ML) Methods: ML approaches applied to concatenated datasets can provide a baseline species tree hypothesis, but may be misled by high levels of discordance. Comparison between MSC and ML trees helps identify nodes affected by systematic biases [2].
Site Concordance Factors (sCF): sCF measures the proportion of supporting sites for a given branch in alignment data, helping to identify nodes with weak phylogenetic signal or conflicting evolutionary histories [2].
Statistical Tests for Introgression
Several statistical frameworks have been developed to detect introgression against a background of ILS:
D-Statistics (ABBA-BABA Test): This test detects asymmetries in allele sharing patterns among four taxa to identify introgression between non-sister lineages. Significant deviations from the expected pattern provide evidence of introgression [2] [74].
QuIBL (Quantitative Introgression Branch Length): QuIBL uses the distribution of branch lengths to distinguish between ILS and introgression, leveraging the fact that gene trees resulting from introgression often have longer internal branches than those produced by ILS alone [2].
Phylogenetic Networks: Network approaches represent evolutionary history as a graph with reticulate edges, explicitly modeling both divergence and introgression events. Software such as PhyloNet implements the multispecies network coalescent, which simultaneously accounts for ILS and introgression [74].
Simulation-Based Approaches
For complex evolutionary scenarios, simulation tools provide a framework for evaluating competing hypotheses:
- HeIST (Hemiplasy Inference Simulation Tool): HeIST uses coalescent simulation to estimate the probability that observed trait incongruence results from hemiplasy (discordant gene tree evolution) versus homoplasy (convergent evolution). The tool can incorporate both ILS and introgression, providing a statistical inference about the number of trait transitions [74].
Table 2: Analytical Methods for Resolving Cytoplasmic-Nuclear Incongruence
| Method Category | Specific Methods | Primary Application | Strengths | Limitations |
|---|---|---|---|---|
| Tree Inference | ASTRAL, RAxML | Species tree estimation | Scalable to genome-scale data | Assumes specific discordance sources |
| Introgression Tests | D-Statistics, f-branch | Detecting gene flow | Simple implementation, clear interpretation | Limited to specific phylogenetic contexts |
| Network Methods | PhyloNet, SplitsTree | Reticulate evolution visualization | Explicitly models hybridization | Computationally intensive |
| Simulation Tools | HeIST, ms | Hypothesis testing | Flexible scenario modeling | Dependent on model parameters |
Experimental Design and Workflow
A comprehensive approach to resolving cytoplasmic-nuclear incongruence involves integrated laboratory and computational phases:
Figure 1: Comprehensive workflow for resolving cytoplasmic-nuclear incongruence, integrating laboratory and computational approaches.
Genome Sequencing Strategies
The selection of appropriate sequencing approaches depends on research questions, genomic resources, and budget:
Transcriptome Sequencing: For organisms with large genomes (e.g., Tulipa, with 2C DNA values of 32-69 pg), transcriptome sequencing provides numerous nuclear genes and nearly all plastid protein-coding genes (PCGs) in a cost-effective manner [2]. This approach was successfully applied in Tulipeae research, generating 2594 nuclear orthologous genes and 74 plastid PCGs for phylogenetic analysis [2].
Whole-Genome Sequencing: While comprehensive, this approach may be prohibitive for organisms with exceptionally large genomes. It does, however, provide complete mitogenome and plastome data, enabling detection of structural variations and chimeric open reading frames that may influence evolutionary trajectories [73].
Targeted Capture Methods: Hybrid capture techniques allow sequencing of specific genomic regions across multiple taxa, balancing depth of coverage with phylogenetic breadth.
Data Processing and Orthology Assessment
Robust orthology inference is critical for meaningful multi-genome comparisons:
Plastid Dataset Construction: Plastid protein-coding genes are typically straightforward to identify and align due to their conserved structure and minimal duplication. The Tulipeae study utilized 74 plastid PCGs, which provided moderate phylogenetic resolution despite some limitations at the species level [2].
Nuclear Dataset Construction: Nuclear orthologous genes (OGs) require careful filtering for paralogy. The Tulipeae researchers created a nuclear dataset of 2594 OGs, with a subset of 1594 OGs showing relatively low copy number, highlighting the importance of quality control in orthology assessment [2].
Case Studies in Plant Phylogenomics
Tulipeae Tribe: Pervasive ILS and Reticulate Evolution
Research on the Tulipeae tribe (Liliaceae) provides a compelling example of complex phylogenetic relationships involving Tulipa and related genera (Amana, Erythronium, and Gagea). Despite extensive transcriptome data (50 newly sequenced plus 15 published transcriptomes), researchers failed to reconstruct an unambiguous evolutionary history among Amana, Erythronium, and Tulipa due to pervasive ILS and reticulate evolution [2].
Key findings from this study include:
Conflicting Topologies: Plastid genomes supported a (Tulipa, (Erythronium, Amana)) relationship, while nuclear data using 2594 OGs weakly supported (Erythronium, (Tulipa, Amana)), and a subset of 1594 OGs with low copy number recovered (Tulipa, (Erythronium, Amana)) [2].
Subgeneric Relationships: Within Tulipa, most traditional sections were found to be non-monophyletic, though the monophyly of subgenera Clusianae, Eriostemones, and Tulipa was confirmed. The small subgenus Orithyia was exceptional, with T. heterophylla placed as sister to the remainder of the genus, while T. sinkiangensis clustered within subgenus Tulipa [2].
Methodological Insights: The researchers employed site concordance factors (sCF) to quantify discordance, followed by phylogenetic network analyses and polytomy tests for nodes displaying high or imbalanced sDF1/sDF2 values [2].
Citrus Pan-Mitogenomics: Cytonuclear Coevolution
Research on citrus species revealed how evolutionary conflicts between cytoplasmic and nuclear genomes influence diversification, domestication, and hybridization:
Structural Variations and Chimeric ORFs: Construction of a citrus pan-mitogenome revealed extensive structural variations generating chimeric open reading frames (ORFs), with nad3, nad5, atp1, and atp8 gene fragments frequently forming these ORFs. Two chimeric ORFs containing nad5 fragments were specifically identified in mandarin and associated with cytoplasmic male sterility (CMS) [73].
Discordant Topologies: Population genomic data from 184 citrus accessions showed discordant relationships between cytoplasmic and nuclear genomes, resulting from different mutation rates and heteroplasmy levels from paternal leakage [73].
Cytonuclear Interactions: Genome-wide association studies provided evidence that three nuclear genes encoding pentatricopeptide repeat (PPR) proteins contribute to cytonuclear interactions in the Citrus genus, potentially serving as restorer-of-fertility (Rf) genes for CMS [73].
Figure 2: Cytonuclear coevolutionary dynamics in citrus, showing how conflict leads to molecular evolution in both genomes.
The Scientist's Toolkit: Research Reagent Solutions
Table 3: Essential Research Tools for Multi-Genome Comparison Studies
| Research Tool | Specific Application | Function in Analysis | Implementation Examples |
|---|---|---|---|
| Sequencing Platforms | Genome/transcriptome sequencing | Generates primary molecular data | Illumina, PacBio, Nanopore |
| Orthology Inference Tools | Gene family identification | Distinguishes orthologs from paralogs | OrthoFinder, BUSCO |
| Phylogenetic Software | Tree inference | Reconstructs evolutionary relationships | ASTRAL, RAxML, PhyML |
| Discordance Analysis Tools | Quantifying incongruence | Measures gene tree conflict | sCF/sDF calculations, Phylo.io |
| Introgression Tests | Detecting hybridization | Identifies gene flow between lineages | D-statistics, QuIBL |
| Coalescent Simulators | Hypothesis testing | Models expected patterns under evolutionary scenarios | HeIST, ms, SLiM |
Quantitative Comparison of Evolutionary Scenarios
Table 4: Quantitative Framework for Distinguishing ILS from Introgression
| Analytical Feature | Incomplete Lineage Sorting | Introgression | Composite Signals |
|---|---|---|---|
| Frequency of Dominant Discordant Topology | Typically <33% for 3-taxon case | Can exceed 33% | Intermediate or heterogeneous frequencies |
| Branch Length Patterns | Shorter internal branches | Longer internal branches for introgressed loci | Mixture of branch length distributions |
| Genomic Distribution | Genome-wide, relatively uniform | Often clustered in genomic regions | Heterogeneous across genome |
| D-Statistic Signal | No significant deviation | Significant deviation from null expectation | Significant but heterogeneous signals |
| Relationship to Geographic Proximity | Independent of geography | Often associated with secondary contact | Correlated with specific geographic patterns |
Resolving cytoplasmic-nuclear incongruence requires careful consideration of both biological processes and methodological limitations. The case studies presented demonstrate that pervasive ILS and reticulate evolution can create substantial challenges for phylogenetic inference, sometimes preventing unambiguous resolution of relationships even with extensive genomic data [2]. Future research directions should focus on integrating additional lines of evidence, such as chromosomal structural variations [73] and fossil-calibrated divergence time estimates, to further constrain possible evolutionary scenarios. Additionally, developing more sophisticated models that simultaneously account for multiple sources of discordance—including ILS, introgression, and gene duplication/loss—will enhance our ability to reconstruct evolutionary history from conflicting genomic signals. For researchers in drug discovery, recognizing these complex evolutionary patterns is essential for correct identification of biologically relevant taxa and interpretation of trait evolution in natural products research.
Convergent evolution presents a central paradox in evolutionary biology: the independent emergence of similar phenotypes in distantly related lineages. While traditionally interpreted as strong evidence for adaptation, similar phenotypes can arise through multiple biological processes, creating significant challenges for accurate evolutionary inference. Within modern phylogenomics, a core challenge lies in distinguishing genuine convergent adaptation from other processes that create similar genetic or phenotypic patterns, chiefly incomplete lineage sorting (ILS) and introgression. ILS occurs when ancestral polymorphisms persist through multiple speciation events, leading to gene trees that conflict with the species tree [1]. This phenomenon is particularly prevalent in rapid radiations and lineages with large effective population sizes. Conversely, introgression involves the transfer of genetic material between species through hybridization, also producing gene tree discordance that can mimic signals of convergence [22] [9]. This technical guide addresses the methodologies and analytical frameworks required to disentangle these complex signals, with particular emphasis on their implications for phylogenomic research.
Conceptual Framework: Defining Evolutionary Patterns
Types of Homoplasy
Convergent evolution is the independent evolution of similar features in species of different periods or epochs in time, creating analogous structures that have similar form or function but were not present in the last common ancestor [75]. In cladistic terms, this phenomenon is called homoplasy. The distinction between different types of homoplasy is critical for accurate interpretation:
- Convergence vs. Parallelism: When two species are similar in a particular character, evolution is defined as parallel if the ancestors were also similar, and convergent if they were not [75]. Some researchers define parallelism as evolution through similar genetic/developmental pathways, while convergence uses different pathways [76].
- Analogy vs. Homology: Functionally similar features arising through convergence are analogous, whereas homologous structures or traits have a common origin but may have dissimilar functions [75].
Biological Processes Causing Discordance
The fundamental challenge in identifying true convergence lies in distinguishing it from other processes that create similar patterns:
- Incomplete Lineage Sorting (ILS): A phenomenon in population genetics where gene tree discordance arises from the persistence of ancestral polymorphisms through successive speciation events [1]. For example, in the Hominidae family, approximately 23% of gene trees do not support the known sister relationship between humans and chimpanzees due to ILS [1].
- Introgression/Hybridization: The transfer of genetic material between species through hybridization, creating phylogenetic patterns where specific genes appear more similar between species than their actual evolutionary relationship would predict [22] [9].
- Hidden Paralogy: The presence of undetected gene duplications that can confound phylogenetic analyses when paralogous copies are mistaken for orthologs [22].
Table 1: Characteristics of Processes Causing Gene Tree Discordance
| Process | Definition | Key Characteristics | Common Analytical Approaches |
|---|---|---|---|
| True Convergent Evolution | Independent evolution of similar traits through distinct genetic mutations | Similar phenotypes with different underlying genetic bases; often associated with similar selective pressures | Phylogenetic independent contrasts; molecular evolutionary analyses of selection |
| Incomplete Lineage Sorting | Persistence of ancestral genetic polymorphisms through speciation events | Discordance distributed randomly across genome; follows coalescent expectations | Coalescent-based species tree methods (ASTRAL, SVDquartets) |
| Introgression | Transfer of genetic material between species via hybridization | Discordance localized to specific genomic regions; often shows geographic patterns | D-statistics (ABBA-BABA); Phylonetwork analyses |
| Hidden Paralogy | Presence of undetected gene duplicates mistaken for orthologs | Creates anomalous phylogenetic groupings; often identifiable through synteny | Orthology assessment tools; synteny analysis |
Quantitative Approaches for Measuring Convergence
Phylogenomic Scale Analyses
Modern comparative methods have developed sophisticated approaches to quantify convergence, moving beyond simple recognition of similar traits. Stayton (2015) emphasizes that quantification of the frequency and strength of convergence, rather than simply identifying cases, is central to its systematic comprehension [77]. Key methodological considerations include:
- Standardization for Clade Size and Age: In larger or older clades, more convergent events are expected by chance. Measurements should account for this through rates such as "number of convergent events per species" or "amount of convergence per million years" [77].
- Multivariate Phenospace Approaches: These methods measure the amount of phenotypic evolution that has resulted in increased similarity among taxa, working directly with continuous character data and phylogenies [77].
- Distance-Based Measures: Approaches such as the Wheatsheaf index evaluate whether multiple lineages have evolved toward a particular phenotype, incorporating information about the starting point, ending point, and amount of evolution [77].
Molecular Convergence Detection
At the molecular level, convergent evolution can be detected through several analytical frameworks:
- Genome-Wide Scans for Convergent Substitutions: Identifying parallel amino acid changes in distantly related lineages occupying similar environments.
- Selection Tests: Applying tests of positive selection (dN/dS ratios) to identify genes under repeated selective pressure.
- Case Studies: Documented examples include convergent mutations in the Na+,K+-ATPase gene providing resistance to cardiotonic steroids across six insect orders, with 76% of amino acid substitutions occurring in parallel in at least two lineages [75].
Table 2: Quantitative Measures of Convergent Evolution
| Method | Data Type | What It Measures | Strengths | Limitations |
|---|---|---|---|---|
| Wheatsheaf Index | Continuous traits | Degree to which lineages evolve toward specific phenotypes | Incorpor phylogenetic information; works with continuous data | Requires well-resolved phylogeny |
| Convergence Measure (C1-C4) | Continuous traits | Amount of evolution resulting in increased similarity | Distinguishes different modes of convergence | Complex calculation |
| Ornstein-Uhlenbeck Models | Continuous traits | Adaptation toward multiple selective optima | Statistical framework for hypothesis testing | Computationally intensive |
| Population Genomic Scans | Genomic sequences | Convergent amino acid substitutions | Direct molecular evidence; high resolution | Requires multiple genomes |
Experimental Protocols for Distinguishing Mechanisms
Target Capture Sequencing for Phylogenomics
Target capture sequencing (TCS) has emerged as a powerful method for generating phylogenomic datasets while controlling for sources of discordance [9]. The protocol involves:
Bait Design and Testing:
- Develop taxon-specific RNA baits targeting hundreds to thousands of orthologous genes
- For Eucalyptus research, a custom bait kit targeting 568 genes was designed [9]
- Test bait efficiency across divergent taxa to ensure consistent recovery
Library Preparation and Sequencing:
- Extract high-quality DNA from multiple accessions per species (recommended: 2+ accessions for widespread species)
- Prepare sequencing libraries with unique dual indexes for sample multiplexing
- Perform hybrid capture using the custom bait set
- Sequence on Illumina platforms to achieve sufficient coverage (typically 20-50x per gene)
Data Processing Pipeline:
- Demultiplex reads and perform quality control (FastQC)
- Trim adapters and low-quality bases (Trimmomatic, Cutadapt)
- Map reads to reference sequences or perform de novo assembly (BWA, HybPiper)
- Call consensus sequences or SNPs for phylogenetic analysis
Target Capture Sequencing Workflow
Analytical Framework for Discordance
Gene Tree-Species Tree Reconciliation:
- Reconstruct individual gene trees using maximum likelihood (RAxML, IQ-TREE) or Bayesian methods (MrBayes)
- Infer the species tree using coalescent-based methods (ASTRAL, SVDquartets) that account for ILS
- Quantify gene tree conflict using metrics such as internode certainty
Testing Introgression vs. ILS:
- Apply D-statistics (ABBA-BABA test) to detect asymmetrical patterns of allele sharing indicative of introgression
- Use Phylonetwork approaches to infer phylogenetic networks rather than bifurcating trees
- Implement coalescent simulations to determine whether observed discordance exceeds expectations under ILS alone
Case Study - Eucalyptus subgenus Eudesmia: A target capture study of 22 Eucalyptus species revealed extreme gene tree discordance increasing with phylogenetic depth. While species-level relationships were well-supported, deeper relationships remained unresolved despite extensive filtering approaches. Analyses confirmed that both ILS and introgression contributed to the observed discordance, consistent with the group's rapid radiation and life history traits (long-lived plants with large population sizes) [9].
Table 3: Research Reagent Solutions for Phylogenomic Convergence Studies
| Reagent/Resource | Function | Application Notes |
|---|---|---|
| Taxon-Specific Bait Kits | Target capture of orthologous loci | Custom design improves gene recovery; e.g., 568-gene Eucalyptus kit [9] |
| Orthology Assessment Tools | Identify true orthologs versus paralogs | Critical for avoiding hidden paralogy confounds (OrthoFinder, BUSCO) |
| Coalescent Simulation Software | Generate null expectations for gene tree discordance | Assess whether observed conflict exceeds ILS expectations (ms, COAL) |
| Population Genomic Dataset | Sample multiple individuals per species | Enables distinction of shared polymorphism versus introgression |
| Comparative Genomic Platform | Integrated analysis of phenotype and genotype data | Essential for linking convergent traits to genomic basis (ENSEMBL Compara) |
Integrated Workflow for Distinguishing Convergence
A robust analytical workflow for distinguishing convergent evolution from other sources of similarity requires integration of multiple data types and analytical approaches.
Integrated Analysis Workflow
This integrated approach begins with comprehensive phenotypic and genomic data collection, proceeds through gene tree and species tree reconstruction, quantifies discordance, and applies statistical tests to distinguish between convergence, ILS, and introgression. The workflow emphasizes that these processes are not mutually exclusive and may operate simultaneously in evolutionary histories.
Addressing convergent evolution within the framework of gene tree discordance research requires careful integration of genomic, phenotypic, and phylogenetic data. The key challenge lies in distinguishing genuine convergent adaptation from similarity caused by ILS and introgression, particularly as these processes can produce similar patterns in phylogenetic datasets. Future research directions should focus on:
- Developing improved statistical frameworks for quantifying convergence while explicitly modeling ILS and introgression
- Creating more efficient bait designs that target evolutionarily informative loci across diverse taxonomic groups
- Implementing machine learning approaches to identify complex patterns of convergence in large phylogenomic datasets
- Integrating functional genomic data to validate putative cases of molecular convergence
As phylogenomic datasets continue to grow in size and taxonomic breadth, the approaches outlined in this guide will become increasingly essential for accurately interpreting evolutionary history and distinguishing true convergent evolution from other sources of similarity.
In the field of phylogenomics, accurately discriminating between species lineages and reconstructing evolutionary history hinges on selecting optimal genetic loci. Within the specific context of resolving conflicts between incomplete lineage sorting (ILS) and introgression, locus selection becomes particularly critical. Gene tree discordance—the phenomenon where different genomic regions tell conflicting evolutionary stories—is pervasive across the tree of life [3]. These incongruences can stem from either deep coalescence (ILS), where ancestral polymorphisms persist through multiple speciation events, or from hybridization and introgression, where genetic material is exchanged between already-diverged lineages [4] [67]. Distinguishing between these processes requires carefully selected markers with specific properties that can capture different aspects of evolutionary history.
Traditional phylogenetic studies often relied on a limited number of markers, such as nuclear ribosomal ITS and plastid genes [2]. However, the advent of high-throughput sequencing has enabled researchers to generate genome-scale datasets, presenting both opportunities and challenges for locus selection. The strategic selection of loci is no longer merely about finding variable regions; it involves identifying markers with the appropriate evolutionary rates, genomic contexts, and phylogenetic signals to disentangle complex evolutionary histories [2] [78]. This technical guide provides a comprehensive framework for optimizing locus selection to discriminate between ILS and introgression, complete with methodological protocols, analytical tools, and practical applications for researchers working in evolutionary biology and phylogenomics.
Theoretical Foundations: Incomplete Lineage Sorting vs. Introgression
Biological Processes Underlying Gene Tree Discordance
Incomplete lineage sorting and introgression represent distinct biological processes that leave characteristic signatures in genomic data. ILS occurs when the coalescence of gene lineages predates speciation events, causing ancestral polymorphisms to be randomly sorted into descendant species [67]. This process is more likely when speciation events occur in rapid succession (short internal branches on the species tree) and/or when population sizes are large [79]. In contrast, introgression involves the transfer of genetic material between species through hybridization, followed by backcrossing, resulting in genes that have evolutionary histories discordant from the species tree due to lateral transfer rather than ancestral inheritance [4] [67].
The key distinction between these processes lies in their expected patterns of gene tree discordance. Under pure ILS, discordance follows a predictable distribution based on the multispecies coalescent model, with gene tree heterogeneity correlated with the lengths of internal branches on the species tree [79]. Introgression, however, produces localized discordance concentrated in genomic regions that have been transferred between species, often creating "islands" of discordance in a sea of concordance [80]. Understanding these theoretical expectations is fundamental to developing effective locus selection strategies.
Implications for Locus Selection Strategy
The different signatures of ILS and introgression necessitate different approaches to locus selection. For distinguishing ILS, researchers should select loci that are distributed evenly across the genome, have minimal linked selection, and represent a range of evolutionary rates [79] [3]. These properties allow for comprehensive sampling of coalescent histories and accurate estimation of species tree parameters. In contrast, detecting introgression requires targeted selection of loci that may be subject to adaptive introgression or that reside in genomic regions with reduced barriers to gene flow [80]. Additionally, comparing loci from different genomic compartments (nuclear, plastid, mitochondrial) can reveal discordance patterns indicative of historical introgression, especially in plants where plastid capture is common [2] [3].
Properties of Informative Loci for Discrimination
Phylogenetic Signal and Evolutionary Rate
The evolutionary rate of a locus significantly impacts its utility for discriminating between ILS and introgression. Loci with moderate to high evolutionary rates provide sufficient phylogenetic signal for resolving recently diverged lineages, which is crucial for detecting short internal branches prone to ILS [2]. However, extremely fast-evolving loci may accumulate multiple hits and suffer from substitution saturation, obscuring true phylogenetic relationships. Conversely, slow-evolving loci conserve signal for deeper relationships but may lack resolution for recent divergences. Studies on Fagaceae have demonstrated that loci with consistent phylogenetic signals ("consistent genes") are more likely to recover the species tree topology compared to those with conflicting signals ("inconsistent genes"), even though these categories do not differ significantly in standard sequence characteristics [3].
Genomic Context and Functional Properties
The genomic context of a locus—including its linkage relationships, recombination rate, and functional constraints—profoundly influences its utility for discrimination analysis. Loci in regions of low recombination are more likely to display linked genealogical histories, making them useful for detecting introgression through localized ancestry patterns [80]. In studies of admixed populations, linked selection can cause the overestimation of selection coefficients and the number of selected sites when not properly accounted for [80]. Functionally, loci under selective constraints may exhibit different patterns of discordance compared to neutral loci. For example, conserved regulatory regions or protein-coding genes under purifying selection may resist introgression even when surrounding regions experience gene flow, creating heterogeneity in discordance patterns across the genome [80] [78].
Multi-locus Interaction and Combinatorial Power
Perhaps the most significant advancement in locus selection strategies is the recognition that the discriminatory power of a set of loci is not merely additive but can emerge from interactions between loci [81]. Methods that evaluate the "informativeness" of gene sets by considering multi-locus expression profiles can identify important genes that would be overlooked by individual-gene approaches [81]. These genes may have weak marginal information but strong interaction information, making them particularly valuable for discrimination tasks in the context of ILS and introgression. The combinatorial power of multiple loci allows researchers to capture complex evolutionary patterns that single loci cannot reveal independently.
Table 1: Key Properties of Informative Loci for Discriminating ILS vs. Introgression
| Property Category | Specific Property | Relevance to ILS Detection | Relevance to Introgression Detection |
|---|---|---|---|
| Evolutionary Rate | Substitution rate | Provides resolution for short internal branches | Helps date introgression events |
| Clock-likeness | Improves coalescent time estimation | Facilitates comparison across loci | |
| Genomic Context | Recombination rate | Identifies regions with independent genealogies | Reveals localized introgression blocks |
| Functional category | Neutral loci reflect demographic history | Adaptively introgressed loci under selection | |
| Phylogenetic Quality | Gene tree resolution | Reduces estimation error confounding ILS | Clearer signal of topological discordance |
| Concordance factors | Quantifies expected vs. observed discordance | Identifies excess discordance from gene flow | |
| Inter-locus Dynamics | Interaction information | Captures multi-locus coalescent patterns | Reveals coordinated ancestry patterns |
Methodological Approaches for Locus Selection
Backward Elimination Screening for Multigene Profiles
The Multigene Profile Association (MPAS) method represents a sophisticated approach to locus selection that leverages interaction information among genes [81]. This method begins with discretizing gene expression values into states (e.g., high, normal, low) using k-means clustering, which reduces data complexity and increases resistance to outliers. The core of MPAS involves a backward elimination process on random gene subsets, where the Multigene Profile Difference (MPD) score quantifies the association between multigene expression profiles and class labels (e.g., species assignments). For each gene in a subset, the method calculates a Multigene Profile Association Score (MPAS) that measures how the removal of that gene affects the MPD. Genes are recursively eliminated to maximize information content, and the process is repeated across numerous random subsets to rank genes by their aggregated return frequencies [81].
The signed Multigene Profile Association (sMPAS) method extends this approach by operating directly on original expression values without discretization [81]. Inspired by spatial statistics methods for marked point processes, sMPAS computes for each sample its distance to the nearest neighbors within the same class and to the nearest neighbors in the other class. The sMPAS information score is then defined as the sign test statistic on these distance pairs, identifying genes whose expression patterns segregate sample classes. Both MPAS and sMPAS have demonstrated approximately 20% improvement in classification power compared to conventional methods that evaluate genes individually, highlighting the value of interaction-aware selection approaches [81].
Quartet Concordance Factor Analysis
Quartet-based methods provide a powerful framework for analyzing gene tree discordance and selecting informative loci [79]. The approach involves examining all possible combinations of four taxa (quartets) and calculating concordance factors—the frequencies with which each of the three possible resolved quartet topologies appears across gene trees. These concordance factors are visualized using simplex plots, which provide an intuitive representation of gene tree discordance across the entire dataset in a single image [79]. Under the multispecies coalescent model (without introgression), the expected distribution of quartet concordance factors follows a specific pattern that can be derived from the species tree and branch lengths.
Significant deviations from expected concordance factor distributions can indicate introgression or other processes beyond ILS [79]. The method involves statistical tests that quantify the deviation between observed and expected concordance factors, helping researchers identify loci whose discordance patterns suggest introgression rather than pure ILS. This approach is particularly valuable because it can be applied without prior specification of a network or introgression model, serving as an exploratory tool to determine whether simple ILS explanations are sufficient or whether more complex models involving introgression are needed [79].
Ancestry-Based Selection Scanning in Admixed Populations
For systems with known or suspected admixture, methods that leverage local ancestry patterns can powerfully identify loci involved in introgression. Recent advancements, such as multi-locus selection scanning in admixed populations, address the challenge of detecting multiple linked selected sites [80]. Traditional methods that model selection at single sites often overestimate selection coefficients and the number of selected sites when multiple linked sites are under selection. The AHMM_MLS tool implements a hidden Markov model approach that calculates the expected local ancestry landscape for a given multi-locus selection model and then maximizes the likelihood of the model [80]. This method can accurately detect the number of selected sites, their locations, and their selection coefficients even when they are in linkage, providing a more realistic picture of introgression dynamics.
The application of this approach to admixed populations of Drosophila melanogaster and Passer italiae revealed that analyses ignoring linkage among selected sites overestimate both the number of selected sites and their selection coefficients [80]. This demonstrates the importance of using multi-locus selection models for accurate inference of introgression history and highlights how careful locus selection must account for linkage relationships among candidate markers.
Table 2: Comparison of Locus Selection Methods and Their Applications
| Method | Underlying Principle | Data Requirements | Strengths | Limitations |
|---|---|---|---|---|
| MPAS/sMPAS [81] | Multigene interaction information | Gene expression data | Captures weak-signal genes with strong interactions; ~20% improvement in classification | Performance depends on discretization parameters (MPAS) |
| Quartet Concordance Factors [79] | Distribution of quartet topologies across loci | Multi-locus sequence data | Visualizes overall discordance pattern; tests ILS vs. introgression | Requires sufficient taxon sampling; computational intensity |
| Ancestry HMM-MLS [80] | Local ancestry patterns in admixed populations | Genotype data from admixed populations | Handles linked selected sites; avoids overestimation of selection | Specific to admixed populations with known source populations |
| GWAS Preselection [78] | Marker-trait associations | Phenotype and genotype data | Identifies loci with large effects on specific traits | May miss small-effect loci; requires phenotypic data |
Experimental Design and Workflow
The process of optimizing locus selection for discriminating ILS and introgression follows a systematic workflow that integrates data generation, computational analysis, and iterative refinement. The diagram below illustrates this comprehensive workflow:
Diagram 1: Workflow for Optimized Locus Selection
Data Collection and Orthology Assessment
The initial phase involves comprehensive data collection from transcriptomic or genomic resources. For the Tulipeae tribe study, researchers newly sequenced 50 transcriptomes from 46 species and supplemented these with 15 previously published transcriptomes [2]. Orthology assessment is then critical to ensure comparability across loci and species. Tools such as OrthoFinder or BUSCO identify single-copy orthologs that provide the fundamental units for subsequent analysis. This step minimizes artifacts arising from paralogy, which can confound discrimination between ILS and introgression. The output is a set of orthologous loci that form the candidate pool for selection optimization.
Gene Tree Inference and Discordance Analysis
Each orthologous locus undergoes phylogenetic analysis to infer gene trees. Software such as IQ-TREE or RAxML implements maximum likelihood methods to reconstruct tree topologies with branch support values [2] [3]. The resulting gene trees are then subjected to discordance analysis using quartet-based methods or similar approaches that quantify topological conflicts across the genome [79]. In the Fagaceae study, researchers calculated "site concordance factors" and "site discordance factors" to identify phylogenetic nodes with high or imbalanced discordance [3]. This analysis helps identify loci that deviate from the dominant phylogenetic signal and may represent cases of ILS or introgression.
Selection Filtering and Model Testing
Based on the discordance analysis and locus properties, researchers apply selection filters to identify the most informative loci for discrimination. Criteria include evolutionary rate, missing data thresholds, GC content, and phylogenetic utility scores. The selected locus set is then used for species tree inference under the multispecies coalescent model using tools like ASTRAL [2] [67]. Subsequently, formal tests for introgression, such as D-statistics, PhyloNet, or HyDe, are applied to assess whether observed discordance patterns exceed expectations under pure ILS [2] [4]. The results from these tests provide feedback for refining locus selection in an iterative process that optimizes discrimination power.
Case Studies and Empirical Validation
Tulipeae Tribe (Liliaceae)
Research on the Tulipeae tribe, which includes tulips (Tulipa) and related genera, provides an excellent case study in optimizing locus selection for discriminating ILS and introgression. Previous studies using limited nuclear (mostly nrITS) and plastid sequences resulted in low-resolution trees and uncertain classifications [2]. A transcriptome-based approach analyzing 2,594 nuclear orthologous genes revealed pervasive ILS and reticulate evolution among Amana, Erythronium, and Tulipa [2]. The study found that different genomic compartments (plastid vs. nuclear) told conflicting stories, with plastid data supporting a sister relationship between Erythronium and Amana, while nuclear data placed Tulipa and Amana as sisters in some analyses [2]. This cytonuclear discordance suggested ancient introgression events, confirmed through D-statistics and QuIBL analyses. The case highlights how careful locus selection from both genomic compartments enables researchers to detect complex evolutionary histories that would be missed with limited marker sets.
Asian Warty Newts (Paramesotriton)
In Asian warty newts, phylogenomic analysis using restriction-site associated DNA sequencing revealed that ILS was the primary cause of gene tree discordance, supplemented by pre-speciation introgression events [4]. Researchers identified specific hybridization events between P. longliensis and an unidentified Paramesotriton lineage, with evidence suggesting that P. zhijinensis may be of hybrid origin [4]. The study successfully reconstructed robust species relationships despite these complexities by selecting appropriate loci and applying multi-method analyses combining ASTRAL, HyDe, Dsuite, and PhyloNet. This case demonstrates how optimized locus selection enables phylogenetic resolution even in systems with extensive reticulation, and how the integration of geographic and paleoclimatic data with phylogenomic results can provide insights into speciation mechanisms—in this case, an erosion-driven speciation model related to karst mountain geomorphology [4].
Petunia and Related Genera (Solanaceae)
Research on Petunia and related genera (Calibrachoa and Fabiana) illustrates how locus selection strategies can unravel complex evolutionary histories involving both ancient and ongoing gene flow [67]. Transcriptome data from 11 Petunia, 16 Calibrachoa, and 10 Fabiana species revealed that gene tree discordance within genera was linked to hybridization events along with high levels of ILS due to rapid diversification [67]. Network analyses estimated deeper hybridization events between Petunia and Calibrachoa—genera with different chromosome numbers that cannot hybridize at present—suggesting that ancestral hybridization played a role in their parallel radiations [67]. This case demonstrates the importance of selecting sufficient loci to capture both recent and ancient introgression events and highlights how locus selection optimized for detecting ILS versus introgression can reveal surprising evolutionary histories even between currently incompatible lineages.
The Scientist's Toolkit: Essential Research Reagents and Solutions
Table 3: Essential Research Reagents and Computational Tools for Locus Selection Studies
| Tool Category | Specific Tools | Primary Function | Application Context |
|---|---|---|---|
| Sequence Alignment | MAFFT, MUSCLE | Multiple sequence alignment | Preprocessing of locus data |
| Orthology Assessment | OrthoFinder, BUSCO | Identification of orthologous genes | Locus selection filtering |
| Gene Tree Inference | IQ-TREE, RAxML | Maximum likelihood tree inference | Gene tree estimation |
| Species Tree Inference | ASTRAL, SVDquartets | Coalescent-based species tree inference | Species tree estimation under ILS |
| Discordance Analysis | IQ-TREE (concordance factors), PhyParts | Quantification of gene tree conflict | ILS vs. introgression assessment |
| Introgression Tests | D-suite, HyDe, PhyloNet | Detection and quantification of gene flow | Introgression identification |
| Visualization | MSCquartets, DensiTree | Visualization of discordance and uncertainty | Data interpretation and presentation |
| Selection Scanning | AHMM_MLS | Multi-locus selection detection in admixed populations | Introgression scanning in hybrids |
Optimizing locus selection for discriminating between incomplete lineage sorting and introgression requires a multifaceted approach that considers evolutionary rates, genomic context, phylogenetic signal, and multi-locus interactions. Methodological advances in backward elimination screening, quartet concordance factor analysis, and ancestry-based selection scanning provide powerful tools for identifying the most informative loci [81] [79] [80]. As phylogenomic datasets continue to grow in size and complexity, the strategic selection of loci will become increasingly important for accurate inference of evolutionary history.
Future developments in locus selection will likely incorporate machine learning approaches to predict locus utility based on sequence features and evolutionary characteristics. Additionally, methods that simultaneously model ILS and introgression while accounting for locus-specific properties will provide more integrated frameworks for discrimination. As these techniques mature, they will enhance our ability to reconstruct evolutionary history accurately, even in the most challenging systems characterized by rapid radiation and extensive gene flow. The continued refinement of locus selection strategies represents a crucial frontier in resolving the tree of life's most stubborn phylogenetic conflicts.
Empirical Evidence and Diagnostic Patterns: Case Studies Across the Tree of Life
The reconstruction of evolutionary histories is fundamentally complicated by phylogenetic discordance, where gene trees derived from different genomic regions conflict with the species tree. Two primary biological processes underlie this phenomenon: Incomplete Lineage Sorting (ILS), the failure of ancestral genetic polymorphisms to coalesce within the population divergence time, and introgression, the transfer of genetic material between species via hybridization [82] [64]. Disentangling their relative contributions is critical for accurate phylogenetic inference and understanding evolutionary mechanisms.
This whitepaper provides an in-depth technical examination of ILS and introgression, framed within a broader thesis on gene tree discordance research. Using two complex plant families—Fagaceae (oak family) and Liliaceae (lily family, specifically tribe Tulipeae)—as case studies, we synthesize current phylogenomic methodologies, quantitative findings, and experimental protocols. These families exemplify how rapid radiations and historical hybridization shape phylogenetic patterns across deep and intermediate evolutionary timescales.
Core Concepts and Analytical Framework
- Incomplete Lineage Sorting (ILS): ILS occurs when the time between successive speciation events is too short for ancestral polymorphisms to sort out randomly into descendant lineages. This results in gene trees that reflect the retention of ancestral alleles rather than the true species divergence history. ILS is prevalent in scenarios of rapid diversification and is modeled by the multi-species coalescent process [64].
- Introgression: Introgression, or reticulate evolution, involves the transfer of genetic material from one species into the gene pool of another through hybridization and repeated backcrossing. This creates phylogenetic signals that traverse species boundaries, leading to gene trees that are discordant with the species tree due to lateral gene transfer [82].
- Interplay and Distinction: While both processes produce gene tree discordance, they are fundamentally different. ILS is a stochastic process inherent to the coalescent, whereas introgression results from contact and gene flow between populations. Accurately distinguishing between them requires specific phylogenetic tests and genome-scale data [64].
Phylogenomic Workflows for Discriminating ILS and Introgression
Modern phylogenomics employs integrated workflows to dissect discordance. The following diagram illustrates a generalized analytical pipeline applied to both Fagaceae and Liliaceae studies.
Case Study I: Phylogenomic Discordance in Fagaceae
The oak family (Fagaceae), a dominant Northern Hemisphere lineage, provides a classic example of deep-scale phylogenetic discordance driven by ancient rapid radiation and hybridization [83].
Evolutionary Context and Phylogenetic Challenges
Fagaceae comprises approximately 900 species across eight genera. Molecular dating indicates that the hypogeous seed (HS) clade, which includes Quercus (oaks), Castanea (chestnuts), and Lithocarpus (stone oaks), originated and diversified rapidly following the Cretaceous-Paleogene (K-Pg) boundary [83]. This rapid radiation, occurring within a 15-million-year window, created conditions ripe for ILS. Furthermore, frequent hybridization, particularly within the genus Quercus, introduces pervasive introgression, complicating phylogenetic estimates [83] [84].
Quantitative Discordance Patterns
Genome-scale analyses reveal extensive conflict among nuclear, plastid (cpDNA), and mitochondrial (mtDNA) genomes.
Table 1: Quantified Gene Tree Discordance in Fagaceae
| Genomic Compartment | Key Discordant Relationship | Inferred Primary Cause | Support Metric / Proportion of Genes |
|---|---|---|---|
| Nuclear Genome | Quercus, Notholithocarpus, Chrysolepis, Lithocarpus (QNCL node) | ILS & Introgression | ~34% of genes supported Lithocarpus & Quercus as sister [84] |
| Plastid (cpDNA) Genome | New World vs. Old World clade division | Ancient Introgression (Plastid Capture) | Strongly supported topology conflicting with nuclear genome [21] |
| Mitochondrial (mtDNA) Genome | New World vs. Old World clade division | Ancient Introgression | Strongly supported topology conflicting with nuclear genome [21] |
| All Compartments | - | Relative Contribution: Gene Tree Estimation Error (21.2%), ILS (9.8%), Gene Flow (7.8%) | Variance decomposition from 2124 nuclear loci [21] |
Detailed Experimental Protocol: Fagaceae
The following methodology outlines the integrated approach for analyzing discordance in Fagaceae [83] [21].
Taxon Sampling and Sequencing:
- Sample 122 individuals representing 91 species across all eight Fagaceae genera.
- Utilize transcriptome sequencing or target capture to obtain data from nuclear and organellar genomes.
Dataset Assembly:
- Nuclear: Assemble 2124 nuclear orthologous loci using tools such as OrthoFinder.
- Plastid: Assemble whole plastomes or a standard set of protein-coding genes (PCGs).
- Mitochondrial: De novo assemble a mitochondrial genome (e.g., from Castanopsis eyrei) as a reference. Map reads, call SNPs, and rigorously filter to remove nuclear copies of mitochondrial DNA (NUMTs) and plastid-derived sequences.
Phylogenetic Inference:
- Apply both concatenation-based (Maximum Likelihood in IQ-TREE, Bayesian Inference in MrBayes) and coalescent-based (ASTRAL-III, SVDquartets) methods to each genomic dataset.
Incongruence Detection:
- Compare topologies and support values (UFboot, PP) across trees from nuclear, plastid, and mitochondrial datasets to identify strongly conflicting nodes.
Testing Evolutionary Hypotheses:
- D-Statistics (ABBA-BABA): Test for introgression using the D-statistic framework in packages like Dsuite. A significant positive D-value indicates gene flow.
- Phylogenetic Networks: Use PhyloNet to infer phylogenetic networks that explicitly model hybridization events.
- Gene Genealogy Interrogation (GGI): Analyze the distribution of gene tree topologies to quantify the support for alternative relationships and correlate them with genomic features.
Case Study II: Phylogenomic Discordance in Liliaceae Tribe Tulipeae
The tulip tribe (Tulipeae) within Liliaceae presents a compelling case of unresolvable phylogenetic relationships among closely related genera due to the compounded effects of ILS and introgression [82] [2].
Evolutionary Context and Phylogenetic Challenges
Tulipeae includes four genera: Tulipa (tulips, ~76 spp.), Amana, Erythronium, and Gagea. A primary challenge is resolving the relationships among Amana, Erythronium, and Tulipa. Studies based on limited markers (e.g., nrITS, plastid loci) have yielded conflicting topologies, supporting all possible resolutions [82]. The genus Tulipa is noted for its very large genome size, making whole-genome sequencing prohibitive and favoring transcriptome-based approaches [82] [2].
Quantitative Discordance Patterns
Recent transcriptomic studies reveal pervasive discordance that thwarts a definitive species tree estimate for the core Tulipeae genera.
Table 2: Quantified Phylogenetic Discordance in Liliaceae Tribe Tulipeae
| Analysis Type | Genomic Dataset | Key Discordant Relationship | Inferred Cause & Notes |
|---|---|---|---|
| Plastid Phylogeny | 74 Plastid PCGs | Topology: (Gagea, (Tulipa, (Erythronium, Amana))) | Well-supported but potentially mislead by plastid capture [82] |
| Nuclear Phylogeny (ML/MSC) | 2,594 Nuclear OGs | Topology: (Gagea, (Erythronium, (Tulipa, Amana))) | Weakly supported in coalescent tree; alternative topology with different gene set [2] |
| Nuclear Phylogeny (Subset) | 1,594 Nuclear OGs | Topology: (Gagea, (Tulipa, (Erythronium, Amana))) | Demonstrates sensitivity of topology to gene set selection [2] |
| Statistical Analysis | D-Statistics, QuIBL | Relationships among Amana, Erythronium, Tulipa | Pervasive ILS and Reticulate Evolution; "reliable and unambiguous evolutionary history" not reconstructible [82] |
Detailed Experimental Protocol: Tulipeae
The methodology for Tulipeae emphasizes the use of transcriptomics to navigate large genomes and specialized tests for ILS and introgression [82] [2].
Transcriptome Sequencing and Assembly:
- Collect fresh leaf or meristem tissue from 46+ Tulipeae species, ideally from common gardens to minimize environmental effects.
- Perform RNA extraction using a modified CTAB method with PVPP to remove polysaccharides and polyphenols.
- Sequence total RNA using standard RNA-Seq protocols. De novo assemble transcriptomes for each species.
Orthologous Group Construction:
- Use tools like OrthoFinder to identify groups of orthologous genes (OGs) across all sampled species. Filter to retain a high-confidence set (e.g., 2,594 OGs).
Phylogenomic Analyses:
- Construct both plastid (74 PCGs) and nuclear (2,594 OGs) datasets.
- Reconstruct species trees using Maximum Likelihood (IQ-TREE) and Multi-Species Coalescent (ASTRAL) methods.
Interrogating Gene Tree Discordance:
- Calculate Site Concordance Factors (sCF) and Site Discordance Factors (sDF1/sDF2) in IQ-TREE to identify nodes with high or imbalanced gene tree conflict.
- For conflicting nodes, perform polytomy tests to evaluate if the data significantly rejects a bifurcating model in favor of a multifurcation (consistent with ILS).
- Construct phylogenetic networks using SplitsTree or PhyloNet to visualize conflicting signals.
Testing ILS vs. Introgression:
- D-Statistics: Apply the D-statistic test to four-taxon groupings (e.g., ((Amana, Erythronium), Tulipa, Outgroup)) to detect significant asymmetry in allele patterns indicative of introgression.
- QuIBL (Quantitative Introgression Branch Length): Use QuIBL to estimate the timing of introgression events and distinguish them from the expected signals of ILS.
The Scientist's Toolkit: Key Research Reagents and Solutions
Successful discrimination of ILS and introgression relies on a suite of computational tools and analytical reagents.
Table 3: Essential Research Reagents and Tools for Phylogenomic Discordance Analysis
| Category / Reagent Solution | Specific Tool / Technique | Primary Function | Application Context |
|---|---|---|---|
| Sequencing & Assembly | RNA-Seq (Transcriptomics) | Cost-effective gene sampling for large genomes | Liliaceae Tulipeae [82] [2] |
| GetOrganelle | De novo assembly of plastid & mitochondrial genomes | Fagaceae mtDNA assembly [21] | |
| Orthology & Alignment | OrthoFinder | Inference of orthologous groups from transcriptomes | Nuclear OG construction [82] [83] |
| Phylogenetic Inference | IQ-TREE (ML) | Concatenation-based phylogeny with model testing | Standard tree building [82] [21] |
| ASTRAL (MSC) | Species tree inference from gene trees accounting for ILS | Coalescent-based species tree [82] [83] | |
| Discordance Metrics | Site Concordance/Discordance Factors (sCF/sDF) | Quantifies per-site support for alternative topologies | Identifies nodes with high conflict [82] |
| Introgression Tests | D-Statistic (ABBA-BABA) | Detects allele sharing asymmetry from gene flow | Tests for historic introgression [82] [83] |
| PhyloNet | Infers phylogenetic networks from gene trees | Models hybridization events [83] | |
| ILS Tests | Polytomy Test | Evaluates if a node is better represented as a polytomy | Supports ILS in rapid radiations [82] |
| QuIBL | Estimates introgression timing vs. ILS | Distinguishes ILS from introgression signals [82] | |
| Data Visualization | Highcharts, Graphviz | Creates accessible, compliant data visualizations | Diagramming workflows and results [85] |
Integrated Discussion and Synthesis
The parallel investigations into Fagaceae and Liliaceae Tulipeae reveal a common theme: deep or rapid evolutionary radiations create a scaffold of incomplete lineage sorting upon which subsequent introgression acts, generating a complex landscape of phylogenetic discordance.
In Fagaceae, the rapid diversification of the HS clade post-K-Pg boundary established a strong ILS signal [83]. This was later overprinted by ancient introgression events, evidenced by the strong conflict between cytoplasmic (cpDNA/mtDNA) and nuclear phylogenies [21]. Decomposition analysis quantifies the significant role of gene flow alongside ILS [21]. In Tulipeae, the relationship between Amana, Erythronium, and Tulipa is so profoundly affected by both processes that a definitive species tree remains elusive with current data and methods [82] [2]. The topology is highly sensitive to the genomic compartment (plastid vs. nuclear) and even the specific set of nuclear genes analyzed.
These case studies underscore that a single "true tree" may be an inaccurate representation of evolutionary history for many groups. Instead, a phylogenetic network that captures the web of shared ancestry due to both vertical descent and horizontal gene flow is often a more appropriate model. The methodological progression from simple tree-building to sophisticated discordance analysis—integrating concatenation and coalescent approaches, D-statistics, phylogenetic networks, and polytomy tests—is essential for advancing beyond topological contradictions to a richer understanding of evolutionary dynamics.
The evolutionary history of primates is characterized not by a simple, bifurcating tree, but by a complex network of divergences and subsequent genetic exchanges. Phylogenetic conflict, where gene trees differ in topology from each other and from the species tree, is pervasive throughout the primate order [86]. For decades, the prevailing model of hominid evolution posited a clean divergence of human, chimpanzee, and gorilla lineages. However, advanced phylogenomic analyses now reveal that ancient gene flow and incomplete lineage sorting (ILS) have significantly shaped primate genomes [86] [87]. Distinguishing between these two processes—ILS, the retention of ancestral polymorphisms across successive speciation events, and introgression, the transfer of genetic material between diverging lineages—represents a fundamental challenge in evolutionary genomics [87]. This technical guide examines the methodologies and findings that are illuminating the complex evolutionary history of primates, with profound implications for understanding the mechanisms of speciation and the interpretation of genomic diversity.
Methodological Framework: Disentangling Evolutionary Processes
Genomic Data Acquisition and Assembly
Modern phylogenomics relies on high-quality reference genomes as the foundation for comparative analyses. The sequencing of primate genomes typically involves a combination of Illumina short-read and Pacific Biosciences long-read technologies to achieve assemblies with high contiguity [86]. As summarized in Table 1, key metrics for assessing assembly quality include scaffold N50, contig N50, and completeness based on Benchmarking Universal Single-Copy Orthologs (BUSCO). For example, the assembly of the pig-tailed macaque (Macaca nemestrina) genome resulted in 2.95 Gb across 9,733 scaffolds with a scaffold N50 of 15.22 mb [86].
Table 1: Genomic Assembly Metrics for Representative Primate Species
| Species | Assembly Total Length (Gb) | Number of Scaffolds | Scaffold N50 (mb) | Contig N50 (kb) | Protein-Coding Genes | BUSCO (%) |
|---|---|---|---|---|---|---|
| Colobus angolensis ssp. palliatus | 2.97 | 13,124 | 7.84 | 38.36 | 20,222 | 95.82% |
| Macaca nemestrina | 2.95 | 9,733 | 15.22 | 106.89 | 21,017 | 95.98% |
| Mandrillus leucophaeus | 3.06 | 12,821 | 3.19 | 31.35 | 20,465 | 95.45% |
Phylogenetic Inference and Detection of Discordance
The standard analytical workflow involves estimating both species trees and gene trees using thousands of loci. Species trees are typically reconstructed using concatenation-based methods (e.g., Maximum Likelihood in IQ-TREE) and multi-species coalescent (MSC) methods (e.g., ASTRAL) [2] [86]. High levels of gene tree discordance around specific branches provide initial evidence for potential introgression or ILS [86]. Researchers then calculate metrics such as "site concordance factors" (sCF) to quantify discordance patterns [2].
Distinguishing Introgression from Incomplete Lineage Sorting
Several statistical methods have been developed to differentiate introgression from ILS:
- ABBA-BABA tests (D-statistics): Detect asymmetric patterns of gene tree discordance consistent with introgression [2] [87]. These tests are implemented in packages like HyDe and Dsuite [4] [88].
- QuIBL (Quantifying Introgression via Branch Lengths): Analyzes triplets of taxa to assess whether gene tree branch lengths are better explained by ILS or introgression models [2] [88].
- Aphid: An approximate likelihood method that leverages the fact that gene trees affected by gene flow tend to have shorter branches, while those affected by ILS have longer branches than the average gene tree [87].
- PhyloNet: Uses phylogenetic networks to model explicit reticulate evolutionary histories [4].
Figure 1: Computational Workflow for Discriminating ILS and Introgression. The pipeline progresses from raw genomic data to integrated evolutionary inference using multiple complementary analytical methods.
Case Studies in Primate Evolution
Hominid Evolution: Human, Chimpanzee, and Gorilla
The phylogenetic relationships among humans, chimpanzees, and gorillas represent a classic example of deep phylogenetic conflict. Application of the Aphid method to coding and non-coding data has revealed that a substantial fraction of the discordance in this group is due to ancient gene flow rather than solely ILS [87]. This method accounts for among-loci variance in mutation rate and gene flow time, providing estimates of speciation times and ancestral effective population size. The analysis predicts older speciation times and smaller estimated effective population sizes for these taxa compared to analyses that assume no gene flow [87].
Guenon Radiation: Widespread Ancestral Hybridization
Guenons (tribe Cercopithecini) represent one of the world's largest primate radiations, with whole-genome sequencing of 22 species revealing that rampant gene flow characterizes their evolutionary history [89]. Researchers identified ancient hybridization across deeply divergent lineages that differ in ecology, morphology, and karyotypes. Some hybridization events resulted in mitochondrial introgression between distant lineages, likely facilitated by cointrogression of coadapted nuclear variants [89]. The genomic landscapes of introgression, while largely lineage-specific, showed overrepresentation of genes with immune functions, suggesting adaptive introgression. Conversely, genes involved in pigmentation and morphology may have contributed to reproductive isolation [89]. Notably, some of the most species-rich guenon clades were found to be of admixed origin, suggesting that hybridization may have facilitated diversification [89].
Broader Primate Patterns
Across the primate tree, evidence suggests that recent introgression occurs between species within all major primate groups examined to date [86]. However, detecting introgression that occurred between ancestral lineages (represented by internal branches on a phylogeny) remains more challenging. Modification of existing methods for detecting introgression has revealed additional evidence for gene flow among ancestral primates beyond recently diverged species [86].
Table 2: Quantitative Evidence of Introgression and ILS Across Primate Lineages
| Primate Group | Key Findings | Primary Methods | Impact on Diversification |
|---|---|---|---|
| Hominids (Human, Chimpanzee, Gorilla) | Substantial ancient gene flow; older speciation times than previously estimated | Aphid, ABBA-BABA | Revised understanding of speciation timeline |
| Guenons (Tribe Cercopithecini) | Rampant ancestral gene flow; mitochondrial introgression between distant lineages | Whole-genome analysis, D-statistics | Hybridization facilitated diversification in species-rich clades |
| Old World Monkeys (Multiple genera) | Widespread genealogical discordance; asymmetric patterns around specific branches | MSC methods, phylogenetic networks | Multiple instances of ancestral introgression identified |
Technical Protocols for Phylogenomic Analysis
Genome Sequencing and Assembly Protocol
- DNA Extraction: Use high-molecular-weight DNA from tissue samples (e.g., from biological repositories like the San Diego Zoo [86]).
- Library Preparation: Construct sequencing libraries following standard Illumina protocols.
- Sequencing: Generate data using Illumina Hi-seq protocols (short-read) supplemented with Pacific Biosciences technology (long-read) for improved assembly [86].
- Genome Assembly: Assemble reads into contigs and scaffolds using appropriate assemblers (e.g., Unicycler [86]).
- Annotation: Annotate protein-coding genes using the NCBI Eukaryotic Genome Annotation Pipeline or similar tools.
- Quality Assessment: Assess assembly completeness using BUSCO with appropriate lineage datasets (e.g., Euarchontoglires ortholog database for primates).
Phylogenetic Analysis and Introgression Testing
- Ortholog Identification: Identify orthologous genes across species using tools like OrthoFinder or similar pipelines.
- Sequence Alignment: Align sequences for each orthologous group using multiple sequence aligners (e.g., MAFFT, MUSCLE).
- Gene Tree Inference: Infer individual gene trees using maximum likelihood methods (e.g., IQ-TREE [86]).
- Species Tree Estimation: Reconstruct species trees using both concatenation (IQ-TREE) and coalescent methods (ASTRAL).
- Discordance Analysis: Calculate concordance factors and identify regions of high gene tree conflict.
- Introgression Tests: Perform D-statistics (ABBA-BABA tests) and QuIBL analyses on specific triplets of taxa showing discordance.
- Network Analysis: Model potential reticulate evolution using PhyloNet or similar network approaches [4].
Table 3: Key Research Reagents and Computational Tools for Phylogenomics
| Resource Type | Specific Examples | Function and Application |
|---|---|---|
| Reference Genomes | Colobus angolensis (GCF000951035.1), Macaca nemestrina (GCF000956065.1) | Baseline for read mapping and comparative genomics [86] |
| Sequence Alignment | BWA [86], Bowtie2 [86] | Mapping sequencing reads to reference genomes |
| Variant Calling | GATK "HaplotypeCaller" [86] | Identifying single nucleotide polymorphisms (SNPs) across samples |
| Genome Assembly | GetOrganelle [86], Unicycler [86] | Assembling mitochondrial and nuclear genomes from sequencing reads |
| Phylogenetic Inference | IQ-TREE [86], MrBayes [86], ASTRAL [2] | Reconstructing species trees and gene trees from sequence data |
| Introgression Detection | HyDe [4], Dsuite [4], Aphid [87] | Testing for signals of hybridization and gene flow between lineages |
| Evolutionary Network Analysis | PhyloNet [4] | Modeling reticulate evolution and inferring phylogenetic networks |
Discussion and Future Directions
The emerging picture from primate phylogenomics confirms that the evolutionary history of our own lineage, along with our primate relatives, is characterized by complexity and interconnection. Rather than representing rare exceptions, both incomplete lineage sorting and introgression appear to be fundamental processes shaping primate evolution [86] [87]. The detection of ancient gene flow between human, chimpanzee, and gorilla lineages, along with widespread introgression in guenons and other primate groups, challenges simplified models of speciation and diversification [89] [87].
Future research directions will likely focus on:
- Refining methodological approaches to better distinguish between ILS and introgression, particularly in deep evolutionary timescales.
- Expanding taxonomic sampling to include understudied primate lineages, enabled by decreasing sequencing costs.
- Integrating functional genomics to understand the adaptive significance of introgressed regions, building on findings that genes with immune functions are overrepresented in introgressing regions [89].
- Developing more sophisticated network models that can accommodate multiple hybridization events and complex demographic histories.
Figure 2: Conceptual Framework of ILS and Introgression. Both processes generate phylogenetic discordance but through distinct evolutionary mechanisms, resulting in a complex reticulate history.
As these research directions mature, our understanding of primate evolution will continue to be refined, offering deeper insights into the mechanisms of speciation and the complex interrelationships among primate lineages. The integration of advanced genomic techniques with sophisticated analytical frameworks promises to further illuminate the legacy of ancient gene flow that has shaped the diversity of primates, including our own species.
The study of trait evolution has been fundamentally reshaped by the recognition that genealogical discordance, primarily driven by incomplete lineage sorting (ILS) and introgression, is pervasive across the tree of life. This technical guide examines the evolutionary dynamics of quantitative traits in the wild tomato genus Solanum, focusing specifically on the effects of introgression against a background of ILS. We present a comprehensive framework that integrates the multispecies network coalescent with Brownian motion models of trait evolution, enabling researchers to disentangle the distinct contributions of introgression and ILS to trait variation. Through a detailed case study of ovule gene expression in wild tomatoes, we provide methodologies for detecting signatures of historical introgression across thousands of quantitative traits simultaneously, offering powerful approaches for resolving complex evolutionary histories in rapidly radiating lineages.
The traditional paradigm of trait evolution along a bifurcating species tree has been challenged by genomic evidence revealing widespread phylogenetic discordance. In rapidly diverging lineages, such as the wild tomato genus Solanum, two biological processes are primarily responsible for this discordance: incomplete lineage sorting (ILS), the failure of gene lineages to coalesce in a population ancestral to the divergence of species, and introgression, the transfer of genetic material between previously isolated species through hybridization and backcrossing [55]. While both processes generate similar patterns of gene tree discordance, they have distinct implications for quantitative trait evolution.
The wild tomato clade (13 species within the genus Solanum) represents an ideal system for studying these phenomena, having radiated within the last 2.5 million years and exhibiting high rates of gene tree discordance due to both ILS and introgression [23]. This genus provides a powerful model for dissecting the effects of introgression on quantitative traits due to the availability of extensive genomic resources, documented histories of hybridization, and the ability to measure thousands of molecular traits simultaneously through transcriptomic approaches.
Theoretical Framework: Modeling Trait Evolution Under Introgression
Brownian Motion on a Species Tree
The Brownian motion (BM) model serves as a fundamental statistical framework for quantitative trait evolution in phylogenetic comparative methods. Under BM, character states at the tips of a phylogeny follow a multivariate normal distribution, with variances and covariances determined by the branch lengths of the phylogeny [55]. For a three-taxon phylogeny with topology ((A,B),C), where species A and B split at time t₁ and species C diverged from their common ancestor at time t₂, the expected variance-covariance matrix T is:
T = | t₂ t₁ 0 | | t₁ t₂ 0 | | 0 0 t₂ |
This matrix is multiplied by the evolutionary rate parameter (σ²) to obtain trait variances and covariances [55]. In the absence of discordance, only species A and B share an internal branch and thus exhibit covariance.
Extending the Model for Introgression and ILS
The standard BM model fails to account for shared evolutionary history not captured by the species phylogeny. To address this limitation, Hibbins and Hahn (2021) developed a Brownian motion model within the multispecies network coalescent framework that incorporates both ILS and introgression [23]. This model predicts how introgression systematically affects trait covariances when averaged across thousands of traits.
The key innovation of this approach is that it uses the multispecies network coalescent to predict the expected frequency and branch lengths of each possible gene tree topology, then weights their contribution to trait covariances according to these frequencies [23]. For a three-taxon case with introgression, this results in non-zero covariance terms between species that do not share recent ancestry in the species tree but have experienced gene flow.
Table 1: Key Parameters in the Multispecies Network Coalescent Model for Quantitative Traits
| Parameter | Description | Biological Interpretation |
|---|---|---|
| σ² | Evolutionary rate parameter | Rate of trait evolution per unit time under Brownian motion |
| t₁, t₂ | Species divergence times | Timing of speciation events in the species tree |
| γ | Introgression rate | Probability of gene flow between lineages per generation |
| τ | Introgression time | Historical timing of introgression event(s) |
| f | Gene tree frequencies | Expected proportion of loci with each gene tree topology |
Case Study: Gene Expression in Wild Tomato Ovules
Experimental System and Design
Hibbins and Hahn (2021) investigated the effects of introgression on quantitative traits using whole-transcriptome expression data from ovules in the wild tomato genus Solanum [90] [23]. Their experimental approach leveraged several key features of this system:
- Biological System: 13 closely related Solanum species with well-characterized phylogenetic relationships and documented evidence of post-speciation introgression
- Trait Measurement: RNA sequencing of ovule tissue to quantify expression levels for thousands of genes simultaneously
- Phylogenetic Framework: Two independent species triplets with differing magnitudes of historical introgression, allowing for comparative analysis
- Genomic Resources: Availability of reference genomes and previously identified introgression events
This experimental design enabled the researchers to test specific predictions about how introgression shapes patterns of trait variation across the genome.
Methodological Workflow
The following diagram illustrates the key analytical workflow used in the wild tomato gene expression study:
Key Findings and Interpretation
The study revealed several crucial patterns linking introgression to quantitative trait evolution:
Trait Covariance Patterns: In both species triplets examined, transcriptome-wide patterns of expression similarity were consistent with histories of introgression, with the magnitude of effect correlated with the rate of introgression [23].
Cis-Regulatory Variation: In the sub-clade with higher introgression rates, researchers observed a correlation between local gene tree topology and expression similarity, implicating introgressed cis-regulatory variation in generating broad-scale patterns of expression divergence [90] [23].
Comparative Signal Strength: The signatures of introgression were quantitatively stronger in the sub-clade with greater historical gene flow, demonstrating that the magnitude of introgression predicts its effect on trait variation [23].
Table 2: Summary of Key Findings from Wild Tomato Gene Expression Study
| Analysis Type | Species Triplet 1 (Lower Introgression) | Species Triplet 2 (Higher Introgression) |
|---|---|---|
| Trait Covariance | Consistent with introgression predictions | Stronger signal consistent with introgression |
| Topology-Trait Correlation | Weak or non-significant | Significant correlation observed |
| Implied Mechanism | Limited effects on trait variation | Substantial cis-regulatory effects |
| Statistical Support | Moderate | Strong |
Distinguishing Introgression from Incomplete Lineage Sorting
Analytical Challenges
Disentangling the effects of introgression from ILS represents a significant challenge in evolutionary genomics, as both processes can produce similar patterns of gene tree discordance. However, several key distinctions enable researchers to differentiate their signatures:
- Genomic Distribution: ILS produces random discordance across the genome, while introgression creates localized blocks of shared ancestry [3]
- Directionality: Introgression often exhibits directional patterns, where specific taxa show excess allele sharing [4]
- Branch Length Patterns: Introgression can produce shorter branch lengths between introgressing taxa compared to expectations under ILS alone [23]
Statistical Framework for Discrimination
The following diagram illustrates the logical relationships and analytical approaches for distinguishing ILS from introgression:
Application in Wild Tomatoes
In the wild tomato system, researchers employed multiple approaches to distinguish introgression from ILS:
- D-statistics: Used to test for excess allele sharing between specific taxa, providing evidence of directional introgression [23]
- QuIBL (Quantitative Introgression Branch Length): Applied to estimate the timing and magnitude of introgression events [23]
- Multispecies Coalescent Modeling: Compared observed discordance patterns to expectations under ILS alone [55]
- Correlation Analyses: Examined relationships between local genealogy and trait similarity, which is not expected under ILS [90]
These analyses confirmed that both processes have shaped the genomic landscape of wild tomatoes, but that introgression has specifically influenced patterns of quantitative trait variation.
Experimental Protocols and Methodologies
Transcriptome Sequencing and Expression Quantification
Detailed protocol for gene expression analysis in wild tomatoes:
- Tissue Collection: Harvest ovule tissue at standardized developmental stages from multiple individuals per species
- RNA Extraction: Use TRIzol-based methods with DNase treatment to obtain high-quality RNA
- Library Preparation: Construct stranded mRNA-seq libraries using polyA selection
- Sequencing: Perform 150bp paired-end sequencing on Illumina platforms to minimum depth of 30 million reads per sample
- Expression Quantification:
- Align reads to reference genome using splice-aware aligners (STAR, HISAT2)
- Quantify gene-level counts using featureCounts or similar tools
- Normalize using TPM (Transcripts Per Million) and perform variance-stabilizing transformation
- Quality Control:
- Assess library complexity and sequencing depth
- Verify sample relationships using correlation analyses
- Remove batch effects using ComBat or similar methods
Phylogenomic Analysis Pipeline
Protocol for inferring phylogenetic relationships and detecting introgression:
Sequence Data Collection:
- Obtain whole-genome or transcriptome sequencing data for all taxa
- Include outgroup species for rooting phylogenetic trees
Ortholog Identification:
- Use OrthoFinder or similar tools to identify orthologous groups
- Perform multiple sequence alignment for each ortholog (MAFFT, PRANK)
Gene Tree Inference:
- Infer maximum likelihood trees for each ortholog (IQ-TREE, RAxML)
- Assess branch support using ultrafast bootstrap or similar methods
Species Tree Estimation:
- Apply multispecies coalescent methods (ASTRAL, SVDquartets)
- Estimate concordance factors and site-based discordance measures
Introgression Testing:
- Calculate D-statistics to test for excess allele sharing
- Use PhyloNet or similar tools to infer phylogenetic networks
- Apply QuIBL to estimate timing and magnitude of introgression
Trait Evolution Analysis
Protocol for analyzing quantitative trait evolution under introgression:
Trait Variance-Covariance Estimation:
- Calculate empirical variance-covariance matrix from trait data
- Compare to expectations under Brownian motion on species tree
Model Fitting:
- Fit Brownian motion models on both species tree and phylogenetic network
- Compare model fit using likelihood ratio tests or information criteria
Trait-Topology Correlation:
- For each gene, correlate expression value with local genealogy
- Test for significant associations using phylogenetic regression
Simulation-Based Validation:
- Simulate trait evolution under different introgression scenarios
- Compare empirical patterns to simulations
Table 3: Key Research Reagent Solutions for Studying Introgression in Wild Tomatoes
| Resource Type | Specific Examples | Function/Application |
|---|---|---|
| Biological Materials | S. pennellii Introgression Lines (ILs) | Fine-mapping QTLs and introgressed regions [91] |
| S. incanum Introgression Lines | Studying drought tolerance and stress responses [92] | |
| Genomic Resources | S. pennellii BAC/cosmid libraries | Physical mapping and comparative genomics [91] |
| Solanaceae Genome Network (SGN) databases | Access to genomes, annotations, and diversity data | |
| Bioinformatic Tools | ASTRAL, MP-EST | Species tree estimation under multispecies coalescent |
| Dsuite, Patterson's D | Introgression testing and visualization | |
| PhyloNet, HyDe | Phylogenetic network inference and hybridization detection | |
| IQ-TREE, RAxML | Gene tree inference with model selection | |
| Analytical Frameworks | Multispecies Network Coalescent | Modeling gene tree discordance from ILS and introgression |
| Brownian Motion on Networks | Quantitative trait evolution under discordance |
Implications and Future Directions
The integration of phylogenetic networks with quantitative trait evolution represents a significant advancement in evolutionary biology, with broad implications beyond wild tomatoes. Studies across diverse taxa—including Asian warty newts [4], Fagaceae [3], and Liliaceae [2]—have demonstrated the prevalence of both ILS and introgression in shaping phylogenetic discordance. The approaches outlined here provide a template for investigating these processes in other systems.
Future research directions include:
- Integration of Selection Models: Developing frameworks that incorporate both neutral and selective processes in trait evolution
- Single-Cell Expression Profiling: Applying high-resolution trait measurement to understand cellular heterogeneity
- Machine Learning Approaches: Utilizing predictive models to identify candidate introgressed loci affecting complex traits
- Extended Taxonomic Sampling: Applying these methods across broader phylogenetic scales to understand macroevolutionary patterns
The wild tomato system continues to provide fundamental insights into how evolutionary processes shape biological diversity, serving as a model for understanding the complex interplay between genealogy, gene flow, and trait evolution.
The evolutionary history of species is often not a simple branching tree but can be better represented by a complex network, shaped by processes such as incomplete lineage sorting (ILS) and introgression. These phenomena create widespread gene tree discordance, where different genomic regions tell conflicting stories about species relationships. The tinamous (Palaeognathae: Tinamidae), an old group that has diversified in South America over millions of years, provide an excellent case study for examining these complex processes [93]. As a member of the palaeognath birds, which include flightless ratites and volant tinamous, understanding their diversification is crucial for reconstructing early avian evolution.
Recent advances in whole-genome sequencing have enabled researchers to move beyond limited molecular markers to investigate genome-wide patterns of discordance. A 2025 phylogenomic study analyzing 80 whole genomes from all 46 recognized tinamou species provides the most complete phylogenetic framework for this group to date, revealing pervasive genome-wide introgression and its role in their evolutionary history [93] [94]. This research offers critical insights into the assembly of the Neotropical biota and serves as a model for understanding how ILS and introgression shape adaptive radiations.
Table: Key Characteristics of the Tinamou Phylogenomic Study
| Aspect | Description |
|---|---|
| Taxonomic Scope | 80 whole genomes representing all 46 recognized tinamou species [93] |
| Genomic Resources | Whole genomes, BUSCO genes, UCEs, autosomal & Z-chromosome markers [94] |
| Evolutionary Timeline | Crown diversification began 30-40 mya with constant rates until present [93] |
| Major Finding | Pervasive genome-wide introgression identified, particularly in one Crypturellus clade [93] |
Theoretical Framework: ILS vs. Introgression
Incomplete lineage sorting and introgression represent distinct biological processes that can produce similar patterns of gene tree discordance, presenting a significant challenge for phylogenetic inference. ILS occurs when ancestral genetic polymorphisms persist through successive speciation events, leading to gene trees that do not match the species tree due to the stochastic nature of allele sorting. In contrast, introgression results from the transfer of genetic material between species through hybridization, followed by backcrossing, creating genomic regions with evolutionary histories that cross species boundaries.
Distinguishing between these processes is methodologically complex. ILS is expected to produce relatively uniform discordance across the genome, while introgression often creates heterogeneous patterns, with specific genomic regions showing stronger evidence of foreign ancestry. The tinamou study employed multiple approaches to disentangle these effects, including comparative analysis of different genomic regions (autosomal vs. Z-chromosome), phylogenetic network analyses, and tests for introgression using f-branch models and ABBA-BABA statistics [93] [94]. The Z-chromosome particularly provided valuable insights, as it often shows distinct patterns of introgression due to its different effective population size and exposure to selection.
The broader context of avian evolution demonstrates the prevalence of these phenomena. Recent analyses of 363 bird species representing 92% of avian families revealed "abundant discordance among gene trees" across the avian tree of life [95]. This massive genomic study found that certain relationships proved difficult to resolve due to "either extreme DNA composition, variable substitution rates, incomplete lineage sorting or complex evolutionary events such as ancient hybridization" [95]. Similarly, studies in other avian groups, including suboscine birds, have demonstrated that introgression varies predictably based on geographic proximity and environmental stability [96].
Tinamou Phylogeny and Divergence History
Evolutionary Relationships
The comprehensive tinamou phylogeny reveals a largely robust structure across most methods and datasets, with one notable exception in the genus Crypturellus, which displayed "substantial species-tree discordance across the different data sets" [93]. This discordance was particularly pronounced in one specific clade within Crypturellus, suggesting a complex evolutionary history potentially influenced by both ILS and introgression. The phylogenetic reconstructions were remarkably consistent across different analytical approaches and genomic partitions, providing confidence in the overall framework.
The study employed multiple data types, including coding regions (BUSCO genes) and ultraconserved elements (UCEs) with varying flanking regions, as well as separate analyses of autosomal and Z-chromosome markers. This multi-faceted approach allowed researchers to assess the consistency of phylogenetic signals across different genomic compartments. The general congruence across datasets suggests that despite the presence of gene tree discordance, the major relationships within tinamous are now well-resolved.
Temporal Framework of Diversification
Using fossil-calibrated tip-dating methods, the study established a detailed timeline of tinamou evolution. Tinamous were found to have diverged from their sister group, the extinct moas, approximately 50-60 million years ago (mya), with the crown group diversification beginning roughly 30-40 mya [93]. This dating places the initial radiation of tinamous during the Oligocene to Eocene transition, a period of significant global climatic changes that likely influenced their diversification.
Unlike many rapid radiations that show early bursts of diversification followed by slowdowns, tinamous exhibited "constant diversification rates until the present" [93]. This pattern suggests a relatively steady accumulation of lineage diversity throughout their evolutionary history, possibly facilitated by the ecological opportunities presented in the evolving South American landscape. The constant rate of diversification contrasts with patterns observed in other avian groups, such as the post-K-Pg radiation of Neoaves, which experienced a sharp increase in diversification rates following the Cretaceous-Palaeogene extinction event [95].
Table: Tinamou Divergence Time Estimates
| Evolutionary Event | Time Estimate (mya) |
|---|---|
| Tinamou-Moa Divergence | 50-60 million years ago [93] |
| Crown Group Diversification | Began 30-40 million years ago [93] |
| Diversification Pattern | Constant rates until present [93] |
Materials and Methods
The study leveraged an unprecedented sampling of 80 whole genomes representing all 46 recognized tinamou species, sourced from both historical study skins and frozen tissues [93] [94]. This comprehensive taxonomic coverage was crucial for capturing the full diversity of the group and resolving species-level relationships. The inclusion of historical specimens required specialized laboratory protocols to account for degraded DNA, highlighting the technical advances that now enable whole-genome sequencing from museum collections.
The genomic data types included:
- BUSCO genes: Highly conserved single-copy orthologous genes used for assessing genome completeness and phylogenetic analysis.
- Ultraconserved Elements (UCEs): Genomic regions conserved across deep evolutionary timescales, analyzed with varying amounts of flanking sequence (100bp, 300bp, 1000bp).
- Autosomal markers: Nuclear markers from the autosomes.
- Z-chromosome markers: Markers from the sex chromosome, which evolves under different evolutionary pressures due to its inheritance pattern and smaller effective population size.
The use of multiple data types allowed researchers to compare phylogenetic signals across different evolutionary rates and selective pressures, providing a more comprehensive view of evolutionary history.
Phylogenetic Inference Methods
The study employed a multifaceted analytical approach to reconstruct tinamou phylogeny and assess discordance:
Species Tree Estimation:
- ASTRAL-III: Used for species tree inference under the multi-species coalescent model, which accounts for ILS [94]. Input gene trees were generated for each locus using maximum likelihood methods.
- Concatenation: Combined analysis of all loci into a supermatrix, implemented using maximum likelihood approaches.
Divergence Time Estimation:
- BEAST2: Employed for fossil-calibrated tip-dating analysis, using 6 fossil calibrations plus the moa divergence to establish a temporal framework [94].
- Filtering: Loci with extreme rate variation or poor clock-like behavior were excluded from dating analyses to improve accuracy.
Introgression Detection:
- ABBA-BABA tests (D-statistics): Implemented in 100kb non-overlapping windows across the genome to detect signals of introgression [94].
- PhyloNet: Used for phylogenetic network inference to model potential hybridization events [94].
- f-branch model: Applied to quantify introgression under different phylogenetic hypotheses.
Discordance Measurement:
- Robinson-Foulds distances: Calculated between gene trees and species trees to quantify discordance [94].
- MSCquartets: Analyzed quartet frequencies to assess the contribution of ILS to discordance [94].
Tinamou Phylogenomic Workflow
Table: Key Research Reagents and Solutions for Tinamou Phylogenomics
| Resource/Solution | Function/Application |
|---|---|
| Whole-genome sequences | Comprehensive genomic data for phylogenetic inference and introgression detection [93] |
| BUSCO gene sets | Assessment of genome completeness and conserved phylogenetic markers [94] |
| UCE probes | Targeted enrichment of ultraconserved elements with flanking regions [94] |
| ASTRAL-III software | Species tree inference under the multi-species coalescent model [94] |
| PhyloNet | Phylogenetic network inference to model hybridization and introgression [94] |
| BEAST2 | Bayesian divergence time estimation with fossil calibrations [94] |
| ABBA-BABA scripts | Introgression detection using D-statistics across genomic windows [94] |
Results
Patterns of Gene Tree Discordance and Introgression
The study revealed heterogeneous patterns of gene tree discordance across the tinamou phylogeny. While most relationships were consistent across different genomic datasets, one clade within the genus Crypturellus displayed "substantial species-tree discordance across the different data sets" [93]. This localized discordance suggested either high levels of ILS or a history of introgression in this specific lineage.
Analysis of introgression patterns using 100kb non-overlapping windows across the genome identified "pervasive genome-wide introgression" [93]. The distribution and extent of this introgression were dependent on the assumed phylogenetic topology applied in the f-branch model. When assuming certain topological hypotheses, the patterns of introgression aligned with theoretical predictions about genome architecture, suggesting that the observed signals reflect genuine biological processes rather than analytical artifacts.
Comparative analysis of different genomic regions revealed that the Z-chromosome showed distinct phylogenetic signals compared to autosomes, potentially reflecting different evolutionary pressures or capacities to introgress. This pattern aligns with theoretical expectations, as sex chromosomes often exhibit reduced introgression due to their association with hybrid incompatibilities.
Phylogenetic Resolution and Species Relationships
Despite the observed discordance, the study successfully reconstructed a robust phylogenetic framework for tinamous. The phylogeny was "largely robust across methods and datasets" [93], with most relationships receiving strong statistical support across different analytical approaches. This consistency provides confidence in the overall evolutionary framework, even while acknowledging localized discordance.
The research also led to the identification of "an unrecognized species" [93], highlighting how comprehensive genomic sampling can reveal previously overlooked diversity. This discovery underscores the value of dense taxonomic sampling combined with genome-scale data for delimiting species boundaries and recognizing cryptic diversity.
ILS and Introgression Mechanisms
Discussion
Tinamous in the Context of Avian Radiation
The tinamou radiation provides valuable insights into the broader patterns of avian diversification. Unlike the rapid radiation of Neoaves following the K-Pg extinction event [95], tinamous exhibited a constant rate of diversification throughout their evolutionary history [93]. This difference may reflect distinct ecological circumstances or evolutionary constraints within the palaeognath lineage.
The study's finding of "pervasive genome-wide introgression" [93] in tinamous aligns with growing evidence that hybridization and introgression are common phenomena in avian evolution. Research on suboscine birds has similarly found that "gene tree discordance varies across lineages and geographic regions" [96], with introgression signal being highest between species in close geographic proximity and in regions with more dynamic climates since the Pleistocene. These parallel findings across different avian groups suggest that introgression may be a widespread mechanism in avian diversification.
The tinamou study contributes to a growing body of evidence challenging strictly tree-like models of evolution. Similar patterns of complex evolution have been documented in plants, such as the Gossypium genus, where "incomplete lineage sorting (ILS), a factor likely to have been instrumental in shaping the swift diversification of cotton" [29] and "intricate phylogenies potentially stemming from introgression" [29] have been observed. These convergent patterns across disparate organisms highlight the generality of these evolutionary processes.
Methodological Implications for Phylogenomics
The tinamou research demonstrates the importance of using multiple analytical approaches and genomic data types to reconstruct evolutionary history. The dependence of introgression patterns on "the assumed phylogeny applied to the f-branch model" [93] underscores the iterative nature of phylogenomic inference, where initial phylogenetic hypotheses inform tests for processes that might challenge those same hypotheses.
The study also illustrates the value of whole-genome data compared to more limited marker sets. While previous studies based on "morphological data or a small number of molecular markers" had "limited capability for reconstructing the tinamou phylogeny" [93], the whole-genome approach provided sufficient resolution to reconstruct most relationships with confidence while also characterizing the extent and distribution of discordance.
The heterogeneous distribution of ILS regions across the genome, with "signs of robust natural selection influencing specific ILS regions" [29] as also observed in cotton, suggests that functional genomic elements may be non-randomly distributed with respect to patterns of discordance. This finding has important implications for understanding how selection shapes genomic architecture during diversification.
The tinamou phylogenomic study provides a comprehensive framework for understanding the evolutionary history of this distinctive avian lineage while offering broader insights into the processes shaping biological diversification. The research demonstrates that despite a generally robust phylogenetic structure, the group's evolutionary history has been shaped by both incomplete lineage sorting and widespread introgression, particularly in specific lineages such as the Crypturellus clade.
These findings contribute to a paradigm shift in evolutionary biology, from viewing species relationships as strictly tree-like to understanding them as complex networks shaped by multiple interacting processes. The "pervasive genome-wide introgression" [93] observed in tinamous, coupled with heterogeneous patterns of ILS, mirrors patterns found across the tree of life, from plants [2] [29] to other bird groups [96] [95].
Future research directions should include functional analysis of genomic regions affected by ILS and introgression, investigation of the ecological and demographic factors facilitating tinamou hybridization, and comparative studies across palaeognaths to determine how general these patterns are within the broader avian lineage. The tinamou study serves as a model for how whole-genome data can illuminate complex evolutionary histories and provides a foundation for these future investigations into the drivers of avian diversification.
The genus Paramesotriton represents a compelling model of adaptive radiation in East Asian salamanders. While historically recognized for its ecological diversity and complex distribution across southern China and northern Vietnam, the evolutionary mechanisms underlying its diversification have remained partially unresolved. This whitepaper synthesizes recent phylogenomic evidence demonstrating that the evolutionary history of Asian warty newts is characterized by extensive gene tree discordance, primarily driven by the interplay between incomplete lineage sorting (ILS) and pre-speciation introgression. We present comprehensive analysis of the genomic methodologies and analytical frameworks used to disentangle these complex signals, highlighting an erosion-driven speciation model where dynamic geomorphological processes in karst ecosystems promoted repeated episodes of allopatric divergence. The integration of population genomics with paleoclimatic reconstructions reveals how ecological opportunity, coupled with reticulate evolution, has shaped one of the most diverse radiations within the Salamandridae family.
Adaptive radiation, the rapid diversification of organisms from a common ancestor into a variety of ecological niches, represents a fundamental process in evolutionary biology. The crested newts (Triturus cristatus superspecies) provide a classical example of phenotypic diversification emerging from an evolutionary switch in ecological preferences, forming a well-supported monophyletic clade where phenotypic traits show high levels of concordance in their pattern of variation [97]. Similarly, the gemsnakes of Madagascar (Pseudoxyrhophiinae) demonstrate how widespread reticulate evolution can produce significant portions of extant diversity, with 28% of the group's species originating through hybridization events [98].
Within this context, Asian warty newts (Paramesotriton) represent the second most diverse genus within the family Salamandridae, currently comprising 15 recognized species distributed across southern China and northern Vietnam [99] [4]. These amphibians exhibit strong habitat specificity, occupying mountain streams and rivers with limited dispersal capacity, making them exceptionally vulnerable to environmental change and ideal for studying evolutionary processes [99] [100]. Previous phylogenetic studies relying on limited molecular markers failed to resolve key interspecific relationships, particularly within the P. caudopunctatus species group (PCSG), suggesting potential complex evolutionary histories beyond simple bifurcating trees [99].
The integration of genomic approaches has revolutionized our understanding of such radiations by enabling researchers to differentiate between two primary sources of gene tree discordance: incomplete lineage sorting (ILS), which preserves ancestral polymorphisms during rapid speciation, and introgression, which involves gene flow between already differentiated lineages [2] [88]. This distinction is critical for reconstructing accurate evolutionary histories and understanding the mechanisms driving diversification.
Materials and Methods: Genomic Toolkit for Discording Evolutionary Signals
Sample Collection and Sequencing Approaches
Modern phylogenomic studies of Paramesotriton have utilized comprehensive sampling strategies across their biogeographic range. For instance, one investigation analyzed 27 samples representing 14 recognized species, supplemented with data from publicly available databases [99]. Tissue samples preserved in 95% ethanol underwent genomic DNA extraction using the cetyltrimethylammonium bromide (CTAB) method, ensuring high-quality DNA for subsequent sequencing [99].
Two primary sequencing approaches have been employed:
- Restriction-site associated DNA sequencing (RAD-seq): This reduced-representation method efficiently discovers and genotypes thousands of single nucleotide polymorphisms (SNPs) across the genome without requiring a reference genome, making it ideal for non-model organisms [4].
- Mitochondrial genome and multi-locus nuclear sequencing: This approach combines complete mitochondrial genomes with dozens of nuclear gene fragments (e.g., 32 nuclear genes) to provide both maternal lineage history and broader phylogenetic signal [99].
For transcriptome analysis in plant systems (providing a comparative framework), RNA sequencing (RNA-Seq) has proven valuable for generating both nuclear and plastid gene datasets without the need for whole genome sequencing, which remains prohibitive for organisms with large genomes [2].
Phylogenetic Inference and Reticulation Analysis
The analytical workflow for detecting pre-speciation introgression involves multiple complementary approaches:
Table 1: Analytical Methods for Detecting Introgression and ILS
| Method Category | Specific Tools | Primary Function | Interpretation of Positive Signal |
|---|---|---|---|
| Species Tree Inference | ASTRAL, Maximum Likelihood | Reconstruct primary species relationships from gene trees | Provides backbone for discordance detection |
| Reticulate Evolution Analysis | HyDe, Dsuite, PhyloNet | Test specifically for introgression signals | Identifies genomic regions with history of gene flow |
| Quartet-based Analysis | SNaQ, NANUQ, QuIBL | Quantify support for alternative phylogenetic relationships | Distinguishes between ILS and introgression |
| Gene Tree Discordance Metrics | Site Concordance Factors (sCF/sDF) | Measure conflict among gene trees | Highlights nodes with significant discordance |
The following workflow diagram illustrates the integration of these methods in a typical analysis:
Species Distribution Modeling and Niche Analysis
To connect evolutionary history with ecological processes, researchers have employed Ecological Niche Modeling (ENM) to predict potential distributions under past, present, and future climate scenarios. These models typically utilize:
- Climate variables: Bioclimatic parameters from WorldClim database
- Occurrence data: Georeferenced locality records from field surveys and museum collections
- Modeling algorithms: Ensemble approaches combining multiple modeling techniques
- Projection scenarios: Paleoclimatic reconstructions and future climate change projections (e.g., SSP2-4.5 and SSP5-8.5 for 2050 and 2090) [100]
Integration of genetic structure data with ENM allows for more nuanced predictions that account for intraspecific variation and local adaptations [100].
Key Findings: Genomic Evidence for Reticulate Evolution
Prevalence of Incomplete Lineage Sorting and Introgression
Comprehensive phylogenomic analyses of Paramesotriton have revealed that ILS represents the primary cause of gene tree discordance throughout the evolutionary history of the genus. This pattern is particularly pronounced within the P. caudopunctatus species group, where short internodes in the species tree reflect rapid succession of speciation events, leaving insufficient time for the complete sorting of ancestral polymorphisms [4].
Supplementing this pervasive ILS, multiple lines of evidence indicate significant pre-speciation introgression events:
- HyDe analysis: Detected significant hybridization signals between specific lineages, including P. longliensis and an unidentified Paramesotriton lineage [4]
- D-statistics: Revealed significant gene flow between diverging lineages prior to their complete reproductive isolation [4]
- PhyloNet: Reconstructed explicit phylogenetic networks supporting reticulate rather than strictly bifurcating relationships [4]
These findings parallel patterns observed in other adaptive radiations, such as the gemsnakes of Madagascar, where hybridization has contributed to 28% of the extant diversity [98], and plant genera in East Asian evergreen broad-leaved forests, where both hybridization and ILS shape phylogenetic relationships [88].
Specific Cases of Hybrid Origin
Strong evidence suggests a hybrid origin for P. zhijinensis, with genomic analyses indicating contributions from multiple parental lineages [4]. This pattern aligns with observations in other taxonomic groups where hybrid speciation has generated significant portions of diversity, particularly in rapidly radiating lineages [101] [98].
The spatial distribution of hybrid lineages often shows distinct patterns, with younger hybrids frequently occupying intermediate contact zones between parental lineages. This distribution suggests that post-speciation dispersal has not completely eroded the spatial signatures of initial introgression events [98].
Ecological and Geological Drivers of Diversification
The evolutionary history of Paramesotriton is intricately linked to the dramatic geological history of southern China. Biogeographic analyses indicate that the genus originated in southwestern China (Yunnan-Guizhou Plateau/South China) during the late Oligocene, coinciding with:
- The second uplift of the Himalayan/Tibetan Plateau
- Rapid lateral extrusion of Indochina
- Formation of extensive karst landscapes in southwestern China [99]
Table 2: Paleoclimatic and Geological Events Shaping Paramesotriton Evolution
| Time Period | Major Geological Events | Evolutionary Consequences for Paramesotriton |
|---|---|---|
| Late Oligocene | Second uplift of Himalayan/Tibetan Plateau; Karst formation | Origin of the genus in southwestern China |
| Miocene | Continued karstification; Climatic fluctuations | Diversification of the P. caudopunctatus species group |
| Pliocene-Pleistocene | Enhanced monsoon systems; Further habitat fragmentation | Secondary contact and introgression events; Refugia formation |
An "erosion-driven speciation model" has been proposed for the PCSG, wherein repeated episodes of allopatric divergence were promoted by the dynamic geomorphological processes in karst mountain ecosystems during both tectonically active and quiescent periods [4]. The erosion of carbonate sedimentary rocks created complex landscapes with isolated drainages that facilitated population fragmentation and genetic isolation.
Principal component analysis of bioclimatic variables based on occurrence data reveals that habitat conditions across the three main distributional regions (West, South, and East) differ significantly, with different levels of climatic niche differentiation among species [99]. This ecological differentiation, combined with physical barriers created by the karst topography, provided the ideal conditions for adaptive radiation.
Table 3: Key Research Reagents and Methodological Solutions for Phylogenomic Studies
| Reagent/Resource | Specific Application | Function and Importance |
|---|---|---|
| CTAB DNA Extraction Buffer | Genomic DNA isolation from tissue samples | Effective for diverse tissue types; field-stable chemistry |
| Restriction Enzymes (RAD-seq) | Reduced-representation genome sequencing | Creates reproducible subsets of the genome for SNP discovery |
| Illumina NovaSeq Platform | High-throughput sequencing | Generates billions of reads for comprehensive genomic coverage |
| Angiosperms353 Probe Set | Target enrichment in plants (comparative studies) | Universal bait set for consistent nuclear gene recovery across taxa |
| MIG-seq Protocol | Genome-wide SNP discovery | Efficient multiplexed approach for population genomic studies |
| MITOS v2.0 | Mitochondrial genome annotation | Automated annotation of mitogenomes from sequence data |
| ASTRAL | Species tree estimation from gene trees | Accounts for incomplete lineage sorting in species tree inference |
| Dsuite | Introgression analysis | Implements D-statistics and related tests for gene flow detection |
| WorldClim Database | Ecological niche modeling | Provides standardized bioclimatic variables for distribution modeling |
Discussion: Integration with Broader Evolutionary Frameworks
The findings from Paramesotriton research contribute significantly to the broader understanding of adaptive radiation and phylogenetic discordance. Several key insights emerge:
First, the co-occurrence of ILS and introgression throughout the radiation of Asian warty newts challenges strictly bifurcating models of evolution and supports a more complex network-like history. This pattern appears common in rapidly diversifying groups, as seen in gemsnakes [98], Stewartia plants [88], and other radiations where ecological opportunity promotes diversification.
Second, the erosion-driven speciation model provides a mechanistic link between geological processes and biological diversification. The dynamic karst landscapes of southern China created a mosaic of isolation and connection opportunities that drove both allopatric divergence and secondary contact. This model may apply broadly to other organisms inhabiting karst ecosystems worldwide.
Third, the temporal persistence of introgression signals suggests that hybridization has been a consistent feature throughout the evolutionary history of Paramesotriton, rather than being limited to specific periods. This contrasts with patterns observed in some radiations where hybridization is concentrated early in the diversification process [98].
Finally, the integration of genomic data with paleoclimatic reconstructions and ecological niche modeling provides a powerful framework for understanding how environmental change shapes evolutionary trajectories. For Paramesotriton, future climate change projections indicate significant reductions in suitable habitat and upward shifts in elevation, potentially creating novel contact zones and additional opportunities for hybridization [100].
The radiation of Asian warty newts exemplifies how the interplay of ecological opportunity, geological history, and reticulate evolution generates biological diversity. Genomic evidence conclusively demonstrates that both incomplete lineage sorting and pre-speciation introgression have shaped the evolutionary history of Paramesotriton, creating complex phylogenetic discordance that requires sophisticated analytical approaches to decipher.
Future research directions should include:
- Whole-genome sequencing of all recognized species and putative hybrids
- Functional genomics studies to identify adaptive introgression
- Paleogenomic approaches to reconstruct historical population sizes
- High-resolution monitoring of contemporary hybrid zones
- Integration of genomic data with conservation strategies for threatened species
The erosion-driven speciation model emerging from Paramesotriton research provides a template for understanding diversification in other karst-adapted organisms, while the methodological framework for discriminating between ILS and introgression has broad applicability across evolutionary biology. As phylogenomic methods continue to advance, our understanding of these complex evolutionary histories will undoubtedly reveal additional layers of complexity in one of Asia's most fascinating amphibian radiations.
A fundamental challenge in modern evolutionary genomics is resolving the biological processes responsible for incongruence between gene trees and the species tree [21]. Two predominant sources of this phylogenetic discordance are incomplete lineage sorting (ILS) and introgression [39] [102]. Both processes can generate strikingly similar patterns of shared genetic variation, making their distinction essential yet methodologically complex [39] [58]. ILS represents the failure of ancestral polymorphisms to coalesce during successive speciation events, resulting from the stochastic nature of genetic drift in concert with short internodal times and large effective population sizes [102] [58]. In contrast, introgression involves the transfer of genetic material between previously isolated lineages through hybridization and backcrossing, potentially introducing adaptive variation or blurring species boundaries [5] [103]. This technical guide provides researchers with a comprehensive framework for differentiating these processes, employing cutting-edge phylogenomic methods, quantitative benchmarks, and experimental validations.
Theoretical Foundations and Biological Context
Incomplete Lineage Sorting (ILS)
ILS occurs when ancestral genetic polymorphisms persist through multiple speciation events, leading to genealogical histories that predate species divergences [102] [58]. The probability of ILS increases when the time between speciation events (in generations) is shorter than the effective population size (Ne), allowing ancestral polymorphisms to be randomly sorted into descendant lineages [39]. This process is particularly pronounced in rapid radiations, lineages with large effective population sizes, and taxa with long generation times, such as coniferous trees [39] [102]. For example, in the rapidly diversified peatmoss genus (Sphagnum), ILS has been identified as the primary driver of extensive genome-wide phylogenetic discordance following recent radiation [102].
Introgression
Introgression, alternatively referred to as secondary gene flow, entails the incorporation of genetic material from one species into the gene pool of another through repeated backcrossing of hybrids [39] [5]. Unlike ILS, which represents shared ancestral variation, introgression facilitates post-speciation genetic exchange that can introduce locally adaptive alleles [5] [103]. Documented examples span diverse taxa, including adaptive introgression for high-altitude adaptation in humans, herbivore resistance in sunflowers, and fruit color in wild tomatoes [5]. In bacteria, although species borders are rarely fuzzy, introgression of core genes between distinct species has been systematically identified, impacting their evolutionary trajectories [103].
Table 1: Key Theoretical Distinctions Between ILS and Introgression
| Feature | Incomplete Lineage Sorting (ILS) | Introgression |
|---|---|---|
| Source of Shared Variation | Ancestral polymorphism | Post-speciation gene flow |
| Spatial Distribution | Even across all populations [39] | Concentrated in parapatric populations [39] |
| Effect on Phylogeny | Random discordance across genome [102] | Structured, often localized discordance [21] |
| Relationship to Divergence Time | Increases with shorter internodes | Decreases with longer isolation |
| Impact on Quantitative Traits | Covariance proportional to coalescent probabilities [5] | Enhanced trait similarity beyond species tree expectation [5] |
Methodological Framework for Differentiation
Population Genetic and Phylogeographic Approaches
Comparing genetic patterns between allopatric and parapatric populations provides a powerful initial discriminator. Under pure ILS, shared polymorphisms should be distributed evenly across all populations regardless of geographic proximity [39]. In contrast, introgression predicts significantly higher admixture and lower interspecific differentiation in parapatric populations compared to allopatric ones [39]. This approach successfully demonstrated that secondary introgression, rather than ILS, explained most shared nuclear genomic variation between Pinus massoniana and P. hwangshanensis [39].
Coalescent-Based Model Selection
Advanced computational frameworks enable direct comparison of demographic models incorporating various combinations of isolation, migration, and secondary contact:
Approximate Bayesian Computation (ABC) tests competing speciation scenarios by comparing summary statistics of observed data with simulations under different models [39]. ABC analysis of the two pine species supported a scenario of prolonged isolation followed by secondary contact over continuous gene flow models [39].
Isolation-with-Migration (IM) models simultaneously estimate divergence times, migration rates, and effective population sizes [39]. These models can be implemented using software such as IMa3.
Multispecies Coalescent (MSC) models provide the theoretical foundation for quantifying expected gene tree heterogeneity under ILS alone, serving as a null model for detecting introgression [5].
Phylogenomic Discordance Analysis
Whole-genome sequencing enables genome-scale quantification of phylogenetic discordance patterns:
ABBA-BABA tests (D-statistics) detect significant deviations from the expected site pattern frequencies under a null model of strict bifurcation without gene flow [102] [58]. Significant D-statistics provide evidence for introgression between specific taxon pairs [58].
Quartet-based methods decompose phylogenetic signal across the genome, distinguishing concordant and discordant topologies while quantifying their relative frequencies [21].
Gene tree-species tree reconciliation approaches infer the predominant species tree while accounting for both ILS and introgression as sources of gene tree variation [21].
Table 2: Quantitative Estimates of ILS and Introgression Across Taxonomic Groups
| Taxonomic Group | ILS Estimate | Introgression Estimate | Primary Evidence | Citation |
|---|---|---|---|---|
| Tuco-tucos (Ctenomys) | ~9% of loci | Significant (D-statistic) | Transcriptomics | [58] |
| Fagaceae | 9.84% of gene tree variation | 7.76% of gene tree variation | Genome decomposition analysis | [21] |
| Peatmoss (Sphagnum) | Primary source of discordance | Limited recent gene flow | Whole-genome phylogenomics | [102] |
| Wild Tomatoes (Solanum) | Covariance in BM model | Enhanced trait similarity | Gene expression evolution | [5] |
Comparative Analysis of Genomes with Contrasting Inheritance
Analyzing organelles with different inheritance patterns (e.g., maternal versus paternal) provides complementary evidence. In pines, mitochondrial DNA (maternally inherited) and chloroplast DNA (paternally inherited) exhibited contrasting patterns of shared variation with nuclear markers, revealing complex histories of isolation and secondary contact [39]. Similarly, in Fagaceae, incongruences between mitochondrial, chloroplast, and nuclear phylogenies revealed ancient hybridization events [21].
Experimental Protocols and Workflows
Transcriptomic Analysis for ILS and Introgression Detection
This protocol follows methodologies applied in tuco-tucos and other non-model organisms [58]:
RNA Extraction and Sequencing: Extract high-quality RNA from fresh or flash-frozen tissues using standard kits. Perform mRNA selection, library preparation, and Illumina sequencing (minimum 30M paired-end reads, 150bp).
Transcriptome Assembly and Orthology Prediction: Assemble clean reads into transcriptomes using Trinity or similar software. Identify orthologous groups across species using OrthoFinder, with outgroup inclusion for rooting.
Gene Tree Inference and Species Tree Estimation: Align coding sequences for each ortholog group using MAFFT. Infer individual gene trees using maximum likelihood (RAxML or IQ-TREE). Reconstruct the species tree from concatenated data using ASTRAL or SVDquartets, which account for ILS.
Introgression Testing: Calculate Patterson's D-statistics (ABBA-BABA tests) for all species triplets using implementations in Dsuite or admixr. Assess significance with block-jackknifing.
ILS Quantification: Calculate the proportion of gene trees supporting each possible topology. Compare observed frequencies to expectations under the multispecies coalescent model.
Figure 1: Transcriptomic Analysis Workflow for ILS and Introgression Detection
Genome-Wide Discordance Decomposition Analysis
This protocol quantifies relative contributions of different processes to phylogenetic discordance [21]:
Data Collection and SNP Calling: Sequence whole genomes (minimum 10× coverage) or use target capture approaches. Map reads to reference genome, call SNPs with GATK, and filter for quality and missing data.
Multispecies Coalescent Modeling: Infer the species tree and quantify ILS using ASTRAL-III. Calculate local posterior probabilities for each gene tree.
Gene Flow Detection: Use D-statistics and F-branch tests to detect introgression. Perform D-statistic scans in sliding windows across the genome.
Gene Tree Estimation Error Assessment: Calculate bootstrap support for each gene tree. Filter low-support nodes or exclude genes with average support below a threshold (e.g., 70%).
Variance Decomposition: Partition the variance in gene tree topologies attributable to ILS, introgression, and estimation error using regression frameworks or information-theoretic approaches.
The Scientist's Toolkit: Essential Research Reagents and Solutions
Table 3: Key Research Reagents and Computational Tools for ILS and Introgression Studies
| Category | Specific Tool/Reagent | Function/Application | Key Features |
|---|---|---|---|
| Sequencing | Illumina short-read platforms | Whole-genome/transcriptome sequencing | Cost-effective for population sampling |
| PacBio/Oxford Nanopore | Long-read sequencing for assembly | Resolves structural variants | |
| Bioinformatics | GATK variant calling | SNP identification and filtering | Handles NGS artifacts effectively |
| OrthoFinder orthology prediction | Identies orthologous genes across species | Accounts of gene duplication events | |
| Phylogenetics | IQ-TREE gene tree inference | Maximum likelihood tree building | Model selection and fast execution |
| ASTRAL species tree inference | Species tree accounting for ILS | Coalescent-based consensus | |
| Population Genetics | Dsuite introgression testing | ABBA-BABA statistics implementation | Handles genome-scale data |
| ADMIXTURE structure analysis | Ancestry proportion estimation | Unsupervised clustering | |
| Demographic Modeling | δaδi diffusion approximation | Joint frequency spectrum analysis | Flexible demographic models |
| MSABC model comparison | Approximate Bayesian Computation | Competes complex scenarios |
Case Studies and Empirical Patterns
Coniferous Trees: Secondary Contact Following Isolation
Analysis of 33 intron loci across Pinus massoniana and P. hwangshanensis genomes revealed slightly more admixture in parapatric than allopatric populations, with lower interspecific differentiation in contact zones [39]. ABC analyses supported a scenario of long isolation followed by secondary contact during Pleistocene climatic oscillations, with ecological niche modeling corroborating range expansion facilitating introgression [39]. This case exemplifies how combining population genetics with paleodistribution modeling strengthens inferences.
Rapid Rodent Radiation: Quantifying ILS Contributions
Transcriptomic analysis of tuco-tucos (Ctenomys) revealed approximately 9% of loci affected by ILS during their recent radiation, alongside significant introgression signals between C. torquatus and C. brasiliensis detected via D-statistics [58]. This demonstrates that even with significant introgression, ILS remains an important evolutionary process during incipient diversification, particularly in groups with short internodal distances.
Bacterial Evolution: Porous Species Boundaries
Systematic analysis of 50 bacterial lineages revealed varying introgression levels (average 2% of core genes, up to 14% in Escherichia–Shigella) [103]. Interestingly, introgression was most frequent between highly related species, yet species borders remained largely non-fuzzy, suggesting the process impacts bacterial evolution without substantially blurring taxonomic boundaries.
Figure 2: Empirical Patterns of ILS and Introgression Across Taxa
Distinguishing between ILS and introgression requires integrative approaches combining population genetic, phylogenomic, and ecological methods. While ILS typically generates random discordance distributed evenly across the genome and populations, introgression produces spatially structured patterns with heightened signal in geographic contact zones [39]. Quantitative benchmarks across diverse taxa indicate both processes significantly contribute to evolutionary trajectories, with ILS accounting for approximately 9% of loci in rapid radiations [58] and introgression contributing roughly 2-8% of genomic variation across plants and bacteria [21] [103]. Future methodological developments, particularly in probabilistic modeling and machine learning approaches [12], will further enhance our capacity to disentangle these complex evolutionary processes across the tree of life.
In the field of phylogenomics, gene tree discordance—where evolutionary histories inferred from different genes contradict one another—presents a significant challenge for reconstructing accurate species relationships. This discordance often stems from two primary biological processes: incomplete lineage sorting (ILS), the failure of ancestral genetic polymorphisms to coalesce in consecutive speciation events, and introgression, the transfer of genetic material between species through hybridization [104]. Distinguishing between the signals of ILS and introgression is notoriously difficult, as both processes can produce similar patterns of conflicting gene trees [105]. Consequently, validation through simulation has become an indispensable methodology for assessing the performance of phylogenetic methods under controlled conditions with known evolutionary histories.
Simulation-based validation provides a critical framework for evaluating the accuracy, robustness, and limitations of phylogenetic inference methods before applying them to empirical data with unknown evolutionary histories [105]. By generating sequence data under explicitly defined evolutionary scenarios with known parameters of ILS, introgression, and other processes, researchers can quantitatively assess how well different methods recover the true species tree and underlying population genetic processes. This approach is particularly valuable in the context of the widespread recognition that ILS and introgression have jointly shaped rapid radiations across diverse taxa, from plants like Artemisia and Gossypium to geckos of the genus Gehyra [106] [105] [29].
Fundamental Concepts of Gene Tree Discordance
Incomplete Lineage Sorting (ILS)
Incomplete lineage sorting occurs when the coalescence of gene lineages predates speciation events, resulting in the retention of ancestral polymorphisms across successive divergences [104]. This phenomenon is particularly common in rapid radiations, where short intervals between speciation events provide insufficient time for gene lineages to coalesce. The consequence is that individual gene trees may reflect different evolutionary histories from the overall species tree, creating a pattern of discordance that can mislead phylogenetic inference if not properly accounted for.
The mathematical probability of ILS is described by coalescent theory, which models the genealogical process of gene lineages within populations. Under the multispecies coalescent model, the probability that two gene lineages coalesce in a given ancestral population decreases exponentially with the ratio of population size (Nₑ) to the time between speciation events (τ). Specifically, for three species with two sequential speciation events, the probability of discordance due to ILS is approximately (2/3)e^(-τ/Nₑ), highlighting how both population size and branching times influence discordance patterns.
Introgression
Introgression, or hybridization, involves the transfer of genetic material between closely related species through successful interbreeding and backcrossing [106]. This process creates a mosaic genome where different regions may reflect different evolutionary histories due to ancestry from different parental species. Unlike ILS, which represents the stochastic sorting of ancestral variation, introgression involves the direct transfer of genetic material after speciation, often resulting in strongly supported but conflicting phylogenetic signals across different genomic regions.
The statistical detection of introgression often relies on methods like the D-statistic (ABBA-BABA test), which identifies excess allele sharing between non-sister taxa indicative of gene flow [2]. More recently, phylogenetic network approaches have been developed to simultaneously account for both ILS and introgression, providing a more comprehensive framework for modeling complex evolutionary histories [104].
Challenges in Distinguishing ILS and Introgression
Differentiating between ILS and introgression remains challenging because both processes can produce similar patterns of gene tree discordance [105]. Several key features can help distinguish them:
- Genomic distribution: Introgression often affects specific genomic regions, creating localized blocks of shared ancestry, while ILS produces more uniformly distributed discordance across the genome.
- Branch length effects: ILS is more prevalent on short internal branches, whereas introgression can occur regardless of branch lengths.
- Phylogenetic signal: Introgression typically creates strong, region-specific phylogenetic signals, while ILS generates more stochastic discordance patterns.
Simulation studies have been instrumental in characterizing these distinguishing features and developing statistical frameworks to tease apart their relative contributions [21].
Simulation Framework Design
Core Components of Phylogenomic Simulations
Effective simulation frameworks for testing method performance incorporate several key components to realistically model evolutionary processes. The table below outlines these essential elements and their functions in simulation design.
Table 1: Core Components of Phylogenomic Simulation Frameworks
| Component | Function | Key Parameters |
|---|---|---|
| Species Tree Model | Defines the true evolutionary relationships and divergence times | Topology, branch lengths, divergence times |
| Population Genetics Model | Specifies demographic history and gene flow | Effective population size (Nₑ), migration rates, growth rates |
| Sequence Evolution Model | Generates molecular sequence data along gene trees | Substitution rates, among-site rate variation, indels |
| Gene Flow Scenarios | Models introgression events | Timing, direction, magnitude of gene flow |
| ILS Parameters | Controls the extent of incomplete lineage sorting | Population sizes relative to branch lengths |
Establishing Ground Truth Histories
The foundation of any validation simulation is the establishment of known evolutionary histories against which method performance can be measured. This typically begins with specifying a species tree topology with clearly defined divergence times. Branch lengths are particularly critical, as short internal branches increase the probability of ILS [104]. For instance, in the Amaranthaceae study, researchers found that "three consecutive short internal branches produce anomalous trees contributing to the discordance," highlighting how branch length configurations directly impact phylogenetic complexity [104].
Gene trees are then simulated within the species tree framework under the multispecies coalescent model, which naturally generates ILS. The proportion of gene trees discordant with the species tree provides a quantitative measure of expected ILS. Introgression events are modeled by adding migration edges between branches at specific time points, with parameters controlling the direction, timing, and magnitude of gene flow [21].
Realism and Scalability Considerations
Modern phylogenomic simulations must balance biological realism with computational tractability. Key considerations include:
- Genome structure: Modeling linked loci, variation in recombination rates, and chromosomal organization.
- Heterogeneous molecular evolution: Incorporating variation in substitution rates across sites and lineages, as well as different evolutionary models for different partitions.
- Selection regimes: Including both neutral and selective scenarios, as selection can distort patterns of ILS and introgression.
- Data quality issues: Incorporating realistic sequencing errors, missing data, and assembly artifacts.
Recent studies have emphasized the importance of modeling multiple concurrent processes. As research on Fagaceae revealed, "gene tree estimation error, incomplete lineage sorting, and gene flow accounted for 21.19%, 9.84%, and 7.76% of gene tree variation, respectively," demonstrating how multiple factors jointly contribute to discordance patterns [21].
Experimental Protocols for Method Validation
Standardized Simulation Workflow
A robust protocol for validating method performance through simulation follows a structured workflow that ensures comprehensive assessment and reproducible results. The diagram below illustrates this multi-stage process.
Diagram 1: Simulation Validation Workflow
Parameter Space Exploration
Comprehensive validation requires exploring a broad parameter space to assess method performance across diverse evolutionary scenarios. Key parameters to vary include:
- Divergence times: Testing scenarios from deep to shallow divergences, with particular emphasis on rapid radiations where ILS is prevalent.
- Population sizes: Varying Nₑ to manipulate the expected amount of ILS.
- Introgression timing: Testing both ancient and recent hybridization events.
- Gene flow intensity: Varying migration rates from minimal to extensive introgression.
- Genomic sampling: Exploring different numbers of loci and sites to assess scalability.
For each parameter combination, multiple replicate datasets should be simulated to account for stochastic variance. Studies in Gehyra geckos demonstrated the importance of this approach, showing that high gene tree discordance persisted regardless of sampling strategy, indicating biological rather than technical causes [105].
Performance Metrics and Statistical Evaluation
Quantitative assessment of method performance requires clearly defined metrics that capture different aspects of accuracy:
Table 2: Performance Metrics for Phylogenetic Method Validation
| Metric Category | Specific Metrics | Interpretation |
|---|---|---|
| Topological Accuracy | Species Tree Error Rate (RF Distance), Proportion of Correct Clades, False Positive/Negative Rates | Measures ability to recover true species relationships |
| Parameter Estimation | Bias and MSE for Nₑ, Divergence Times, Introgression Rates | Quantifies accuracy of parameter inference |
| Discrimination Power | Type I and II Error Rates for Introgression Detection, ROC Curves | Assesses reliability in distinguishing ILS vs. introgression |
| Computational Efficiency | Runtime, Memory Usage, Scalability | Practical considerations for application to empirical data |
Statistical evaluation should include appropriate summary statistics and visualizations to compare method performance across different simulation conditions. Recent work on Gossypium radiation emphasized the importance of quantifying the "non-random distribution of ILS regions across the genome," highlighting how spatial patterns of discordance provide additional insights beyond summary statistics [29].
Case Studies in Empirical System Validation
Plant Phylogenomic Systems
Plants provide excellent models for testing methods to distinguish ILS and introgression due to their frequent hybridization and rapid radiations. Several case studies illustrate how simulation-based validation has been applied to empirical systems:
Amaranthaceae s.l.: Researchers used "coalescent-based species trees and network inference, gene tree discordance analyses, site pattern tests of introgression, topology tests, synteny analyses, and simulations" to test hypotheses of ancient hybridization. They found that "a combination of processes might have generated the high levels of gene tree discordance," demonstrating the need for methods that accommodate multiple sources of conflict [104].
Artemisia: Comparative analysis of plastomes and nuclear ITS sequences revealed "incongruence between plastid and nuclear phylogenies indicated that hybridization events have occurred during the evolution of the genus." This cytonuclear discordance provides a clear signature of historical introgression that can be used to validate detection methods [106].
Gossypium: Studies in cotton found "signs of robust natural selection influencing specific ILS regions," with approximately "15.74% of speciation structural variation genes and 12.04% of speciation-associated genes" intersecting with ILS signatures. This complex interplay between selection and ILS presents particular challenges for method validation [29].
Methodological Comparisons Across Systems
Different methodological approaches show variable performance across empirical systems:
Table 3: Method Performance Across Empirical Systems
| System | Best-Performing Methods | Key Challenges | Biological Insights |
|---|---|---|---|
| Liliaceae Tulipeae [2] | Site concordance factors (sCF), D-statistics, QuIBL | Pervasive ILS and reticulate evolution obscured phylogenetic signals | Failure to resolve relationships among Amana, Erythronium, and Tulipa due to complex evolutionary history |
| Fagaceae [21] | Concatenation and quartet-based approaches with filtering of inconsistent genes | Decomposition of gene tree variation into estimation error (21.19%), ILS (9.84%), and gene flow (7.76%) | Ancient hybridization led to New World/Old World divergence patterns conflicting between genomes |
| Gehyra Geckos [105] | Bayesian concordance analysis, Robinson-Foulds distances | High discordance from biological processes rather than sampling artifacts | Support for recent Asian origin and two major ecologically adapted clades |
These case studies collectively demonstrate that no single method consistently outperforms others across all scenarios, highlighting the importance of method selection tailored to specific evolutionary contexts and the value of simulation-based validation for guiding these choices.
Research Reagent Solutions
Implementing simulation-based validation requires both computational tools and conceptual frameworks. The table below outlines essential "research reagents" for designing and executing validation studies.
Table 4: Essential Research Reagents for Simulation-Based Validation
| Reagent/Tool | Type | Function | Examples/Implementation |
|---|---|---|---|
| Sequence Simulators | Software | Generate realistic sequence data under evolutionary models | MS, Seq-Gen, INDELible, SIMPHY |
| Coalescent Simulators | Software | Simulate gene trees within species trees accounting for ILS | MS, COAL, SimPhy, Dendropy |
| Phylogenetic Inference Methods | Software Packages | Infer species trees from simulated data | ASTRAL, MP-EST, SVDquartets, BPP |
| Introgression Detection Tools | Statistical Tests | Identify signals of gene flow in simulated data | D-statistics, PhyloNet, HyDe, Patterson's D |
| Performance Evaluation Scripts | Computational Pipelines | Quantify accuracy metrics across simulations | Custom R/Python scripts, Phylogenetic Toolkit |
| Benchmark Datasets | Reference Data | Standardized scenarios for method comparison | Empirical-like simulations with known histories |
Successful implementation of these research reagents requires careful consideration of biological realism. For example, in the Fagaceae study, researchers specifically assembled a mitochondrial genome as reference and implemented rigorous filtering to "mitigate the influence of nuclear and chloroplast-derived sequences in the phylogenetic analyses" [21]. Such methodological details significantly impact simulation outcomes and should be carefully documented in validation studies.
Advanced Topics and Future Directions
Emerging Challenges in Simulation Validation
As phylogenomic datasets grow in size and complexity, new challenges in simulation-based validation have emerged:
- Scalability: Methods must handle genome-scale data with thousands of loci and hundreds of taxa while remaining computationally tractable.
- Model complexity: Incorporating more realistic evolutionary models including variation in substitution rates, recombination hotspots, and selection heterogeneity.
- Integration of comparative methods: Combining phylogenetic inference with phenotypic evolution and diversification rate estimation.
- Validation of network approaches: Developing appropriate metrics for assessing accuracy of phylogenetic networks rather than strictly bifurcating trees.
Recent studies have highlighted these challenges, such as the Artemisia research that noted "the incongruence between plastid and nuclear phylogenies indicated that hybridization events have occurred," suggesting the need for methods that explicitly model cytonuclear discordance [106].
Integration of Machine Learning Approaches
Machine learning (ML) methods are increasingly being applied to phylogenetic problems and require novel validation approaches:
- Feature selection: Identifying informative summary statistics that discriminate between ILS and introgression scenarios.
- Classifier validation: Assessing performance of ML classifiers in assigning genomic regions to evolutionary processes.
- Neural network training: Developing appropriate simulation frameworks for training deep learning models to detect introgression.
The diagram below illustrates an integrated validation framework combining traditional and ML approaches.
Diagram 2: Integrated Validation Framework
Community Standards and Best Practices
The development of community standards for simulation-based validation represents an important future direction:
- Benchmark datasets: Establishment of standardized simulation scenarios for method comparison.
- Reporting standards: Minimum information guidelines for simulation studies.
- Open-source implementations: Shared code and workflows for reproducible validation.
- Performance databases: Centralized repositories of method performance across diverse scenarios.
As noted in the Gehyra study, "few empirical studies attempt to investigate the degree of discordance present or its potential sources," highlighting the need for more systematic validation approaches across diverse taxonomic groups [105].
Validation through simulation provides an essential framework for testing the performance of phylogenetic methods in distinguishing incomplete lineage sorting from introgression. By establishing known evolutionary histories and quantitatively assessing method accuracy under controlled conditions, researchers can develop more reliable approaches for reconstructing complex evolutionary relationships. The case studies presented demonstrate that most empirical systems involve a combination of processes—including ILS, introgression, and estimation error—that jointly contribute to gene tree discordance patterns.
Future advances will require increasingly realistic simulation frameworks that incorporate genomic architecture, heterogeneous evolutionary processes, and integrated analytical approaches. As these methods improve, simulation-based validation will continue to play a critical role in ensuring the accuracy and reliability of phylogenetic inference across the tree of life.
Conclusion
Distinguishing between incomplete lineage sorting and introgression is not merely an academic exercise but a fundamental requirement for accurate evolutionary inference in the genomic era. While ILS generates symmetrical gene tree discordance through the stochastic retention of ancestral polymorphisms, introgression creates asymmetrical patterns through directional gene flow. Successful discrimination requires integrative approaches combining multiple statistical tests, coalescent modeling, and phylogenetic network analyses. For biomedical research, these distinctions are crucial for properly tracing the evolutionary history of pathogens, understanding the origin of disease-related genes, and identifying introgressed adaptive variants. Future directions must focus on developing unified frameworks that simultaneously model both processes, improve quantification of their relative contributions, and better integrate comparative methods for trait evolution that account for pervasive genomic discordance. The increasing recognition of hybridization's creative role in evolution demands updated analytical paradigms across biological disciplines.
References
- 1. Incomplete lineage sorting [https://en.wikipedia.org/wiki/Incomplete_lineage_sorting]
- 2. Incomplete lineage sorting and introgression among genera ... [https://bmcbiol.biomedcentral.com/articles/10.1186/s12915-025-02204-z]
- 3. Teasing apart the sources of phylogenetic tree discordance ... [https://pmc.ncbi.nlm.nih.gov/articles/PMC12269116/]
- 4. Phylogenetic discordance is due to incomplete lineage ... [https://zoores.ac.cn/article/doi/10.24272/j.issn.2095-8137.2025.210]
- 5. The effects of introgression across thousands ... [https://pmc.ncbi.nlm.nih.gov/articles/PMC8601620/]
- 6. Incomplete lineage sorting and phenotypic evolution in ... [https://www.sciencedirect.com/science/article/pii/S0092867422003440]
- 7. Introgression [https://en.wikipedia.org/wiki/Introgression]
- 8. Introgression - PMC [https://pmc.ncbi.nlm.nih.gov/articles/PMC10581619/]
- 9. Phylogenomics reveals extreme gene tree discordance in ... [https://www.sciencedirect.com/science/article/pii/S1055790323001690]
- 10. Next-generation hybridization and introgression | Heredity [https://www.nature.com/articles/hdy201168]
- 11. Hybridization and introgression | Research Starters [https://www.ebsco.com/research-starters/health-and-medicine/hybridization-and-introgression]
- 12. Review Decoding genomic landscapes of introgression [https://www.sciencedirect.com/science/article/pii/S0168952525001660]
- 13. Phylogenomic Discordance is Driven by Wide-Spread ... [https://pmc.ncbi.nlm.nih.gov/articles/PMC11906154/]
- 14. An introgression from Triticum timopheevii reduces grain ... [https://pmc.ncbi.nlm.nih.gov/articles/PMC12340356/]
- 15. Horizontal Gene Transfer - PMC [https://pmc.ncbi.nlm.nih.gov/articles/PMC4536854/]
- 16. Gene transfer: Types, mechanisms, and methods [https://www.abcam.com/en-us/knowledge-center/dna-and-rna/gene-transfer-types-mechanisms-and-methods]
- 17. Discordance of Species Trees with Their Most Likely Gene Trees [https://journals.plos.org/plosgenetics/article?id=10.1371/journal.pgen.0020068]
- 18. Horizontal gene transfer [https://en.wikipedia.org/wiki/Horizontal_gene_transfer]
- 19. PhyloWGA: chromosome-aware phylogenetic interrogation ... [https://pmc.ncbi.nlm.nih.gov/articles/PMC8317108/]
- 20. Reconciling Gene Tree Discordance and Biogeography in ... [https://pmc.ncbi.nlm.nih.gov/articles/PMC12051742/]
- 21. Teasing apart the sources of phylogenetic tree discordance ... [https://bmcplantbiol.biomedcentral.com/articles/10.1186/s12870-025-06963-3]
- 22. Dealing with incongruence in phylogenomic analyses - PMC [https://pmc.ncbi.nlm.nih.gov/articles/PMC2607408/]
- 23. The effects of introgression across thousands of quantitative ... [https://journals.plos.org/plosgenetics/article?id=10.1371/journal.pgen.1009892]
- 24. The Dynamics of Incomplete Lineage Sorting across ... [https://pmc.ncbi.nlm.nih.gov/articles/PMC4540587/]
- 25. Adaptive Introgression as an Evolutionary Force: A Meta ... [https://pmc.ncbi.nlm.nih.gov/articles/PMC12181397/]
- 26. A New Method to Scan Genomes for Introgression in a ... [https://pmc.ncbi.nlm.nih.gov/articles/PMC4396994/]
- 27. Pervasive gene flow despite strong and varied ... [https://www.nature.com/articles/s41559-025-02669-9]
- 28. Standing genetic variation and introgression shape the ... [https://www.nature.com/articles/s42003-025-08120-w]
- 29. Widespread incomplete lineage sorting and introgression ... [https://www.sciencedirect.com/science/article/pii/S2590346223002742]
- 30. Mitonuclear discordance of beetles shaped by incomplete ... [https://pubmed.ncbi.nlm.nih.gov/41215585/]
- 31. Introgression at the emerging secondary contact zone of ... [https://link.springer.com/article/10.1007/s13127-022-00568-6]
- 32. Asymmetric Distribution of Gene Trees Can Arise under ... [https://pubmed.ncbi.nlm.nih.gov/31638156/]
- 33. IcyTree [https://icytree.org/]
- 34. FigTree [https://tree.bio.ed.ac.uk/software/figtree/]
- 35. Phylogenomic approaches to detecting and characterizing ... [https://pmc.ncbi.nlm.nih.gov/articles/PMC9208645/]
- 36. Distinguishing between Incomplete Lineage Sorting and ... [https://pmc.ncbi.nlm.nih.gov/articles/PMC4074047/]
- 37. ABBA BABA statistics [https://evomics.org/learning/population-and-speciation-genomics/2018-population-and-speciation-genomics/abba-baba-statistics/]
- 38. D-statistics for Dummies: A simple test for introgression [https://avianhybrids.wordpress.com/2019/11/09/d-statistics-for-dummies-a-simple-test-for-introgression/]
- 39. Importance of incomplete lineage sorting and introgression ... [https://www.nature.com/articles/hdy201672]
- 40. Signatures of Introgression across the Allele Frequency ... [https://pmc.ncbi.nlm.nih.gov/articles/PMC7826190/]
- 41. The performance of coalescent-based species tree estimation ... [https://bmcgenomics.biomedcentral.com/articles/10.1186/s12864-018-4619-8]
- 42. Phylogenomic Analyses Reveal Species Relationships ... [https://www.mdpi.com/2223-7747/14/13/2083]
- 43. Challenges in Species Tree Estimation Under the ... [https://pmc.ncbi.nlm.nih.gov/articles/PMC5161269/]
- 44. genome-scale coalescent-based species tree estimation [https://pmc.ncbi.nlm.nih.gov/articles/PMC4147915/]
- 45. genome-scale coalescent-based species tree estimation [https://pubmed.ncbi.nlm.nih.gov/25161245/]
- 46. STELAR: a statistically consistent coalescent-based species ... [https://bmcgenomics.biomedcentral.com/articles/10.1186/s12864-020-6519-y]
- 47. Data: ASTRAL-II: coalescent-based species tree estimation ... [https://datadryad.org/dataset/doi:10.6076/D10C7C]
- 48. ASTRAL: genome-scale coalescent-based species tree ... [https://datadryad.org/dataset/doi:10.5061/dryad.ht76hdrp0]
- 49. Inferring Phylogenetic Networks Using PhyloNet - PMC [https://pmc.ncbi.nlm.nih.gov/articles/PMC6005058/]
- 50. PhyloNet: a software package for analyzing and ... [https://bmcbioinformatics.biomedcentral.com/articles/10.1186/1471-2105-9-322]
- 51. On the inference of complex phylogenetic networks by Markov ... [https://pmc.ncbi.nlm.nih.gov/articles/PMC8445492/]
- 52. Calculating and interpreting gene- and site - concordance factors in... [https://robertlanfear.com/blog/files/concordance_factors.html]
- 53. Updated site factors minimize effects of homoplasy and... concordance [https://pmc.ncbi.nlm.nih.gov/articles/PMC9805551/]
- 54. Quantitative Data Analysis. A Complete Guide [2025] [https://www.6sigma.us/six-sigma-in-focus/quantitative-data-analysis/]
- 55. A multispecies coalescent model for quantitative traits [https://elifesciences.org/articles/36482]
- 56. Brownian motion · Phylogenetic Comparative Methods [https://lukejharmon.github.io/pcm/chapter3_bmintro/]
- 57. Using ancestral information to detect and localize quantitative ... [https://pmc.ncbi.nlm.nih.gov/articles/PMC3706278/]
- 58. The contribution of incomplete lineage sorting and ... [https://www.sciencedirect.com/science/article/abs/pii/S1055790322002068]
- 59. The genomic landscape, causes, and consequences of ... [https://pmc.ncbi.nlm.nih.gov/articles/PMC10491188/]
- 60. Phylotranscriptomic discordance is best explained by ... [https://pmc.ncbi.nlm.nih.gov/articles/PMC10851291/]
- 61. Transcriptome-based phylogenomic analysis reveals ... [https://www.frontiersin.org/journals/ecology-and-evolution/articles/10.3389/fevo.2023.1215319/full]
- 62. A Guide to Carrying Out a Phylogenomic Target Sequence ... [https://pmc.ncbi.nlm.nih.gov/articles/PMC7047930/]
- 63. TreeExp2: An Integrated Framework for Phylogenetic ... [https://pmc.ncbi.nlm.nih.gov/articles/PMC6934891/]
- 64. Impact of incomplete lineage sorting and natural selection on ... [https://pmc.ncbi.nlm.nih.gov/articles/PMC12528535/]
- 65. An integrative framework reveals widespread gene flow ... [https://pmc.ncbi.nlm.nih.gov/articles/PMC12016745/]
- 66. How to Tackle Phylogenetic Discordance in Recent and ... [https://www.frontiersin.org/journals/plant-science/articles/10.3389/fpls.2021.765719/full]
- 67. Incomplete lineage sorting and hybridization underlie tree ... [https://www.sciencedirect.com/science/article/abs/pii/S1055790324001283]
- 68. “Correcting” Gene Trees to be More Like Species ... [https://pmc.ncbi.nlm.nih.gov/articles/PMC10263008/]
- 69. Gene Tree Estimation Error with Ultraconserved Elements [https://pubmed.ncbi.nlm.nih.gov/33367855/]
- 70. BUCKy: A program for Bayesian Concordance Analysis [https://pages.stat.wisc.edu/~ane/bucky/]
- 71. iGTP: A software package for large-scale gene tree parsimony ... [https://pmc.ncbi.nlm.nih.gov/articles/PMC3002902/]
- 72. esayyari/DiscoVista [https://github.com/esayyari/DiscoVista]
- 73. Pan-mitogenomics reveals the genetic basis of cytonuclear ... [https://pmc.ncbi.nlm.nih.gov/articles/PMC9618123/]
- 74. Determining the probability of hemiplasy in the presence ... [https://pmc.ncbi.nlm.nih.gov/articles/PMC7800383/]
- 75. Convergent evolution [https://en.wikipedia.org/wiki/Convergent_evolution]
- 76. What does convergent evolution mean? The interpretation of ... [https://pmc.ncbi.nlm.nih.gov/articles/PMC4633856/]
- 77. Quantification provides a conceptual basis for convergent ... [https://pmc.ncbi.nlm.nih.gov/articles/PMC6849873/]
- 78. Preselection of QTL markers enhances accuracy of genomic ... [https://bmcgenomics.biomedcentral.com/articles/10.1186/s12864-023-09250-3]
- 79. Gene Tree Discord, Simplex Plots, and Statistical Tests under ... [https://pmc.ncbi.nlm.nih.gov/articles/PMC9203069/]
- 80. Inferring multi-locus selection in admixed populations [https://journals.plos.org/plosgenetics/article?id=10.1371/journal.pgen.1011062]
- 81. Selecting informative genes for discriminant analysis using ... [https://pmc.ncbi.nlm.nih.gov/articles/PMC2559878/]
- 82. Incomplete lineage sorting and introgression among genera and... [https://pmc.ncbi.nlm.nih.gov/articles/PMC12039212/]
- 83. Phylogenomic analyses highlight innovation and introgression ... [https://pmc.ncbi.nlm.nih.gov/articles/PMC8921187/]
- 84. Phylogenetic Discordance between Species Tree and ... [https://www.mdpi.com/2673-4931/22/1/27]
- 85. Data Visualizations, Charts, and Graphs - Digital Accessibility [https://accessibility.huit.harvard.edu/data-viz-charts-graphs]
- 86. Primate phylogenomics uncovers multiple rapid radiations ... [https://pmc.ncbi.nlm.nih.gov/articles/PMC7738166/]
- 87. An approximate likelihood method reveals ancient gene ... [https://peercommunityjournal.org/articles/10.24072/pcjournal.359/]
- 88. Hybridization and incomplete lineage sorting characterize ... [https://www.sciencedirect.com/science/article/abs/pii/S1055790325001897]
- 89. Complex Evolutionary History With Extensive Ancestral ... [https://pubmed.ncbi.nlm.nih.gov/37987553/]
- 90. The effects of introgression across thousands ... [https://pubmed.ncbi.nlm.nih.gov/34748547/]
- 91. Genomic Analysis of Wild Tomato Introgressions ... [https://pmc.ncbi.nlm.nih.gov/articles/PMC2850009/]
- 92. Introgressed eggplant lines with the wild Solanum incanum ... [https://www.sciencedirect.com/science/article/pii/S2095311924000868]
- 93. Whole-genomes illuminate the drivers of gene tree ... [https://pubmed.ncbi.nlm.nih.gov/41190526/]
- 94. Data: Whole-genomes illuminate the drivers of gene tree ... [https://datadryad.org/dataset/doi:10.5061/dryad.7h44j102s]
- 95. Complexity of avian evolution revealed by family-level ... [https://www.nature.com/articles/s41586-024-07323-1]
- 96. The dynamics of introgression across an avian radiation [https://pmc.ncbi.nlm.nih.gov/articles/PMC8645201/]
- 97. A Phenotypic Point of View of the Adaptive Radiation of Crested Newts (Triturus cristatus Superspecies, Caudata, Amphibia) - PMC [https://www.ncbi.nlm.nih.gov/pmc/articles/PMC3270399/]
- 98. Widespread reticulate evolution in an adaptive radiation - PubMed [https://pubmed.ncbi.nlm.nih.gov/36688802/]
- 99. Phylogenetic analysis of combined mitochondrial genome and 32 nuclear genes provides key insights into molecular systematics and historical biogeography of Asian warty newts of the genus Paramesotriton (Caudata: Salamandridae) - PMC [https://pmc.ncbi.nlm.nih.gov/articles/PMC9486517/]
- 100. Population Genetics Provides Insights Into the Impact of ... [https://pmc.ncbi.nlm.nih.gov/articles/PMC11968420/]
- 101. Prevalence and Adaptive Impact of Introgression [https://pubmed.ncbi.nlm.nih.gov/34579539/]
- 102. Extensive Genome-Wide Phylogenetic Discordance Is Due to ... [https://pmc.ncbi.nlm.nih.gov/articles/PMC8233498/]
- 103. Introgression impacts the evolution of bacteria, but species ... [https://www.nature.com/articles/s41467-025-64947-1]
- 104. Disentangling Sources of Gene Tree Discordance in ... [https://pmc.ncbi.nlm.nih.gov/articles/PMC7875436/]
- 105. Evaluating evolutionary history in the face of high gene tree ... [https://www.nature.com/articles/hdy20146]
- 106. Comparative Analysis of Artemisia Plastomes, with ... [https://pmc.ncbi.nlm.nih.gov/articles/PMC12564433/]