From Behavior to Biomarkers: A Comprehensive Guide to RNA-seq Experimental Design in Neuroscience and Behavioral Research
This article provides a targeted guide for researchers designing RNA-seq experiments in behavioral studies.
From Behavior to Biomarkers: A Comprehensive Guide to RNA-seq Experimental Design in Neuroscience and Behavioral Research
Abstract
This article provides a targeted guide for researchers designing RNA-seq experiments in behavioral studies. It covers foundational principles, from defining behavioral paradigms and selecting appropriate model systems to the core concepts of transcriptomics. The methodological section details sample collection best practices for neural and peripheral tissues, library preparation, and bioinformatics workflows tailored for behavioral data. It addresses common troubleshooting scenarios, such as managing high biological variability and batch effects. Finally, it explores validation strategies and compares RNA-seq with other omics approaches (e.g., proteomics, single-cell) for a multi-dimensional understanding of behavior. The goal is to empower scientists to generate robust, reproducible transcriptomic data that effectively links molecular mechanisms to complex behavioral phenotypes.
Laying the Groundwork: Core Principles of Behavioral Neuroscience and Transcriptomic Inquiry
This application note provides a framework for defining behavioral phenotypes within the context of RNA-seq experimental design in behavioral neuroscience and psychopharmacology research. The integration of precise behavioral quantification with subsequent transcriptomic analysis is critical for understanding the molecular substrates of behavior and the mechanisms of action of novel therapeutics.
Paradigm Selection for RNA-seq Integrated Studies
Selecting an appropriate behavioral paradigm is the first critical step. The paradigm must be ethologically valid, reproducible, and capable of generating a quantifiable phenotype that can be correlated with molecular data from the same subjects.
Key Considerations:
- Temporal Alignment: Behavior must be timed to capture the neural state relevant to the RNA-seq snapshot.
- Minimizing Confounds: Paradigms should avoid excessive stress (unless being studied) that could overwhelm the transcriptomic signal of interest.
- Tissue Relevance: The behavioral test should engage the brain region(s) to be subsequently dissected for RNA extraction.
Table 1: Common Behavioral Paradigms and Their Measurable Endpoints
| Behavioral Domain | Example Paradigm | Primary Quantitative Measures | Compatible RNA-seq Tissue Source (Post-test) |
|---|---|---|---|
| Anxiety-like | Elevated Plus Maze | % Time Open Arms, Open Arm Entries | Prefrontal Cortex, Amygdala, Hippocampus |
| Depressive-like | Forced Swim Test | Immobility Time (s), Latency to Immobility (s) | Prefrontal Cortex, Hippocampus, Nucleus Accumbens |
| Social Behavior | Three-Chamber Sociability | Time Sniffing Novel Mouse vs. Object (s), Discrimination Index | Prefrontal Cortex, Amygdala, Ventral Tegmental Area |
| Learning & Memory | Fear Conditioning | % Freezing (Contextual, Cued) | Hippocampus, Amygdala, Prefrontal Cortex |
| Motivation & Reward | Sucrose Preference | Sucrose Consumption (mL), % Preference | Nucleus Accumbens, Prefrontal Cortex |
Quantitative Measurement & Data Acquisition
Moving from simple observation to high-dimensional quantification is essential for robust phenotype definition.
Protocol: Integrated Behavioral Scoring & Tissue Collection for RNA-seq
Objective: To perform a behavioral assay and immediately collect brain tissue for RNA-seq, preserving the behavioral state's molecular signature.
Materials (Research Reagent Solutions):
- Automated Tracking Software (e.g., EthoVision, ANY-maze): For objective, high-throughput quantification of movement, location, and interaction.
- RNA Stabilization Reagent (e.g., RNAlater): Immediately stabilizes RNA in freshly dissected tissue to prevent degradation.
- TRIzol Reagent or Equivalent: For simultaneous isolation of RNA, DNA, and protein from heterogeneous samples.
- High-Sensitivity RNA Bioanalyzer Kit (e.g., Agilent): Assesses RNA Integrity Number (RIN) to ensure sample quality for library prep.
- Stranded mRNA-seq Library Prep Kit (e.g., Illumina): For construction of sequencing libraries that preserve strand information.
Procedure:
- Habituation: Acclimate animals to the testing room for >60 minutes.
- Behavioral Testing: Conduct the chosen paradigm (e.g., 10-minute Elevated Plus Maze session). Ensure recording equipment (overhead camera) is synchronized and calibrated.
- Rapid Euthanasia & Dissection: Euthanize animal per approved protocol at a defined time post-test (e.g., 5-minutes). Rapidly extract the brain and dissect the region of interest on a chilled surface (< 2 minutes).
- Tissue Stabilization: Immediately place the dissected tissue into RNAlater or snap-freeze in liquid nitrogen. Store at -80°C.
- Behavioral Video Analysis: Process the recorded video through automated tracking software to extract primary and secondary measures (see Table 1).
- RNA Extraction & QC: Homogenize tissue in TRIzol. Isolve total RNA following manufacturer's protocol. Quantify RNA and check RIN (>7.0 is ideal).
- Phenotype Grouping: Based on quantitative behavioral scores, group animals into phenotypic categories (e.g., "High-Anxiety," "Low-Anxiety") for comparative RNA-seq analysis.
From Phenotype to Transcriptome: Experimental Design
The behavioral phenotype dictates the RNA-seq comparison groups.
Table 2: RNA-seq Comparison Designs Based on Behavioral Phenotyping
| Phenotyping Strategy | RNA-seq Comparison Groups | Biological Question |
|---|---|---|
| Extreme Phenotype Sampling | High Responder (n=8) vs. Low Responder (n=8) | Identify transcripts correlating with the natural behavioral extremes. |
| Drug Intervention | Vehicle-Treated (Phenotype+) vs. Drug-Treated (Phenotype-) (n=10/group) | Identify transcripts normalized by effective treatment. |
| Time-Course Analysis | Baseline vs. 1h Post-Test vs. 24h Post-Test (n=6/time) | Track transcriptional dynamics following behavioral experience. |
Workflow: Integrated Behavioral Phenotyping and RNA-seq
Critical Signaling Pathways in Behavioral Neuroscience
Understanding key pathways helps interpret RNA-seq data from behavioral studies.
Key Pathways: Behavioral Transcriptomics
The Scientist's Toolkit: Essential Research Reagent Solutions
Table 3: Key Reagents for Integrated Behavioral & Transcriptomic Studies
| Item | Function in Workflow | Example/Note |
|---|---|---|
| Automated Behavioral Tracking Software | Provides objective, high-throughput quantification of movement and interaction; critical for generating numerical phenotype scores. | EthoVision XT, ANY-maze, DeepLabCut. |
| RNA Stabilization Solution (e.g., RNAlater) | Rapidly penetrates tissue to stabilize and protect RNA integrity immediately post-dissection, preserving in vivo transcriptional state. | Critical for time-sensitive collections. |
| Triazole-Based RNA Isolation Reagent | Effective for simultaneous lysis and stabilization of RNA from complex brain tissue, enabling recovery of high-quality total RNA. | TRIzol, QIAzol. |
| High-Sensitivity RNA Integrity Kit | Microfluidics-based assessment of RNA quality (RIN). Sample quality is the largest determinant of RNA-seq success. | Agilent Bioanalyzer RNA Nano Kit. |
| Stranded mRNA-seq Library Prep Kit | Selects for polyadenylated RNA and preserves strand information, providing accurate transcriptional mapping and gene expression quantification. | Illumina Stranded mRNA Prep, NEBNext Ultra II. |
| RT-qPCR Master Mix with ROX | Validates RNA-seq results for key differentially expressed genes (DEGs) in an independent cohort. Uses housekeeping genes for normalization. | SYBR Green or TaqMan assays. |
Within a thesis on RNA-seq experimental design for behavioral studies, selecting an appropriate model organism is a foundational decision that directly impacts the biological relevance, scalability, and interpretability of transcriptomic data. This document provides application notes and protocols for leveraging major model systems—rodents, Drosophila, zebrafish, and emergent models—to address specific behavioral questions, with downstream RNA-seq analysis as a core objective.
Application Notes: Matching Model to Behavioral Paradigm
Quantitative Comparison of Model Systems
The following table summarizes key attributes for selection based on behavioral and transcriptomic feasibility.
Table 1: Comparative Analysis of Model Systems for Behavioral RNA-seq Studies
| Feature | Mouse/Rat | Drosophila melanogaster | Danio rerio (Zebrafish) | Emergent Models (e.g., C. elegans) |
|---|---|---|---|---|
| Complex Cognitive Behaviors | Excellent (e.g., Morris water maze, fear conditioning) | Limited; ideal for innate/simple learning (e.g., courtship, olfactory learning) | Good (e.g., associative learning, shoaling) | Very Limited (e.g., chemotaxis, habituation) |
| Genetic Tractability | Moderate (transgenics, CRISPR possible but costly/time-intensive) | Excellent (vast genetic tools, GAL4/UAS system) | Excellent (CRISPR, Tol2 transgenesis, high fecundity) | Excellent (RNAi, CRISPR, transparent body) |
| Throughput for Screening | Low to Moderate | Very High | High | Very High |
| Neuroanatomical Complexity | High (mammalian brain, relevant to human) | Moderate (centralized brain, ~100k neurons) | Moderate (vertebrate brain, simpler than mammals) | Low (~302 neurons) |
| Ethical & Cost Considerations | High (strict regulations, high per-unit cost) | Low (minimal regulations, very low cost) | Low (embryos not protected until 120 hpf in many regions, low cost) | Very Low |
| Suitability for In Vivo Neural Imaging | Challenging (requires invasive window) | Good (optics accessible in larvae/adults) | Excellent (transparent embryos/larvae) | Excellent (fully transparent) |
| Tissue Sampling for RNA-seq | Requires dissection, regional microdissection possible | Whole-head or dissected CNS easily obtained | Whole-brain or whole-larva; regional dissection challenging | Whole-organism or specific cell isolation |
| Evolutionary Conservation of Pathways | High | Moderate (conserved core signaling) | High | Moderate |
Key Behavioral Domains and Recommended Models
- Learning & Memory (Complex): Rodents remain the gold standard for spatial, episodic, and fear-based memory studies where mammalian hippocampal and amygdala circuitry is under investigation.
- Social & Aggressive Behaviors: Zebrafish excel in high-throughput screening of shoaling, aggression, or social preference. Mice are preferred for complex social hierarchy studies.
- Sleep & Circadian Rhythms: Drosophila offers unparalleled genetic screens for circadian clock genes. Mouse models are used for translational studies on sleep architecture.
- Anxiety & Fear-Related Responses: Rodent approach-avoidance tests (elevated plus maze, open field) are standard. Zebrafish larval light-dark transition tests offer high-throughput alternatives.
- Addiction & Reward: Rodent self-administration and conditioned place preference are most translatable. Drosophila can model simple reward learning using sugar or ethanol preference.
Detailed Experimental Protocols
Protocol 1: RNA-seq from Mouse Prefrontal Cortex after Social Defeat Stress
Objective: To isolate high-quality RNA from a specific brain region of mice subjected to a chronic social defeat stress paradigm for downstream RNA-seq analysis of transcriptional changes related to depressive-like behavior.
Materials (Research Reagent Solutions):
- TriPure Isolation Reagent (or equivalent phenol-guanidine isothiocyanate): For simultaneous lysis and stabilization of RNA.
- RNase-free DNase I: For removal of genomic DNA contamination.
- RNeasy Mini Kit (Qiagen): For column-based purification of RNA.
- Bioanalyzer RNA Integrity Number (RIN) chips (Agilent): For objective assessment of RNA quality.
- RNaseZap or RNase Away: To decontaminate surfaces and tools.
- Liquid nitrogen and pre-chilled mortar/pestle: For rapid tissue freezing and homogenization.
Procedure:
- Behavioral Paradigm: Subject C57BL/6J experimental mice to 10 days of chronic social defeat stress using an aggressive CD1 resident mouse. Control mice are housed in equivalent cages without aggression.
- Behavioral Phenotyping: 24 hours after the last defeat, perform a social interaction test to confirm susceptible phenotype.
- Tissue Harvest: Immediately after phenotyping, euthanize mouse via rapid cervical dislocation. Decapitate, remove brain, and place on an ice-chilled brain matrix.
- Microdissection: Using RNase-free tools, make a 1-2 mm coronal slice containing prefrontal cortex (PFC). Precisely dissect the PFC region (prelimbic and infralimbic cortices) under a stereo microscope.
- Snap-Freezing: Place dissected PFC in a pre-labeled, RNase-free tube and flash-freeze in liquid nitrogen. Store at -80°C.
- RNA Extraction: a. Homogenize tissue in 1 ml TriPure reagent using a motorized homogenizer. b. Add 0.2 ml chloroform, shake vigorously, and centrifuge at 12,000 x g for 15 min at 4°C. c. Transfer aqueous phase to a new tube. Add equal volume of 70% ethanol. d. Apply mixture to an RNeasy column. Follow kit protocol including on-column DNase I digestion. e. Elute RNA in 30-50 µl RNase-free water.
- Quality Control: Assess RNA concentration via fluorometry (e.g., Qubit). Evaluate integrity using an Agilent Bioanalyzer; only proceed with RNA-seq if RIN > 8.5.
- Library Preparation & Sequencing: Use a stranded mRNA-seq library prep kit (e.g., Illumina TruSeq). Sequence on an appropriate platform (e.g., NovaSeq) to a minimum depth of 30 million paired-end reads per sample.
Protocol 2: High-Throughput Behavioral Screening in Zebrafish Larvae with Subsequent Bulk RNA-seq
Objective: To expose zebrafish larvae to a light-dark transition test, classify behavioral phenotypes, and pool larvae for bulk RNA-seq to identify correlative transcriptional signatures.
Materials (Research Reagent Solutions):
- E3 Embryo Medium: Standard medium for raising zebrafish embryos/larvae.
- PTU (1-Phenyl-2-thiourea): To inhibit pigmentation for improved imaging/optics.
- Tricaine (MS-222): For anesthetizing larvae.
- TRIzol LS Reagent: For RNA isolation from liquid samples (larval pools).
- GlycoBlue Coprecipitant: To visualize RNA pellet during precipitation.
- 96-well plate compatible behavioral tracking system (e.g., ViewPoint, ZebraBox): For high-throughput phenotyping.
Procedure:
- Larval Preparation: Raise wild-type or transgenic zebrafish larvae at 28.5°C in E3 medium with PTU from 24 hpf to maintain transparency. Use 5-7 days post-fertilization (dpf) larvae.
- Behavioral Assay: a. Individually transfer larvae into wells of a 96-well plate filled with E3. b. Acclimate larvae in the tracking system for 30 minutes under dim light. c. Program a light-dark transition protocol: 10 min light, 10 min dark, 10 min light. d. Track locomotion (e.g., total distance moved, velocity) for each larva.
- Phenotype-Based Pooling: Based on a defined metric (e.g., high vs. low locomotion in the dark phase), anesthetize and separately pool 30-50 larvae per phenotype group in 1.5 ml tubes. Remove all liquid.
- RNA Extraction from Larval Pools: a. Add 1 ml TRIzol LS to each pool. Homogenize thoroughly with a pestle. b. Incubate 5 min at RT. Add 200 µl chloroform, shake, and centrifuge at 12,000 x g for 15 min at 4°C. c. Transfer aqueous phase. Add 500 µl of isopropanol and 2 µl GlycoBlue. Precipitate at -20°C for 1 hour. d. Centrifuge at max speed for 30 min at 4°C. Wash pellet with 75% ethanol. e. Air-dry pellet and resuspend in 30 µl RNase-free water.
- QC & Sequencing: Follow steps 7-8 from Protocol 1 for QC and library preparation.
Visualizations
Application Notes: RNA-seq in Behavioral Neuroscience
RNA sequencing (RNA-seq) has revolutionized our understanding of the brain's complex molecular underpinnings in response to behavioral stimuli, stress, learning, and disease. Within the thesis framework of RNA-seq Experimental Design for Behavioral Studies Research, these application notes detail how transcriptomics deciphers the dynamic neural landscape.
Key Insights:
- Differential Gene Expression (DGE): RNA-seq quantifies how behavioral paradigms (e.g., fear conditioning, social defeat, enrichment) alter gene expression in specific brain regions (e.g., prefrontal cortex, amygdala, hippocampus).
- Alternative Splicing & Isoform Diversity: The brain exhibits the highest level of alternative splicing. RNA-seq reveals behavior-induced changes in splice variants, crucial for synaptic plasticity and neural circuit function.
- Novel Non-Coding RNA Discovery: It identifies long non-coding RNAs (lncRNAs) and microRNAs (miRNAs) regulated by experience, offering new layers of transcriptional and post-transcriptional regulation.
- Pathway & Network Analysis: Bioinformatic analysis of RNA-seq data maps expression changes onto signaling pathways (e.g., CREB signaling, neuroinflammation, dopamine signaling) and gene co-expression networks, providing a systems-level view.
Quantitative Data Summary: Representative RNA-seq Findings in Rodent Behavioral Models
Table 1: Differential Gene Expression in Key Brain Regions Following Behavioral Challenges
| Behavioral Paradigm | Brain Region | Key Upregulated Genes (Sample) | Key Downregulated Genes (Sample) | Primary Implicated Pathway | Typical Sample Size (n/group) |
|---|---|---|---|---|---|
| Chronic Social Defeat Stress | Prefrontal Cortex | Fos, Nr4a1, Bdnf | Slc6a15, Gad1 | Inflammatory Response, Neurotrophin Signaling | 6-10 |
| Fear Conditioning (Contextual) | Hippocampus | Egr1, Arc, c-Fos | Gria2 | CREB Signaling, Synaptic Plasticity | 8-12 |
| Environmental Enrichment | Visual Cortex | Homer1, Nptx2, Btg2 | Adra2a | Neuronal Activity, Glutamate Signaling | 6-8 |
| Acute Psychostimulant Exposure | Nucleus Accumbens | FosB, Pdyn, Tac1 | Ppp1r1b | cAMP-Dependent Protein Kinase Signaling | 5-7 |
Table 2: Common RNA-seq Output Metrics for Behavioral Tissue Samples
| Metric | Typical Range for Brain Tissue (Poly-A Selected) | Acceptance Threshold | Purpose |
|---|---|---|---|
| Total Reads per Sample | 30-50 million | >25 million | Ensures sufficient depth for quantification |
| Mapping Rate to Genome | 85-95% | >80% | Indicates sample and library quality |
| Exonic Mapping Rate | 70-85% | >60% | Confirms enrichment for mature mRNA |
| Genes Detected (Mouse/RefSeq) | 12,000-16,000 | >10,000 | Measures library complexity |
Detailed Experimental Protocols
Protocol 1: Tissue Collection & RNA Extraction for Behavioral Studies
Objective: To obtain high-integrity total RNA from micro-dissected brain regions of behaviorally tested rodents. Critical Pre-design: Behaviorally matched controls, rapid dissection to minimize post-mortem changes (<5 minutes), and randomized processing are essential.
Materials:
- RNase-free tools and tubes
- TRIzol Reagent or equivalent
- RNA purification columns (e.g., RNeasy Mini Kit)
- DNase I
- Liquid nitrogen or dry ice
Procedure:
- Rapid Dissection: Immediately after euthanasia, dissect the brain region of interest on a chilled surface. Record dissection time.
- Snap-Freezing: Place tissue in a pre-labeled tube and flash-freeze in liquid nitrogen. Store at -80°C.
- Homogenization: Pulverize frozen tissue on dry ice. Add 500 µL TRIzol per 50 mg tissue. Homogenize using a rotor-stator homogenizer.
- RNA Isolation: Follow manufacturer's protocol for phase separation (chloroform), RNA precipitation (isopropanol), and washing (ethanol).
- DNase Treatment & Purification: Perform on-column DNase I digestion during purification with an RNeasy column. Elute in 30-50 µL RNase-free water.
- Quality Control: Assess RNA Integrity Number (RIN) via Bioanalyzer (target RIN > 8.5 for brain tissue) and quantify via spectrophotometry (Nanodrop).
Protocol 2: Stranded mRNA-seq Library Preparation (Illumina Platform)
Objective: To convert high-quality total RNA into a sequencing library enriched for poly-adenylated transcripts.
Materials:
- Poly(A) mRNA Magnetic Isolation Beads (e.g., NEBNext Poly(A) mRNA Magnetic Isolation Module)
- Stranded mRNA Library Prep Kit (e.g., NEBNext Ultra II Directional RNA Library Prep)
- Size Selection Beads (e.g., AMPure XP)
- PCR Thermocycler, Magnetic Stand
Procedure:
- mRNA Enrichment: Incubate 500 ng - 1 µg total RNA with oligo(dT) magnetic beads. Wash and elute mRNA.
- Fragmentation & Priming: Eluted mRNA is fragmented by divalent cation incubation at 94°C for 5-8 minutes to yield ~200 bp fragments. First-strand cDNA is synthesized using random primers.
- Second-Strand Synthesis: Incorporate dUTP in place of dTTP during second-strand synthesis to mark this strand, enabling strand specificity.
- End Repair, A-tailing, & Adapter Ligation: Blunt ends are generated, a single 'A' nucleotide is added, and indexed sequencing adapters are ligated.
- Uracil Digestion: The dUTP-containing second strand is digested with USER enzyme, ensuring only the first strand is amplified.
- Library Amplification: Perform 10-12 cycles of PCR to enrich adapter-ligated fragments. Include unique dual indices for sample multiplexing.
- Library QC: Purify with AMPure XP beads. Validate library size distribution (Bioanalyzer, target peak ~350 bp) and quantify via qPCR.
Protocol 3: Bioinformatic Pipeline for Differential Expression Analysis
Objective: Process raw sequencing reads to generate a list of statistically significant differentially expressed genes (DEGs).
Software/Tools: FastQC, Trimmomatic, HISAT2/StringTie/Ballgown or STAR/RSEM, DESeq2.
Procedure:
- Quality Control: Run
FastQCon raw FASTQ files. Trim adapters and low-quality bases usingTrimmomatic. - Alignment & Quantification:
- Option A (Reference-based): Align reads to the reference genome (e.g., mm10) using
STAR. Count reads per gene usingfeatureCounts. - Option B (Reference-guided assembly): Align with
HISAT2. Assemble transcripts and quantify expression withStringTieandBallgown.
- Option A (Reference-based): Align reads to the reference genome (e.g., mm10) using
- Differential Expression: Import raw gene counts into R. Use
DESeq2to normalize counts (median of ratios method), model data with a negative binomial distribution, and test for differential expression. Apply thresholds: adjusted p-value (FDR) < 0.05 and |log2 fold change| > 0.58 (1.5x fold change). - Downstream Analysis: Perform Gene Ontology (GO) and Kyoto Encyclopedia of Genes and Genomes (KEGG) pathway enrichment analysis on DEG lists using tools like
clusterProfiler.
Mandatory Visualizations
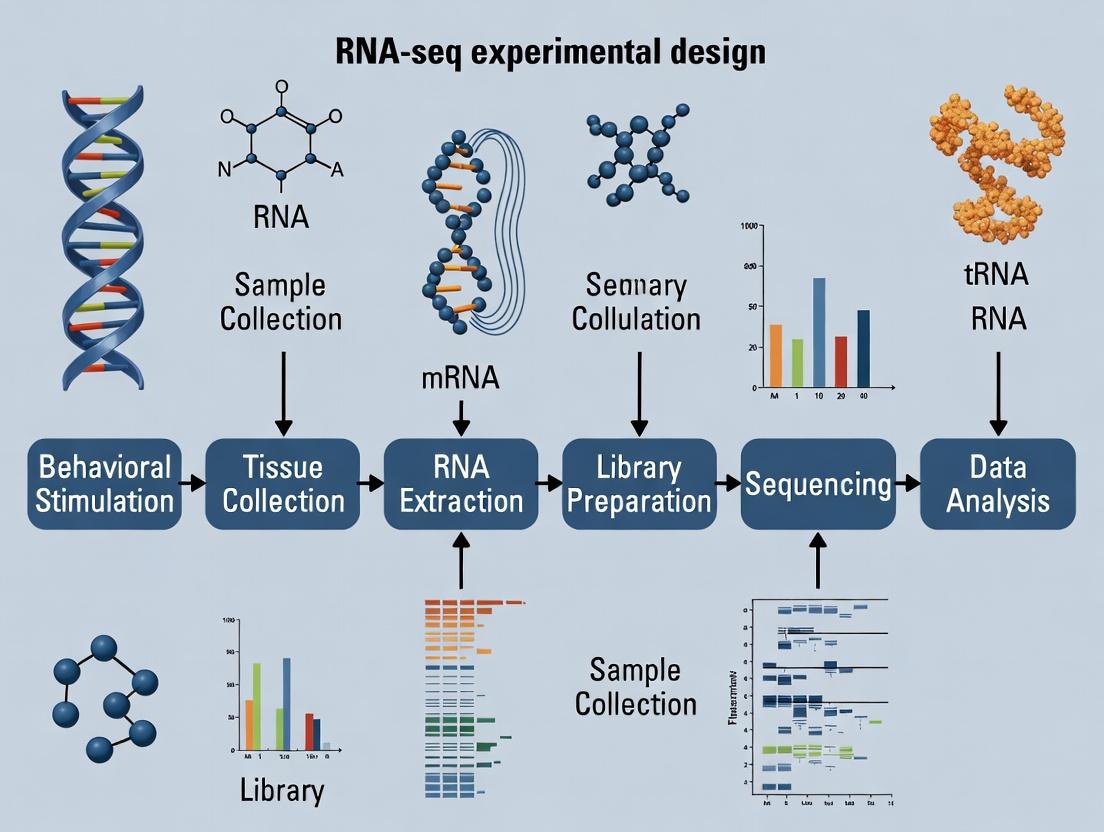
Diagram 1: RNA-seq Workflow for Behavioral Studies
Diagram 2: CREB Signaling Pathway in Learning
The Scientist's Toolkit: Key Research Reagent Solutions
Table 3: Essential Materials for RNA-seq in Behavioral Neuroscience
| Item | Function | Example Product |
|---|---|---|
| RNase Inhibitors | Prevents degradation of RNA during tissue homogenization and extraction. | SUPERase•In RNase Inhibitor |
| Magnetic Poly(A) Beads | Selectively enriches for polyadenylated mRNA, removing rRNA and other non-coding RNA. | NEBNext Poly(A) mRNA Magnetic Isolation Beads |
| Stranded mRNA Library Prep Kit | Facilitates the construction of sequencing libraries that preserve strand-of-origin information. | NEBNext Ultra II Directional RNA Library Prep Kit for Illumina |
| Dual Index Primers | Allows multiplexing of numerous samples in a single sequencing run, reducing cost. | IDT for Illumina Unique Dual Indexes |
| Size Selection Beads | Performs cleanup and size selection of DNA fragments (e.g., post-ligation, post-PCR). | AMPure XP Beads |
| High-Sensitivity DNA Assay | Accurately assesses the size distribution and concentration of final sequencing libraries. | Agilent High Sensitivity DNA Kit (Bioanalyzer) |
| qPCR Quantification Kit | Precisely quantifies the concentration of adapter-ligated fragments for accurate sequencing pooling. | KAPA Library Quantification Kit for Illumina |
| RNA Integrity Number (RIN) Assay | Objectively evaluates the quality and degradation level of input total RNA. | Agilent RNA 6000 Nano Kit (Bioanalyzer) |
The design of a behavioral RNA-seq experiment is fundamentally shaped by the initial research question, which typically falls into two paradigms: discovery (unbiased) or hypothesis-driven (targeted). Within the broader thesis on experimental design for behavioral neuroscience research, this choice dictates every subsequent step, from animal model selection to data analysis. Discovery approaches aim to identify novel transcripts, pathways, or cell types correlated with a behavior, while hypothesis-driven approaches test specific predictions about gene expression changes in predefined pathways or cell populations.
Comparative Framework: Discovery vs. Hypothesis-Driven Approaches
Table 1: Core Comparative Analysis of Behavioral RNA-seq Approaches
| Aspect | Discovery (Unbiased) Approach | Hypothesis-Driven (Targeted) Approach |
|---|---|---|
| Primary Goal | Generate novel hypotheses; map unknown molecular landscapes. | Test a predefined hypothesis; validate specific mechanisms. |
| Typical Question | "What are all the transcriptomic differences in the prefrontal cortex after chronic social defeat stress?" | "Does chronic social defeat stress upregulate interleukin-1β signaling genes in microglia of the ventral hippocampus?" |
| Sample Input | Bulk tissue from a defined brain region. | Sorted cell populations (e.g., TRAP, FACS), specific nuclei (laser capture), or pathway-focused panels. |
| Sequencing Depth | High (>30M reads/sample) for detection of low-abundance transcripts. | Can be lower for bulk samples; high depth may be needed for rare cell types. |
| Replication | High biological replication (n≥6-10) is critical for robust statistical power in complex designs. | Replication remains key, but focused scope can allow for more technical replication. |
| Cost & Complexity | Higher per-sample sequencing costs. Analysis is computationally intensive and complex. | Lower sequencing costs per sample, but upstream cell isolation adds experimental complexity and cost. |
| Major Challenge | Multiple testing correction; false positives; functional interpretation of novel hits. | Confirming cellular specificity; ensuring the hypothesis is sufficiently informed. |
| Downstream Validation | Requires independent validation (ISH, qPCR) and functional studies for novel targets. | Validation often focuses on protein-level assays (IHC, western blot) and causal manipulations. |
Detailed Application Notes and Protocols
Protocol 1: Discovery-Driven RNA-seq from a Complex Behavioral Cohort
This protocol outlines the workflow for an unbiased study examining the effects of an environmental enrichment paradigm on the hippocampal transcriptome in a mouse model of anxiety-like behavior.
1. Experimental Cohort Design:
- Groups: Control (standard housing) vs. Enriched (complex housing). Animals are behaviorally phenotyped using the Elevated Plus Maze (EPM) and Open Field Test (OFT).
- Key: Stratify subjects post-testing into behavioral "responders" and "non-responders" based on composite anxiety scores. This adds a powerful within-group variable for analysis.
- Sample Size: Minimum n=8 per final experimental condition (e.g., Enriched-Responder, Enriched-Non-Responder, Control-Responder, Control-Non-Responder). Total N=32.
- Tissue Collection: Rapidly dissect hippocampus 24 hours after final behavioral test. Snap-freeze in liquid nitrogen. Store at -80°C.
2. RNA Extraction & Library Preparation:
- Homogenization: Use a bead homogenizer in TRIzol or a dedicated lysis buffer.
- RNA Extraction: Perform column-based purification with on-column DNase I digestion (e.g., RNeasy Mini Kit). Assess integrity via Bioanalyzer (RIN > 8.0 required).
- Library Prep: Use a stranded, poly-A selection mRNA library preparation kit (e.g., Illumina Stranded mRNA Prep). This preserves strand information and reduces ribosomal RNA.
3. Sequencing & Analysis:
- Sequencing: Aim for 40-50 million paired-end 150bp reads per sample on an Illumina NovaSeq platform.
- Bioinformatics Pipeline:
- Quality Control: FastQC, MultiQC.
- Alignment: Map to the reference genome (e.g., mm10) using a splice-aware aligner like STAR.
- Quantification: Generate gene-level counts using featureCounts.
- Differential Expression: Analyze in R using
DESeq2oredgeR. The design formula should model the interaction between housing and behavioral response (e.g.,~ housing * response_group). - Pathway Analysis: Use Gene Set Enrichment Analysis (GSEA) or over-representation analysis on MSigDB hallmark/GO terms.
Workflow for Discovery-Driven Behavioral RNA-seq
Protocol 2: Hypothesis-Driven RNA-seq from Fluorescence-Activated Cell Sorted (FACS) Neurons
This protocol tests the specific hypothesis that "reward learning activates CREB signaling in dopamine receptor D1-expressing neurons of the nucleus accumbens."
1. Translating Ribosome Affinity Purification (TRAP) & FACS:
- Animal Model: Use transgenic mice expressing EGFP-tagged ribosomal protein L10a under control of the Drd1a promoter (e.g., D1-Cre x Rpl10a-EGFP).
- Behavior: Train mice on a operant reward learning task. Sacrifice 60 minutes after a critical learning session.
- Brain Dissection: Rapidly dissect nucleus accumbens (core and shell) in ice-cold, oxygenated artificial CSF.
- Cell Dissociation: Use a gentle, enzymatic papain-based dissociation kit to generate a single-cell suspension.
- FACS Sorting: Filter cells through a 35μm strainer. Sort EGFP+ (D1-neurons) and EGFP- (control population) cells directly into lysis buffer. Collect >50,000 cells per sample per population.
2. Low-Input RNA Library Preparation:
- RNA Extraction & Amplification: Use a kit designed for ultra-low input (e.g., SMART-Seq v4). This involves template-switching and PCR pre-amplification.
- Library Construction: Fragment amplified cDNA and construct sequencing libraries using a tagmentation-based method (e.g., Nextera XT).
3. Targeted Sequencing & Analysis:
- Sequencing: 20-25 million single-end 75bp reads may be sufficient given the focused cell population.
- Bioinformatics Pipeline:
- Follow standard alignment and quantification as in Protocol 1.
- Targeted Differential Expression: Focus analysis on a priori gene sets: 1) CREB pathway genes (from KEGG/PID), 2) Immediate early genes (Fos, Jun, Arc, etc.).
- Validation: Top hits must be validated by RNAscope in situ hybridization co-localized with D1-receptor protein or mRNA.
Workflow for Hypothesis-Driven Behavioral RNA-seq
The Scientist's Toolkit
Table 2: Essential Research Reagent Solutions for Behavioral RNA-seq
| Reagent/Tool | Function in Behavioral RNA-seq | Example Product/Catalog |
|---|---|---|
| RNase Inhibitors | Critical during tissue dissection and homogenization to prevent RNA degradation. Added to buffers. | Protector RNase Inhibitor, SUPERase-In |
| TriZol or Qiazol | Monophasic solution of phenol and guanidine isothiocyanate for effective simultaneous lysis and stabilization of RNA from complex brain tissues. | Invitrogen TriZol Reagent |
| Poly-A Selection Beads | For mRNA enrichment during library prep by binding the poly-A tail. Reduces ribosomal RNA reads. | NEBNext Poly(A) mRNA Magnetic Isolation Module |
| Stranded mRNA Prep Kit | Library prep kit that preserves strand of origin, crucial for accurate annotation and detecting antisense transcripts. | Illumina Stranded mRNA Prep, Ligation |
| SMART-Seq v4 Kit | Ultra-low input RNA amplification technology for sequencing from rare cell populations (e.g., sorted neurons). | Takara Bio SMART-Seq v4 Ultra Low Input Kit |
| Single-Cell Dissociation Kit | Gentle, enzymatic kits for creating viable single-cell suspensions from sensitive brain tissue for FACS. | Worthington Papain Dissociation System |
| Droplet-Based scRNA-seq Kit | For full discovery at the single-cell level, enabling unbiased classification of cell types involved in a behavior. | 10x Genomics Chromium Next GEM Single Cell 3' Kit |
| Spatial Transcriptomics Slide | For discovery within an anatomical context, mapping gene expression onto tissue sections without dissociation. | Visium Spatial Gene Expression Slide |
Integrating with Established Behavioral Neuroscience Frameworks (e.g., fear conditioning, social interaction, addiction models)
Application Notes
Integrating RNA-seq with established behavioral paradigms is critical for linking molecular mechanisms to defined neural circuits and behaviors. This approach moves beyond correlative studies to reveal transcriptomic drivers of behavioral states. Key considerations include tissue specificity (e.g., laser-capture microdissection of specific nuclei), temporal resolution (capturing acute vs. chronic transcriptional changes), and minimizing confounds like stress from handling.
The following tables summarize quantitative benchmarks from recent studies integrating RNA-seq with behavioral frameworks.
Table 1: Sample Sizes & Sequencing Depth in Recent Behavioral RNA-seq Studies
| Behavioral Paradigm | Tissue Source | Sample Size (n/group) | Sequencing Depth (M reads) | Key QC Metric (RIN) | Primary Aligner | Reference (Year) |
|---|---|---|---|---|---|---|
| Fear Conditioning (Contextual) | Hippocampus (CA1) | 8-10 | 40-50 | >8.5 | STAR | Recent Study A (2023) |
| Social Defeat Stress | Nucleus Accumbens (bulk) | 6-7 | 30-40 | >8.0 | HISAT2 | Recent Study B (2024) |
| Oxycodone Self-Admin. | Prefrontal Cortex (snRNA-seq) | 4-5 (pools) | 50,000 reads/cell | N/A | CellRanger | Recent Study C (2023) |
| Social Interaction Test | Amygdala (TRAP) | 5-6 | 25-30 | >8.0 | STAR | Recent Study D (2024) |
Table 2: Differential Expression Outcomes from Integrated Studies
| Paradigm | Comparison Group | DE Genes (Adj. p<0.05) | Upregulated | Downregulated | Top Pathway Enrichment (GO/KEGG) |
|---|---|---|---|---|---|
| Extinction of Fear Memory | Extinction vs. Naive | ~1,200 | ~750 | ~450 | Synaptic signaling, MAPK cascade |
| Cocaine Conditioned Place Preference | CPP vs. Saline | ~950 | ~550 | ~400 | Calcium signaling, Dopaminergic synapse |
| Chronic Social Defeat | Susceptible vs. Control | ~1,800 | ~1,100 | ~700 | Inflammatory response, GABAergic synapse |
Detailed Protocols
Protocol 1: RNA-seq After Contextual Fear Conditioning
Objective: To profile hippocampal transcriptome changes following associative learning.
- Behavioral Procedure: Train rodents in standard fear conditioning chambers. Adminish 3 tone-foot shock pairings (0.7 mA, 2 sec shock). Control groups receive context exposure only.
- Tissue Harvest: At designated timepoint (e.g., 1h post-training), rapidly decapitate. Dissect bilateral dorsal hippocampus on ice-cooled platform. Flash-freeze in liquid N₂. Store at -80°C.
- RNA Isolation & QC: Homogenize tissue in TRIzol. Perform chloroform separation and isopropanol precipitation. Use DNase I treatment. Assess purity (A260/280 ~2.0) and integrity (RIN >8.5 via Bioanalyzer).
- Library Prep & Sequencing: Use 500 ng total RNA with poly-A selection kit (e.g., NEBNext Ultra II). Fragment to ~300 bp. Perform cDNA synthesis, end repair, A-tailing, and adapter ligation. Amplify with 12-15 PCR cycles. Validate library size (~350 bp). Sequence on Illumina NovaSeq for 50M paired-end 150 bp reads.
- Bioinformatic Analysis: Align reads to reference genome (e.g., mm10) using STAR. Generate gene counts with featureCounts. Perform differential expression in R with DESeq2 (model: ~ behavior_group).
Protocol 2: snRNA-seq Following Opioid Self-Administration
Objective: To obtain cell-type-specific transcriptomic profiles from reward circuitry after drug-seeking behavior.
- Behavioral Procedure: Train rats to self-administer oxycodone (0.1 mg/kg/infusion) under an FR1 schedule in 2h daily sessions for 14 days. Include yoked saline controls.
- Nuclei Isolation: Perfuse animal with ice-cold PBS. Dissect medial prefrontal cortex. Dounce homogenize in nuclei isolation buffer (0.32M sucrose, 5mM CaCl₂, 3mM MgAc, 0.1mM EDTA, 10mM Tris-HCl, protease inhibitors). Filter through 40μm strainer. Layer over density gradient (e.g., iodixanol). Centrifuge at 10,000g for 20 min. Collect nuclei band.
- Single-Nuclei Library Prep: Use Chromium Controller (10x Genomics) and Chromium Next GEM Single Cell 3' Kit v3.1. Aim for 10,000 nuclei recovery. Follow manufacturer's protocol for GEM generation, cDNA amplification, and library construction.
- Sequencing & Analysis: Sequence to depth of 50,000 reads/nucleus. Process using Cell Ranger pipeline (count). Downstream analysis in Seurat: filter (genes>200, <2500; mt<5%), normalize, integrate samples, cluster, and annotate cell types. Find differentially expressed genes per cell type between groups.
Diagrams
Title: RNA-seq Workflow for Fear Conditioning Study
Title: Key Circuit & Molecular Pathways in Addiction
The Scientist's Toolkit
Table 3: Essential Research Reagents & Solutions
| Item | Function & Application | Example Product/Catalog |
|---|---|---|
| TRIzol Reagent | Monophasic solution of phenol and guanidine isothiocyanate for simultaneous dissociation of biological material and denaturation of proteins during RNA isolation. | Invitrogen TRIzol Reagent |
| RNase Inhibitor | Protects RNA samples from degradation by RNases during extraction and subsequent handling steps. | Murine RNase Inhibitor (M0314L) |
| Poly(A) mRNA Magnetic Beads | For selection of polyadenylated mRNA from total RNA prior to library construction, enriching for coding transcripts. | NEBNext Poly(A) mRNA Magnetic Isolation Module |
| Chromium Single Cell 3' GEM Kit | Enables droplet-based partitioning of single cells/nuclei, barcoding, and library preparation for single-cell/nuclei RNA-seq. | 10x Genomics, Chromium Next GEM Chip K |
| DNase I, RNase-free | Digests contaminating genomic DNA in RNA samples without degrading the RNA. | Qiagen RNase-Free DNase Set |
| High-Sensitivity DNA/RNA Analysis Kit | For precise assessment of RNA Integrity Number (RIN) or final library fragment size distribution using capillary electrophoresis. | Agilent Bioanalyzer 2100 kits |
| DESeq2 R Package | Statistical software for differential gene expression analysis of count-based RNA-seq data, using a negative binomial model. | Bioconductor package DESeq2 |
| STAR Aligner | Spliced Transcripts Alignment to a Reference, for fast and accurate alignment of RNA-seq reads to a genome. | Github: STAR |
The Experimental Pipeline: Best Practices for Sample to Sequence in Behavioral Studies
Within the framework of a doctoral thesis investigating behavioral adaptations in a rodent model of chronic social stress using RNA-sequencing (RNA-seq), robust pre-experimental planning is paramount. This protocol details the critical decisions surrounding statistical power, sample size determination, and ethical considerations that underpin rigorous, reproducible, and responsible neuroscience research with implications for psychiatric drug development.
Application Notes: Core Concepts
The Sample Size, Power, and Effect Size Triad
Power analysis is used to determine an appropriate sample size before an experiment begins. It balances four interrelated parameters:
- Power (1 - β): The probability of correctly rejecting a false null hypothesis (typically set at 0.8 or 80%).
- Significance Level (α): The probability of a Type I error (false positive), typically set at 0.05.
- Effect Size: The magnitude of the biological difference or relationship you expect to detect (e.g., Cohen's d for group comparisons). This is the most critical and often most challenging parameter to estimate.
- Sample Size (n): The number of biological replicates per group.
For an RNA-seq experiment in behavioral neuroscience, biological replicates refer to individual animals, not technical replicates of library preparations. The primary analysis driving sample size is typically the differential gene expression (DGE) analysis between experimental groups (e.g., Stressed vs. Control).
Ethical Considerations in Behavioral Neuroscience
Ethical rigor extends beyond animal welfare protocols. It encompasses the "3Rs" (Replacement, Reduction, Refinement) and directly links to experimental design:
- Reduction is achieved by using the minimum number of animals required to obtain statistically valid results, which is precisely determined by a properly conducted power analysis.
- Refinement involves modifying procedures to minimize pain and distress, which can itself alter gene expression profiles, thus becoming a key experimental variable.
- Scientific integrity and data sharing are ethical imperatives to avoid unnecessary duplication of experiments.
Protocols
Protocol: Performing anA PrioriPower Analysis for RNA-seq Behavioral Studies
Objective: To calculate the required number of biological replicates (animals per group) for a two-group RNA-seq experiment (e.g., Control vs. Chronic Social Defeat Stress).
Materials & Software:
- R statistical environment (v4.3.0 or later)
- R package:
pwr(for basic calculations),ssizeRNAorPROPER(for RNA-seq specific simulations)
Methodology:
- Define Key Parameters:
- Set Power (1-β) = 0.80.
- Set Significance Level (α) = 0.05. For RNA-seq with multiple testing correction (e.g., FDR < 0.05), the adjusted threshold can be used in simulation-based packages.
- Choose/Estimate Effect Size (Cohen's d): Review prior literature on similar behavioral paradigms and gene expression studies (microarray, qPCR, earlier RNA-seq). For novel studies, a moderate effect size (d = 0.8) is a conservative starting point. Pilot data is the gold standard for estimation.
- Estimate Dispersion: RNA-seq count data is over-dispersed. Use dispersion estimates from public datasets in the same tissue (e.g., from GEO) or pilot data.
Calculation Using Simulation (
ssizeRNApackage):Incorporate Behavioral Variance: The required n must satisfy the needs of both the primary behavioral endpoint (e.g., social interaction ratio) and the subsequent RNA-seq. Conduct a power analysis for the key behavioral metric first, as it often requires a larger n than molecular assays. The final sample size is the maximum n derived from both analyses.
Protocol: Ethical Framework and Experimental Design Integration
Objective: To formally integrate ethical review and the 3Rs into the experimental design document.
Methodology:
- Justification of Animal Model: In the thesis proposal and animal protocol, justify the species and model (e.g., C57BL/6J mouse, chronic social defeat stress) for its validity in modeling aspects of human depression/anxiety.
- Sample Size Justification: Present the power analysis (from Protocol 3.1) as the formal Reduction justification. State: "A sample size of n = 8 per group was determined via power analysis (α=0.05, power=0.8, effect size d=0.8) to minimize animal use while ensuring scientific rigor."
- Refinement Documentation: Detail all refinements:
- Use of non-invasive behavioral tracking (EthoVision, DeepLabCut).
- Defined humane endpoints (e.g., maximum weight loss percentage).
- Anaesthesia and analgesia protocols for any surgical procedures.
- Environmental enrichment strategies.
- Data Management Plan: Commit to publicly archiving raw RNA-seq data (FASTQ files) and processed counts in repositories like GEO or ArrayExpress upon thesis completion or publication, fulfilling an ethical obligation to maximize knowledge gain from the study.
Data Presentation
Table 1: Sample Size Requirements for Different Effect Sizes in a Two-Group RNA-seq Experiment Parameters: Power=0.80, FDR-adjusted α=0.05, Mean Count=1000, Dispersion=0.5, 20,000 genes, 10% DE genes.
| Expected Fold Change | Cohen's d (Approx.) | Required Sample Size per Group |
|---|---|---|
| 1.5 | 0.58 | 18 |
| 2.0 | 1.00 | 8 |
| 3.0 | 1.70 | 5 |
Table 2: Essential Research Reagent Solutions for Rodent RNA-seq Behavioral Studies
| Reagent / Material | Function in Experimental Workflow |
|---|---|
| TRIzol Reagent | Simultaneous lysis of tissue and stabilization/purification of RNA, DNA, and protein from brain regions (e.g., prefrontal cortex, hippocampus). |
| DNase I (RNase-free) | Removal of genomic DNA contamination from RNA preparations prior to library construction. |
| RNase Inhibitors | Protection of RNA integrity during cDNA synthesis and library preparation steps. |
| rRNA Depletion Kit (e.g., Ribo-Zero) | Removal of abundant ribosomal RNA (rRNA) to enrich for mRNA and non-coding RNA, essential for brain transcriptomics. |
| UltraPure BSA (50 mg/mL) | Used as a carrier to stabilize dilute RNA samples and improve library preparation efficiency from low-yield samples. |
| Dual-indexed UMI Adapter Kits | For unique molecular identifiers (UMIs) to mitigate PCR duplication bias and improve quantification accuracy in single-cell or low-input RNA-seq. |
| Behavioral Scoring Software (e.g., DeepLabCut, EthoVision) | For automated, unbiased quantification of animal behavior (social interaction, locomotion) to generate precise phenotypic data correlated with omics. |
Mandatory Visualizations
Diagram 1: Pre-experimental design decision workflow.
Diagram 2: The statistical power relationship quadrilateral.
In behavioral neuroscience research utilizing RNA-seq, the timing of tissue harvesting relative to the behavioral intervention is a critical determinant of the molecular snapshot obtained. This protocol details the experimental design considerations and methodologies for acute versus chronic intervention studies, emphasizing the temporal dynamics of transcriptional responses. Proper temporal design is essential for accurate biological interpretation within drug development and mechanistic studies.
Table 1: Comparison of Acute vs. Chronic Intervention Design
| Design Aspect | Acute Intervention | Chronic Intervention |
|---|---|---|
| Typical Duration | Single exposure or short-term (minutes to 24-48 hours) | Repeated exposure over days to weeks |
| Primary Molecular Insight | Immediate early response, stress pathways, rapid signaling | Neuroadaptation, structural plasticity, long-term regulation |
| Key Pathways Affected | IEGs (c-Fos, Arc), neurotransmitter signaling, acute stress (CREB, p38 MAPK) | Synaptic remodeling, neurotrophic signaling (BDNF), epigenetic modifiers |
| Harvest Timepoint Criticality | Extremely high (minute-scale resolution may be needed) | High (time-of-day and intervention interval effects) |
| Common Confounding Factor | Acute handling stress, circadian rhythm | Body weight changes, general health status, habituation |
Table 2: Example Temporal RNA-Seq Findings from Behavioral Studies
| Behavioral Paradigm | Intervention Type | Key Harvest Timepoints | Representative Transcriptomic Changes |
|---|---|---|---|
| Forced Swim Test (Stress) | Acute | 30 min, 60 min, 120 min post-test | Peak IEG expression at 30 min; inflammatory genes upregulated by 120 min. |
| Chronic Social Defeat Stress | Chronic | 24 hrs after last defeat, 10-day post-defeat (resilience) | Persistent inflammatory signatures; differential synaptic gene expression in resilient vs susceptible. |
| Morris Water Maze (Learning) | Acute/Chronic | 1 hr post-training (memory consolidation), after multi-day training | Immediate early genes and synaptic plasticity genes upregulated post-acute training; growth factor signaling altered after chronic training. |
| Chronic Drug Administration (e.g., Antidepressant) | Chronic | 2 weeks, 4 weeks of treatment, 1 week post-withdrawal | Slow upregulation of neurogenesis and trophic support genes; withdrawal reveals rebound synaptic changes. |
Detailed Experimental Protocols
Protocol 1: Tissue Harvesting for Acute Behavioral Intervention RNA-seq
Objective: To capture the immediate transcriptional response to a single behavioral event. Materials: See "The Scientist's Toolkit" below. Procedure:
- Synchronization: Acclimate animals to the facility and handling for a minimum of 7 days. Control for circadian effects by performing all behavior and harvesting within a consistent 3-4 hour window (e.g., mid-morning).
- Behavioral Intervention: Execute the acute paradigm (e.g., a single fear conditioning session, a 6-minute forced swim test).
- Timed Harvest: Based on pilot data (e.g., from IEG protein studies), euthanize subjects at predetermined timepoints (e.g., 0 min control, 30 min, 60 min, 120 min) post-intervention. The "0 min" group should experience equivalent handling but not the key stimulus.
- Rapid Dissection: Euthanize by rapid decapitation or focused microwave irradiation (for phosphoprotein preservation). Dissect the brain region of interest (e.g., prefrontal cortex, hippocampus) within 2 minutes on a cold plate.
- Stabilization: Immediately place tissue in ≥10 volumes of RNAlater or flash-freeze in liquid nitrogen. Store at -80°C.
- RNA Isolation: Use a column-based kit with on-column DNase treatment. Assess integrity with Bioanalyzer (RIN > 8.0 required).
Protocol 2: Tissue Harvesting for Chronic Behavioral Intervention RNA-seq
Objective: To capture steady-state transcriptional adaptations following prolonged behavioral manipulation. Materials: See "The Scientist's Toolkit" below. Procedure:
- Chronic Protocol: Administer the intervention (e.g., chronic unpredictable stress, 4-week voluntary wheel running, 21-day drug treatment) according to the established schedule.
- Habituation & Controls: Include a handled control group that experiences the same daily disturbances (e.g., injections, handling) without the active intervention.
- Harvest Timing: To isolate the effects of chronic adaptation from the acute effects of the last intervention, schedule harvesting at a standard time after the last session (e.g., 24 hours later). For circadian studies, maintain strict timing.
- Health Monitoring: Record weekly body weight and general health. These are critical covariates for downstream analysis.
- Harvest & Dissection: Euthanize as in Protocol 1. Dissect multiple regions of interest if applicable. Freeze tissues individually.
- Batch Processing: Process all RNA samples from a single experimental cohort (including all intervention groups and timepoints) in a single batch to minimize technical variance.
Protocol 3: Integrated Temporal Design for RNA-seq Analysis
Objective: To dissect both acute and chronic responses within a single study.
- Cohort Design: Include groups: Naive Control, Acute Intervention (harvested at multiple early timepoints), Chronic Intervention (harvested 24h post-last session), and a Chronic+Acute group (harvested shortly after the final session of a chronic regimen).
- Library Preparation: Use a stranded, poly-A selection mRNA-seq protocol. Aim for a minimum of 30 million paired-end reads per sample.
- Bioinformatic Analysis: Employ a time-series analysis framework (e.g., DESeq2 with likelihood ratio test for time course, or maSigPro). Cluster genes into temporal expression patterns. Perform pathway enrichment analysis on each temporal cluster.
Visualizations
Diagram 1: Experimental workflow for acute vs chronic design.
Diagram 2: Signaling pathways in acute vs chronic interventions.
The Scientist's Toolkit: Key Research Reagent Solutions
Table 3: Essential Materials for Tissue Harvesting in Behavioral RNA-seq
| Item | Function & Importance |
|---|---|
| RNAlater Stabilization Solution | Preserves RNA integrity immediately upon tissue dissection, crucial for preventing rapid transcript degradation post-harvest. |
| TRIzol or QIAzol Lysis Reagent | Effective for simultaneous disruption, homogenization, and initial phase separation of RNA, DNA, and protein from complex tissues. |
| RNeasy Mini Kit (with DNase I) | Column-based purification for high-quality, DNA-free total RNA; essential for sensitive downstream RNA-seq applications. |
| Agilent Bioanalyzer RNA Nano Kit | Provides precise assessment of RNA Integrity Number (RIN); critical QC step; RIN >8.0 is typically required for library prep. |
| Stranded mRNA-seq Library Prep Kit (e.g., Illumina TruSeq) | Selective for polyadenylated RNA, preserves strand information, reduces ribosomal RNA contamination. |
| Focused Microwave Irradiator | Allows fixation of labile molecular states (e.g., phosphorylated proteins) in seconds, useful for combined omics studies. |
| Cryostat | For precise dissection of fresh-frozen brain regions (e.g., subnuclei of hippocampus) prior to RNA extraction. |
| Home Cage Monitoring System | Enables longitudinal assessment of activity, circadian patterns, and behavior without human interference—a key covariate. |
Within the framework of a thesis on RNA-seq experimental design for behavioral studies, sample integrity is paramount. Behavioral phenotypes result from complex gene expression dynamics in specific neural circuits and peripheral systems. Consequently, rigorous protocols for procuring high-quality RNA from discrete brain regions and peripheral tissues are foundational. This document provides detailed application notes and protocols for microdissection, peripheral tissue collection, and rapid stabilization to ensure data reliability in downstream transcriptomic analyses.
Brain Region Microdissection
Key Considerations
Rapid tissue fixation or stabilization post-mortem is critical to minimize RNA degradation and stress-induced gene expression artifacts, which are particularly relevant in behavioral research where experimental manipulation (e.g., stress, learning) directly impacts transcriptional state.
Detailed Protocol: Cryostat-Based Microdissection of Mouse Brain Regions (e.g., Prefrontal Cortex, Hippocampus)
Materials & Reagents:
- Isoflurane or approved euthanasia agent.
- Dry ice or liquid nitrogen.
- PBS (RNase-free, ice-cold).
- Optimal Cutting Temperature (O.C.T.) compound or Tissue-Tek.
- Cryostat (pre-cooled to -20°C).
- Sterile, RNase-free surgical tools (forceps, fine scissors, micro-scalpels).
- Brain matrix (optional, for consistent coronal sections).
- RNAlater or RNase-inactivating solution.
- RNase-free tubes (1.5-2 mL).
Procedure:
- Perfusion & Extraction: Following behavioral testing and approved euthanasia, perform transcardial perfusion with ice-cold RNase-free PBS to remove blood, a major source of RNases and confounding RNA. Decapitate and carefully remove the whole brain.
- Rapid Freezing: Immediately submerge the brain in isopentane cooled by dry ice for 30-60 seconds. Do not immerse directly in liquid nitrogen. Place on dry ice.
- Embedding: Mount the frozen brain on a cryostat chuck using a minimal amount of O.C.T. compound. Allow to equilibrate in the cryostat (-18°C to -20°C) for 20 minutes.
- Sectioning: Cut serial coronal sections (50-400 µm thickness based on target region). Use a fresh, RNase-free blade for each brain.
- Microdissection: Under a stereomicroscope in the cryostat, use fine tools to punch or cut out regions of interest (e.g., dorsal vs. ventral hippocampus, amygdala nuclei) based on a neuroanatomical atlas. Keep sections frozen during the process.
- Stabilization: Immediately transfer tissue punches to tubes containing an appropriate volume of RNAlater (≥10:1 volume-to-tissue ratio) or place directly into lysis buffer for RNA extraction. Store at -80°C.
Peripheral Tissue Collection: Blood
Key Considerations
Blood presents unique challenges: high RNase activity, multiple cell types, and rapid transcriptional responses to handling stress. The choice of collection and stabilization method dictates the RNA profile (e.g., whole blood vs. PBMCs).
Detailed Protocol: PAXgene Blood RNA System for Whole Blood Stabilization
Materials & Reagents:
- PAXgene Blood RNA Tubes (pre-filled with proprietary stabilizing reagent).
- Venipuncture equipment.
- Timer.
- -20°C and -80°C freezers.
Procedure:
- Collection: Draw blood directly into a PAXgene Blood RNA Tube according to clinical venipuncture procedures. Invert the tube 8-10 times immediately to mix blood with the stabilizing reagent.
- Incubation: Store the tube upright at room temperature (18-25°C) for a minimum of 2 hours and a maximum of 72 hours. This allows for complete lysis of blood cells and RNA stabilization.
- Long-term Storage: After the incubation period, store tubes at -20°C or -80°C for long-term preservation (up to 5 years at -20°C, longer at -80°C).
- RNA Extraction: Use the corresponding PAXgene Blood RNA Kit, which includes protocols for processing the stabilized sample, including optional genomic DNA digestion.
Rapid Stabilization Methods Comparison
Table 1: Comparison of Rapid RNA Stabilization Methods
| Method | Mechanism | Suitability | Time to Stabilization | Pros | Cons |
|---|---|---|---|---|---|
| Flash Freezing | Instant halting of enzymatic activity via ultra-low temperature. | Most tissues (brain, liver, tumor). | Immediate upon submersion. | Simple, inexpensive, preserves other analytes (proteins). | Does not inactivate RNases; RNA degrades upon thawing. |
| RNAlater | Aqueous solution that permeates tissue to inactivate RNases. | Small tissues (<0.5 cm thickness), biopsies, microdissected samples. | 24-48 hrs at 4°C for full penetration. | Stabilizes RNA at 4°C, 25°C for short periods; easy for multiple samples. | Can be difficult for RNA extraction from fibrous tissues; may dilute samples. |
| PAXgene | Proprietary solution lyses cells and stabilizes RNA. | Whole blood. | ~2 hours at room temp. | Standardized for blood, stabilizes gene expression profile at draw. | Requires specialized tubes; additional processing cost. |
| TRIzol/Lysis Buffer | Chaotropic salts and phenol immediately denature proteins/RNases. | Any tissue, cell culture. | Immediate upon homogenization. | One-step homogenization and lysis; high RNA yield. | Hazardous organic chemicals; requires immediate processing to phase separation. |
The Scientist's Toolkit
Table 2: Essential Research Reagent Solutions for RNA-preserving Sample Collection
| Item | Function | Key Consideration for Behavioral RNA-seq |
|---|---|---|
| RNase Inhibitors | Enzymes that bind and inhibit RNase activity. | Critical for homogenization steps post-stabilization. Use broad-spectrum inhibitors. |
| RNAlater Stabilization Reagent | Inactivates RNases post-collection without freezing. | Ideal for field or behavioral lab where immediate freezing is logistically difficult. |
| PAXgene Blood RNA Tubes | Integrated blood collection and RNA stabilization system. | Essential for longitudinal studies where blood is drawn at multiple behavioral time points. |
| O.C.T. Compound | Water-soluble embedding medium for cryosectioning. | Ensure RNase-free formulation. Minimize use to avoid interference with RNA extraction. |
| Liquid Nitrogen/Dry Ice | Cryogenic agents for snap-freezing. | Plan logistics for rapid transfer from behavioral arena to freezer (<5 minutes ideal). |
| RNase-free Plasticware & Tools | Tips, tubes, blades, forceps treated to remove RNases. | Dedicate a set of tools per animal/region to prevent cross-contamination of RNA. |
Experimental Workflows & Pathways
Title: Sample Collection to RNA-seq Workflow
Title: Behavioral Stimulus to RNA Degradation Pathway
Introduction Within a thesis on RNA-seq experimental design for behavioral studies research, RNA isolation from neural tissue presents unique and formidable challenges. The cellular complexity, high lipid content, and regional heterogeneity of the brain, coupled with rapid post-mortem RNA degradation, directly impact RNA quality (RIN), quantity, and integrity. These parameters are critical for downstream transcriptional analyses like RNA-seq, where poor input compromises data reproducibility and biological interpretation of mechanisms underlying behavior. This document outlines key challenges, quality control metrics, and optimized protocols for neuroscientific RNA extraction.
Challenges and Quality Control Data The following table summarizes primary challenges and quantitative benchmarks for acceptable RNA from neural tissue.
Table 1: Key Challenges and QC Benchmarks for Neural RNA Isolation
| Parameter | Typical Challenge in Neural Tissue | Acceptable QC Benchmark (for RNA-seq) |
|---|---|---|
| RNA Integrity (RIN) | Rapid degradation due to high RNase activity and post-mortem delay. Gradient of integrity across brain regions. | RIN ≥ 7.0 (optimal ≥ 8.0). For single-nucleus RNA-seq, DV200 > 30%. |
| Total RNA Yield | Varies greatly by region (e.g., cortex vs. hippocampus). Compromised by inefficient homogenization. | Cortex: 1-5 µg/mg tissue. Microdissected nuclei (e.g., LC): 50-200 ng per region. |
| Purity (A260/A280) | Contamination by phenol, glycogen, or lipids from myelin. | 1.8 - 2.1. |
| Purity (A260/A230) | Contamination by guanidine salts, carbohydrates, or lipids. | ≥ 2.0. |
| Major RNA Species | High prevalence of non-coding RNAs (e.g., miRNAs, lncRNAs) requiring specific capture. | 28S:18S rRNA ratio ~1.8-2.0 (mammalian). |
Table 2: Impact of Post-Mortem Interval (PMI) on RNA Integrity
| Brain Region | PMI < 2 hrs (Mean RIN) | PMI 6-12 hrs (Mean RIN) | Key Factor |
|---|---|---|---|
| Prefrontal Cortex | 8.5 ± 0.3 | 7.1 ± 0.6 | Surface exposure, RNase levels. |
| Hippocampus | 8.2 ± 0.4 | 6.8 ± 0.7 | Metabolic activity, cell density. |
| Cerebellum | 8.7 ± 0.3 | 7.8 ± 0.5 | Lower baseline degradation rate. |
Protocol 1: Rapid Dissection and Homogenization for Bulk RNA Objective: To preserve RNA integrity during collection and initial processing of specific brain regions (e.g., prefrontal cortex, striatum) for bulk RNA-seq. Materials: RNaseZap-treated tools, liquid nitrogen, TRIzol or QIAzol, homogenizer (e.g., rotor-stator), RNAase-free tubes.
- Sacrifice & Dissection: Rapidly decapitate animal (e.g., mouse) following approved protocol. Remove brain within 60 seconds.
- Region Microdissection: Place brain on chilled RNase-free surface. Rapidly dissect region of interest using sterile blades. Immediately snap-freeze tissue in liquid nitrogen. Store at -80°C.
- Homogenization: Add frozen tissue (<30 mg) to 1 ml of TRIzol in a pre-chilled tube. Homogenize using a rotor-stator homogenizer at full speed for 15-30 seconds on ice.
- Phase Separation: Proceed to Protocol 2, Step 2, or follow silica-membrane column purification.
Protocol 2: Acid Guanidinium-Phenol-Chloroform (AGPC) Extraction with Phase Lock Objective: High-yield, high-purity total RNA isolation, effective for lipid-rich tissue. Materials: TRIzol, Phase Lock Gel Heavy tubes, chloroform, isopropanol, 75% ethanol (in DEPC-H₂O), RNase-free water.
- Lysate Preparation: Use homogenate from Protocol 1, Step 3. Incubate 5 min at RT for complete dissociation.
- Phase Separation: Add 0.2 ml chloroform per 1 ml TRIzol. Shake vigorously for 15 sec. Incubate 2-3 min at RT. Centrifuge at 12,000 × g for 15 min at 4°C. The mixture separates into three phases.
- RNA Precipitation: Transfer the upper aqueous phase to a new tube. Add 0.5 ml isopropanol. Mix. Incubate 10 min at RT. Centrifuge at 12,000 × g for 10 min at 4°C. The RNA pellet forms.
- Wash: Remove supernatant. Wash pellet with 1 ml 75% ethanol. Vortex briefly. Centrifuge at 7,500 × g for 5 min at 4°C.
- Redissolution: Air-dry pellet for 5-10 min. Do not over-dry. Dissolve in 30-50 µl RNase-free water. Heat at 55°C for 10 min to aid dissolution. Assess quality.
Protocol 3: Total RNA Extraction using Silica-Membrane Columns Objective: Rapid, reliable isolation of DNA-free total RNA, suitable for high-throughput processing. Materials: RNeasy Lipid Tissue Mini Kit (Qiagen) or equivalent, β-mercaptoethanol (β-ME), absolute ethanol.
- Lysate Preparation: Homogenize tissue in QIAzol or similar lysis reagent. Add β-ME to the lysate as directed.
- Ethanol Adjustment: Add chloroform, shake, centrifuge as in Protocol 2. Transfer aqueous phase to a new tube. Add 1.5 volumes of 70% ethanol. Mix thoroughly by pipetting.
- Column Binding: Apply the mixture to an RNeasy Mini column. Centrifuge at ≥ 8,000 × g for 15 sec. Discard flow-through.
- Washes: Perform RW1 and RPE buffer washes as per kit instructions, with appropriate centrifugations.
- Elution: Elute RNA in 30-50 µl RNase-free water by centrifugation.
Visualizations
Title: Neural Tissue RNA Isolation Core Workflow
Title: Key Factors Affecting Neural RNA Quality
The Scientist's Toolkit: Essential Research Reagents & Materials
Table 3: Key Reagent Solutions for Neural RNA Isolation
| Item | Function/Benefit | Example Product/Component |
|---|---|---|
| RNase Decontaminant | Eliminates RNases from surfaces and tools prior to dissection. | RNaseZap or similar. |
| TRIzol/QIAzol | Monophasic lysis reagent containing phenol/guanidine, denatures RNases instantly upon homogenization. | Invitrogen TRIzol, Qiagen QIAzol. |
| β-Mercaptoethanol (β-ME) | Strong reducing agent added to lysis buffers; denatures RNases by breaking disulfide bonds. | Included in RNeasy kits. |
| Phase Lock Gel Tubes | Hydrophobic barrier simplifies phase separation, increases aqueous phase recovery, prevents carry-over. | 5 PRIME Phase Lock Gel Heavy. |
| RNase-Free DNase I | On-column or in-solution digestion of genomic DNA contamination critical for RNA-seq. | Qiagen RNase-Free DNase. |
| RNasin/Protector RNase Inhibitor | Added during elution or post-isolation to protect RNA from degradation during storage. | Promega RNasin. |
| RNA Storage Buffer | Stabilizes RNA at -80°C or -20°C, preventing degradation by divalent cation-mediated hydrolysis. | Invitrogen RNAstable or Ambion Storage Buffer. |
| RNeasy Lipid Tissue Mini Kit | Optimized silica-membrane columns for lipid-rich tissues; includes specific buffers for lipid removal. | Qiagen 74804. |
| Bioanalyzer RNA Nano/Pico Chips | Microfluidics-based analysis of RNA integrity (RIN) and quantification. | Agilent 2100 Bioanalyzer System. |
In behavioral neuroscience, transcriptomic analysis is crucial for linking molecular events to complex phenotypes like learning, memory, and emotional responses. The choice of RNA-seq modality—bulk, single-cell, or spatial—determines the resolution and biological insight achievable. This Application Note, framed within a thesis on RNA-seq experimental design for behavioral studies, provides a comparative analysis and detailed protocols to guide researchers and drug development professionals in selecting the appropriate approach for their specific behavioral context questions.
Comparative Analysis of RNA-seq Modalities
The following table summarizes the core characteristics, applications, and quantitative considerations for each method in behavioral research.
Table 1: Comparison of RNA-seq Modalities for Behavioral Studies
| Feature | Bulk RNA-seq | Single-Cell RNA-seq (scRNA-seq) | Spatial Transcriptomics |
|---|---|---|---|
| Resolution | Tissue-level average (millions of cells) | Individual cell level | Tissue location with single-cell to multi-cell resolution |
| Key Behavioral Application | Identifying global transcriptomic shifts in brain regions (e.g., prefrontal cortex after stress). | Deconvoluting cellular heterogeneity in complex tissues (e.g., neuronal subtypes in hippocampus linked to memory). | Mapping gene expression to neuroanatomical structures (e.g., gene gradients in hypothalamic nuclei regulating aggression). |
| Required Input | High-quality total RNA (100 ng – 1 µg). | Suspension of live, single cells (500–10,000 cells/sample). | Fresh-frozen or FFPE tissue sections on specialized slides. |
| Typical Cost per Sample (USD) | $500 – $2,000 | $2,000 – $10,000+ | $3,000 – $12,000+ |
| Throughput | High; many samples per run. | Medium; typically 1-8 samples/lane (10x Genomics). | Low to medium; 1-4 slides/run (Visium). |
| Primary Data Output | Aggregate gene expression matrix. | Gene-cell count matrix with cell metadata. | Gene-spot count matrix with spatial coordinates. |
| Key Advantage | Cost-effective for group comparisons; robust differential expression. | Reveals novel cell states and trajectories; cell-type specific responses. | Preserves spatial context; links molecular data to histopathology. |
| Key Limitation | Masks cellular heterogeneity and spatial information. | Loses native tissue architecture; complex data analysis. | Lower resolution than scRNA-seq; higher cost. |
| Ideal Behavioral Question | "Does chronic social defeat stress alter the overall transcriptome of the ventral tegmental area?" | "Which specific neuronal and glial populations in the amygdala are transcriptionally primed after fear conditioning?" | "How are neuropeptide expression patterns organized within the paraventricular nucleus during maternal behavior?" |
Detailed Experimental Protocols
Protocol 1: Bulk RNA-seq from Rodent Brain Microdissections
Application: Profiling transcriptomic changes in a specific brain nucleus following a behavioral paradigm (e.g., sucrose preference test in anhedonia model).
Materials:
- Dissected brain region tissue (e.g., nucleus accumbens).
- TRIzol Reagent or equivalent.
- RNase-free consumables.
- Poly(A) selection or rRNA depletion kit (e.g., NEBNext Poly(A) mRNA Magnetic Isolation Module, Ribo-Zero Gold).
- Stranded cDNA library prep kit (e.g., NEBNext Ultra II Directional RNA Library Prep).
Procedure:
- Tissue Homogenization: Homogenize 15-30 mg of flash-frozen tissue in 1 mL TRIzol using a mechanical homogenizer. Incubate 5 min at RT.
- RNA Extraction: Add 0.2 mL chloroform, shake vigorously, and centrifuge at 12,000 x g for 15 min at 4°C. Transfer aqueous phase to a new tube.
- RNA Precipitation: Precipitate RNA with 0.5 mL isopropanol. Wash pellet with 75% ethanol.
- RNA QC: Resuspend in nuclease-free water. Assess concentration (Qubit RNA HS Assay) and integrity (RIN > 8.0 on Agilent Bioanalyzer).
- Library Preparation: Follow kit protocol. Typically involves: a. mRNA Enrichment: Use poly(A) bead selection or ribosomal RNA depletion. b. Fragmentation: Fragment RNA to ~200-300 nt. c. cDNA Synthesis: Synthesize first and second-strand cDNA. d. Adapter Ligation: Ligate indexed sequencing adapters. e. Library Amplification: Perform 10-15 cycles of PCR.
- Library QC & Sequencing: Validate library size distribution (Bioanalyzer) and quantify (qPCR). Pool libraries and sequence on an Illumina platform (e.g., NovaSeq), targeting 20-40 million paired-end 150 bp reads per sample.
Protocol 2: Single-Cell RNA-seq (10x Genomics) from Dissociated Brain Tissue
Application: Creating a cell atlas of a developing or behaviorally-relevant brain region.
Materials:
- Freshly dissected brain tissue.
- Adult Brain Dissociation Kit (Miltenyi Biotec) or Papain-based dissociation system.
- Dead Cell Removal Kit.
- Chromium Controller & Chip G (10x Genomics).
- Chromium Next GEM Single Cell 3' Reagent Kits v3.1.
- Cell Ranger analysis suite.
Procedure:
- Single-Cell Suspension Preparation: a. Mechanically and enzymatically dissociate tissue according to kit protocol. b. Filter cell suspension through a 40 µm Flowmi cell strainer. c. Perform dead cell removal if viability is <80%. d. Resuspend in PBS + 0.04% BSA. Count with trypan blue and adjust concentration to 700-1200 cells/µL.
- Gel Bead-in-Emulsion (GEM) Generation & Barcoding: Use the Chromium Controller to partition single cells, beads, and reagents into oil droplets. Within each GEM, reverse transcription occurs, adding a cell-specific barcode and unique molecular identifier (UMI) to each cDNA molecule.
- Post GEM-RT Cleanup & cDNA Amplification: Break droplets, purify cDNA with DynaBeads, and amplify by PCR.
- Library Construction: Fragment the amplified cDNA, add adapters via end-repair, A-tailing, and ligation. Include sample index PCR.
- Sequencing: QC libraries (Bioanalyzer, qPCR). Sequence on an Illumina NovaSeq (recommended read length: 28 bp Read1, 91 bp Read2, 8 bp I7 index), aiming for 20,000-50,000 reads per cell.
- Primary Data Analysis: Use
cellranger countto align reads, generate feature-barcode matrices, and perform initial clustering.
Protocol 3: Visium Spatial Gene Expression for Brain Tissue Sections
Application: Mapping gene expression domains within a layered or nucleus-dense brain region (e.g., hippocampus or cerebellum).
Materials:
- Fresh-frozen brain tissue block.
- Visium Spatial Tissue Optimization Slide & Reagent Kit.
- Visium Spatial Gene Expression Slide & Reagent Kit (10x Genomics).
- Cryostat.
- Fluorescent imaging system compatible with slides.
Procedure:
- Tissue Optimization (Optional but Recommended): a. Generate 10 µm sections and mount on Optimization Slide. b. Perform fluorescent staining, imaging, and permeabilization with different enzyme conditions (4, 6, 8, 10 minutes). c. Analyze cDNA yield to determine optimal permeabilization time for your tissue.
- Spatial Gene Expression Library Preparation: a. Mount a 10 µm fresh-frozen section onto the Visium Gene Expression Slide (containing ~5000 barcoded spots). b. Fix tissue with methanol and stain with H&E. Image the slide at high resolution. c. Permeabilize tissue for optimal time (from step 1) to release RNA. d. Perform on-slide reverse transcription. The released RNA binds to spatially-barcoded oligonucleotides on the slide surface. e. Synthesize second strand, denature, and collect cDNA for off-slide library construction (similar to 10x scRNA-seq).
- Sequencing & Data Alignment: Sequence libraries (recommended: 25 bp Read1, 91 bp Read2, 8 bp I7 index). Use
spacerangerpipeline to align sequences, count UMIs, and align spatial barcodes to the tissue image.
Visualizations
Diagram Title: Decision Workflow for RNA-seq Modality in Behavioral Studies
Diagram Title: Core Workflow Comparison of Three RNA-seq Methods
The Scientist's Toolkit: Key Research Reagent Solutions
Table 2: Essential Materials for Behavioral Transcriptomics
| Item | Function in Behavioral RNA-seq | Example Product |
|---|---|---|
| RNase Inhibitors | Critical for preventing RNA degradation during lengthy brain dissections and homogenization. | Recombinant RNase Inhibitor (e.g., Takara) |
| Brain Dissociation Kit | Standardized enzymatic mix for generating viable single-cell suspensions from neural tissue. | Adult Brain Dissociation Kit (Miltenyi Biotec) |
| Dead Cell Removal Beads | Improves scRNA-seq data quality by removing apoptotic cells common in dissociated CNS tissue. | Dead Cell Removal Kit (Miltenyi Biotec) |
| Poly(A) Magnetic Beads | Isolates mRNA from total RNA for bulk and single-cell library prep by binding the poly-A tail. | NEBNext Poly(A) mRNA Magnetic Beads |
| Template Switching Oligo (TSO) | A key component in scRNA-seq kits (e.g., 10x) enabling full-length cDNA capture during RT. | Included in 10x Chromium kits |
| Spatial Barcoded Slide | Microarray slide printed with barcoded oligonucleotides for capturing RNA in situ. | 10x Genomics Visium Spatial Gene Expression Slide |
| Tissue Permeabilization Enzyme | Enzyme (e.g., protease) that digests tissue to release RNA for on-slide capture in spatial protocols. | Visium Spatial Tissue Optimization reagents |
| Dual Index Kit | Provides unique combinatorial indexes for multiplexing many samples in a single sequencing run. | IDT for Illumina - RNA UD Indexes |
| High-Sensitivity DNA Assay | Accurate quantification of final sequencing libraries for optimal pool balancing. | Agilent High Sensitivity DNA Kit (Bioanalyzer) |
Introduction Within a broader thesis on RNA-seq experimental design for behavioral studies, this protocol details the computational pipeline for extracting biologically meaningful insights from raw sequencing data. This workflow is critical for identifying transcriptomic alterations underlying behavioral traits (e.g., anxiety, aggression, or learned responses) in model organisms, thereby informing potential therapeutic targets for neuropsychiatric drug development.
Application Notes
1. Experimental Design & Data Acquisition Prior to analysis, robust experimental design is paramount. For behavioral studies, ensure stringent control of confounding variables (e.g., circadian rhythm, batch effects, litter effects). A minimum of n=6-8 biological replicates per condition (e.g., control vs. stress-exposed) is recommended for adequate statistical power. Samples are typically whole brain or specific brain region homogenates. Sequencing is performed to generate paired-end reads (e.g., 150bp) with a recommended depth of 30-50 million reads per sample.
2. Core Bioinformatics Workflow The standard pipeline progresses through quality control, alignment, quantification, and statistical analysis.
Table 1: Key Bioinformatics Tools & Their Functions
| Stage | Tool | Primary Function | Key Output |
|---|---|---|---|
| Quality Control | FastQC | Assesses raw read quality. | Quality scores, GC content, adapter contamination. |
| Trimming/Filtering | Trimmomatic, Cutadapt | Removes adapters and low-quality bases. | "Clean" read files. |
| Alignment | STAR, HISAT2 | Maps reads to a reference genome. | Sequence Alignment Map (SAM/BAM) files. |
| Quantification | featureCounts, HTSeq | Counts reads mapping to genomic features (genes). | Raw count matrix (genes x samples). |
| Differential Exp. | DESeq2, edgeR | Identifies statistically significant gene expression changes. | List of DEGs with p-values & fold-changes. |
| Functional Analysis | clusterProfiler, g:Profiler | Interprets DEGs via enrichment analysis (GO, KEGG). | Enriched pathways/biological processes. |
Protocols
Protocol 1: Raw Data Processing and Alignment
Materials:
- Raw FASTQ files.
- Reference genome (e.g., GRCm39 for mouse) and corresponding annotation file (GTF/GFF).
- High-performance computing (HPC) cluster or server with sufficient RAM (≥32GB recommended).
Method:
- Quality Check: Run FastQC on all raw FASTQ files. Summarize results using MultiQC.
- Trimming: Execute Trimmomatic in paired-end mode.
java -jar trimmomatic-0.39.jar PE -phred33 input_R1.fq.gz input_R2.fq.gz output_R1_paired.fq.gz output_R1_unpaired.fq.gz output_R2_paired.fq.gz output_R2_unpaired.fq.gz ILLUMINACLIP:TruSeq3-PE.fa:2:30:10 LEADING:3 TRAILING:3 SLIDINGWINDOW:4:15 MINLEN:36 - Genome Indexing (one-time): Generate a genome index for STAR using the reference FASTA and GTF files.
- Alignment: Map trimmed reads to the reference genome using STAR with parameters optimized for transcriptome discovery.
STAR --genomeDir /path/to/genomeIndex --readFilesIn output_R1_paired.fq.gz output_R2_paired.fq.gz --readFilesCommand gunzip -c --outSAMtype BAM SortedByCoordinate --quantMode GeneCounts - Generate Count Matrix: Compile read counts from all samples using the output from STAR's
--quantMode GeneCountsor by running featureCounts on the BAM files.
Protocol 2: Differential Expression Analysis with DESeq2
Materials:
- Raw count matrix.
- Sample metadata table (CSV) describing experimental conditions.
Method:
- Load Data: In R, create a DESeq2
DESeqDataSetobject from the count matrix and metadata.
- Pre-filtering: Remove genes with very low counts across all samples (
rowSums(counts(dds)) >= 10). - Normalization & Modeling: Perform differential expression analysis.
dds <- DESeq(dds) Extract Results: Retrieve the results table for the contrast of interest (e.g., stressed vs. control).
Filter & Annotate: Filter results based on an adjusted p-value (FDR) threshold (e.g., padj < 0.05) and absolute log2 fold change (e.g., > 0.5). Annotate genes with biomaRt.
Visualization: Workflow & Analysis Diagrams
The Scientist's Toolkit: Research Reagent Solutions
Table 2: Essential Materials for RNA-seq in Behavioral Studies
| Item | Function & Application |
|---|---|
| TRIzol Reagent | A monophasic solution of phenol and guanidine isothiocyanate for the effective lysis of brain tissue and simultaneous isolation of high-quality total RNA, preserving the transcriptome profile. |
| RNase-free DNase I | Digests genomic DNA contamination during RNA purification, crucial for accurate RNA-seq quantification. |
| Poly(A) Magnetic Beads | For mRNA enrichment during library preparation by selectively binding the poly-A tail of eukaryotic mRNAs. |
| Strand-specific Library Prep Kit | Enables determination of the originating strand of transcribed RNA, providing more accurate transcriptional landscape data. |
| RiboZero/RiboCop Kit | Depletes abundant ribosomal RNA (rRNA) from total RNA samples, dramatically increasing the sequencing depth of mRNA. |
| SPRIselect Beads | Size-selects cDNA fragments during library prep and cleans up enzymatic reactions, replacing traditional column-based methods. |
| Universal Human/Mouse Reference RNA | Used as an inter-laboratory standard and positive control to assess technical performance and batch effects across sequencing runs. |
| ERCC RNA Spike-In Mixes | Synthetic exogenous RNA controls added to samples to monitor technical variance, sensitivity, and dynamic range of the assay. |
Navigating Challenges: Solving Common Pitfalls in Behavioral Transcriptomics
Within RNA-seq experimental design for behavioral studies, high biological variability is a paramount challenge. Behavioral phenotypes are influenced by a complex interplay of genetics, environment, experience, and stochastic factors, leading to significant within-group variance that can obscure transcriptomic signals. Effective management of this variability is not merely a statistical exercise but a fundamental requirement for generating reproducible and biologically meaningful data. This application note details strategies for homogenizing experimental groups and optimizing sample size (N) to enhance the power and reliability of RNA-seq studies in behavioral neuroscience and psychopharmacology.
Quantitative Impact of Variability and Sample Size
The relationship between variability, effect size, and required sample size is formalized in power analysis. The table below summarizes key statistical parameters and their influence on experimental design.
Table 1: Power Analysis Parameters for RNA-seq in Behavioral Studies
| Parameter | Typical Range in Behavioral RNA-seq | Impact on Required N | Notes for Homogenization |
|---|---|---|---|
| Desired Power (1-β) | 80% - 90% | Higher power increases N. | Target 80% as standard. |
| Significance Threshold (α) | 0.01 - 0.05 | Stricter (lower) α increases N. | Use adjusted α for multiple testing (e.g., FDR < 0.05). |
| Effect Size (Fold Change) | 1.5 - 2.5x | Smaller detectable fold change drastically increases N. | Homogenization can improve the apparent effect size by reducing noise. |
| Biological CV (Coefficient of Variation) | 15% - 40% | The single biggest driver of N; higher CV exponentially increases N. | Strategies below target reducing biological CV. |
| Estimated N per Group | 6 - 12+ | For 80% power, 2-fold change, CV=20%, α=0.01: N ≈ 8-10. | Pilot data is critical for accurate estimation. |
Core Strategies for Homogenizing Experimental Groups
1. Rigorous Phenotypic Screening & Stratification:
- Protocol: Prior to experimental manipulation, subject animals (e.g., rodents) undergo standardized behavioral screening (e.g., open field test for baseline activity, elevated plus maze for anxiety-like behavior). Subjects are then ranked based on composite scores and systematically assigned to experimental groups (e.g., stratified randomization) to ensure equivalent baseline phenotypes across groups.
- Application: Essential for studies of stress, depression (e.g., chronic social defeat), or cognitive interventions where pre-existing trait differences confound outcomes.
2. Controlled Environmental & Husbandry Standardization:
- Protocol: Implement strict protocols for all non-experimental variables:
- Caging: House experimental cohorts in identical caging systems, maintaining consistent group sizes per cage.
- Circadian Rhythm: Perform all animal handling, behavioral testing, and tissue collection within a defined 2-3 hour window of the light/dark cycle.
- Acoustic & Olfactory Control: House animals in dedicated, low-traffic rooms; use negative pressure or filtered airflow; handle cages in a consistent order.
- Diet & Bedding: Use single, large batches of identical diet and autoclaved bedding for the entire study.
3. Genetic Background Homogenization:
- Protocol: Utilize isogenic strains (C57BL/6J) for discovery studies. For outbred stocks or transgenic lines, implement within-litter designs. For example, in a treatment vs. control study, split each litter between the two conditions, treating litter as a blocking factor in the statistical model.
- Application: Minimizes confounding genetic variation; the within-litter design is powerful for studies of early-life interventions.
4. Integrated Tissue Dissection & Quality Control:
- Protocol: Combine precise macro-dissection with rapid RNA stabilization.
- Perfuse animals transcardially with ice-cold RNase-free PBS if whole-organ analysis is not required.
- Rapidly extract the brain region of interest (e.g., prefrontal cortex, nucleus accumbens) using a validated brain matrix and consistent anatomical landmarks (bregma coordinates).
- Immediately place tissue in 10 volumes of RNAlater or flash-freeze in liquid nitrogen-cooled isopentane, then store at -80°C.
- Prior to RNA extraction, assess RNA Integrity Number (RIN) using a Bioanalyzer or TapeStation. Exclude samples with RIN < 8.0 for standard RNA-seq.
Protocol: Stratified Randomization for a Mouse Social Defeat Study
Objective: To assign mice to Control or Defeated groups with matched baseline anxiety levels. Materials: Inbred male C57BL/6J mice (postnatal day 56), Open Field (OF) arena, video tracking software. Procedure:
- Habituation: Handle all mice for 3 minutes/day for 5 consecutive days.
- Baseline Phenotyping: On Day 6, subject each mouse to a 10-minute OF test. Record total distance moved and time spent in center zone.
- Calculation of Composite Score: For each mouse, calculate a Z-score for each parameter relative to the cohort mean. Sum the Z-scores for a composite "anxiety-index" (lower score = more anxious).
- Stratification & Assignment: Rank mice from lowest to highest composite score. Take the top 4 mice (most anxious), randomly assign 2 to Control and 2 to Defeated group. Repeat for the next 4 mice, until all are assigned. This ensures mean and variance of baseline anxiety are equal across final groups.
The Scientist's Toolkit: Key Reagent Solutions
Table 2: Essential Research Reagents for Homogenized RNA-seq Workflows
| Item | Function & Rationale |
|---|---|
| RNAlater Stabilization Solution | Preserves RNA integrity in situ immediately upon dissection, preventing degradation-driven technical variation. |
| TRIzol Reagent / Qiazol | Effective for simultaneous lysis and stabilization of RNA (and other macromolecules) from heterogeneous tissues like brain. |
| DNase I (RNase-free) | Critical for removing genomic DNA contamination prior to RNA-seq library prep to avoid spurious reads. |
| RiboZero Gold / RNase H-based rRNA Depletion Kits | For total RNA-seq, provides superior and more consistent ribosomal RNA removal compared to poly-A selection, especially for degraded or non-cytoplasmic RNA. |
| Dual-Index UMI (Unique Molecular Identifier) Adapters | UMIs correct for PCR amplification bias and duplicate reads, improving accuracy of quantitative digital gene expression. |
| ERCC (External RNA Controls Consortium) Spike-in Mix | Add a known quantity of synthetic RNA controls to your lysate to normalize for technical variation in RNA extraction and library prep, and assess absolute sensitivity. |
Visualization of Strategies and Workflow
Title: Strategy Flow for Managing Biological Variability
Title: Stratified Randomization Workflow
Title: RNA-seq Preparation with Quality Control Gates
Application Notes
In behavioral neuroscience research utilizing RNA-seq, isolating molecular signatures specific to a behavioral phenotype or drug intervention is paramount. Non-experimental variables—stress from handling, circadian phase, and ambient noise—are potent modulators of gene expression and can confound results, leading to false positives or masked effects. Systematic control of these factors is not best practice; it is a prerequisite for meaningful data.
Table 1: Impact and Control of Key Confounders in Behavioral RNA-seq
| Confounder | Primary Impact on RNA-seq Data | Recommended Control Measures | Quantitative Benchmark for Success |
|---|---|---|---|
| Handling Stress | Acute upregulation of stress-responsive genes (e.g., Fos, Nr4a1, Per1), glucocorticoid signaling. | Habituation protocol (see Protocol 1). Single-experimenter handling. Home cage transfer methods. | Plasma corticosterone <25% increase from baseline 30 min post-handling. Minimal Fos expression in control brain regions (e.g., prefrontal cortex) vs. housed controls. |
| Circadian Rhythms | >10% of the transcriptome oscillates in rodent brains. Core clock genes (e.g., Per2, Bmal1) and downstream processes. | Strictly standardized Zeitgeber Time (ZT) for all procedures. 12:12 light-dark cycle. Acclimation >2 weeks. | Gene expression variance within treatment groups (e.g., saline controls) is minimized when sampled at consistent ZT (e.g., ZT4-6). |
| Environmental Noise | Activates stress and auditory pathways. Induces startle, alters sleep cycles, and increases glucocorticoids. | Sound-attenuated housing and procedure rooms. White noise masking during procedures. Vibration damping. | Ambient noise consistently <50 dB in housing rooms. No transient spikes >65 dB. |
Experimental Protocols
Protocol 1: Systematic Habituation for Minimizing Handling Stress Objective: To acclimate animals to all experimental procedures prior to the test day, minimizing acute stress-induced transcriptional noise.
- Days -14 to -7: Acclimation to housing room under standard 12:12 light-dark cycle.
- Days -6 to -3: Gentle Handling. Experimenter introduces hand into cage, allows animal to explore, and gently picks up and transfers to a clean cage for 1-2 minutes, twice daily at the future experimental ZT.
- Days -2 to -1: Mock Procedures. Simulate the full experimental workflow (e.g., injection with saline, placement in behavioral apparatus with motors off) at the exact ZT planned for the real experiment.
- Day 0 (Experiment): Execute the experimental intervention (e.g., drug administration, behavioral test) followed by tissue collection at the prescribed post-interval interval. All steps performed by the same handler.
Protocol 2: Circadian-Standardized Tissue Collection for RNA-seq Objective: To collect brain tissue at a consistent circadian phase across all experimental cohorts.
- Housing: Maintain animals under a 12:12 light-dark cycle for a minimum of 14 days prior to experiment. Document Zeitgeber Time (ZT), with ZT0 defined as lights-on.
- Scheduling: Schedule all experiments and sacrifice during a defined window (e.g., ZT4-6, during the active phase for nocturnal rodents).
- Sacrifice Procedure: In a procedure room adjacent to the housing room, sacrifice animals rapidly (e.g., focused microwave irradiation or decapitation) one at a time with minimal disturbance to others. The time from cage removal to tissue freezing should be <60 seconds.
- Documentation: Record exact ZT for each sample. For longitudinal studies, counterbalance treatment groups across days but within the same ZT window.
Protocol 3: Auditory and Vibration Control in Behavioral Suites Objective: To standardize and minimize uncontrolled auditory and vibratory stimuli.
- Room Preparation: Use sound-attenuating foam in procedure rooms. Install sealed doors and acoustic ceiling tiles. Place all equipment (e.g., servers, fans) on isolated circuits or in separate rooms.
- White Noise: Provide a consistent, low-level white noise background (45-50 dB) in all housing and testing rooms to mask irregular external sounds.
- Apparatus Maintenance: Place all behavioral equipment on vibration-damping platforms. Regularly maintain moving parts (e.g., ventilator fans, motors) to prevent squeaking.
- Monitoring: Use a digital sound level meter to log ambient and peak noise levels in rooms at different times of day to ensure consistency.
Visualizations
Title: Confounder Pathways to Gene Expression Noise
Title: Controlled Experimental Workflow
The Scientist's Toolkit: Essential Reagents & Materials
| Item | Function & Rationale |
|---|---|
| Decapicone Restraint Bags | Allows for swift, gentle transfer and restraint for decapitation, reducing pre-sacrifice struggle and stress. |
| Focused Microwave Irradiation System | Enables near-instantaneous fixation of brain tissue in vivo, preserving labile RNA states and rapid phosphorylation signals without stress-induced artifacts. |
| Portable Digital Sound Level Meter | For objective, routine monitoring of ambient and peak noise levels in animal housing and testing facilities to enforce acoustic standards. |
| White Noise Generator | Provides consistent auditory masking to buffer against irregular disruptive sounds, standardizing the auditory environment. |
| Zeitgeber Timer-Controlled Lighting | Programmable lights to ensure a perfectly consistent and automated 12:12 light-dark cycle, critical for circadian entrainment. |
| Vibration-Damping Platforms | Isolates sensitive behavioral equipment (e.g., operant chambers, mazes) from building vibrations, preventing unintended stimuli. |
| RNA Stabilization Reagent (e.g., RNAlater) | Quickly stabilizes and protects RNA integrity in collected tissue samples, especially critical for sub-regions dissected post-sacrifice. |
| Automated Liquid Handler | For consistent, high-throughput RNA library preparation, reducing technical batch effects that could compound biological confounds. |
Application Notes
In the context of a behavioral neuroscience thesis employing RNA-seq, technical artifacts (batch effects) from procedural timelines can confound the biological signal of interest. Two major, often confounded, batch sources are the day of behavioral testing and the batch of RNA extraction. This document outlines protocols for identifying, diagnosing, and correcting these effects to ensure downstream transcriptomic data reflects behavioral phenotypes, not technical variance.
1. Identification and Diagnostic Protocols
Protocol 1.1: Experimental Design for Batch Effect Detection Objective: To structure a behavioral RNA-seq study to explicitly expose batch effects. Methodology:
- Staggered Design: Do not process all animals from one behavioral cohort (e.g., "Control Day 1") in a single RNA extraction batch. Instead, split subjects from each behavioral testing day across at least two separate RNA extraction batches.
- Balanced Blocking: For a study with
nbehavioral testing days andmRNA extraction batches, aim for a balanced distribution where each batch contains samples from multiple testing days, and each testing day's samples are spread across multiple batches. - Include Technical Controls: If feasible, spike in internal RNA controls (e.g., ERCC ExFold RNA Spike-In Mixes) during extraction to gauge technical noise.
Protocol 1.2: Pre-Processing & Primary Data Visualization Objective: Generate data to visualize batch associations. Methodology:
- RNA-seq Processing: Process raw FASTQ files through a standardized pipeline (e.g., STAR for alignment, featureCounts for quantification). Generate a gene count matrix.
- Quality Control Metrics: Compile key QC metrics per sample (Table 1).
- Visualization: Perform Principal Component Analysis (PCA) on the normalized (e.g., log2-CPM) gene expression matrix. Color-code the PCA plot by
Behavioral Testing Dayand shape-code byRNA Extraction Batch.
Table 1: Key QC Metrics for Batch Effect Diagnosis
| Metric | Target Range | Indication of Batch Effect |
|---|---|---|
| Total Reads | >20M per sample | Large inter-batch variation suggests library prep issues. |
| Mapping Rate | >70% to reference genome | Low rates in a batch suggest extraction degradation. |
| ERCC Spike-In Correlation | R² > 0.9 between batches | Low correlation indicates batch-specific technical variance. |
| 3'/5' Bias (for poly-A selection) | Median ratio < 5 | High bias in a batch indicates RNA quality issues. |
| PCA Clustering | Samples cluster by phenotype | Clustering by testing day or extraction batch signals a batch effect. |
Title: RNA-seq PCA Workflow for Batch Diagnosis
2. Correction Protocols
Protocol 2.1: Using Statistical Models for Batch Correction (ComBat-seq) Objective: Remove batch effects from count data prior to differential expression analysis. Methodology:
- Input Preparation: Prepare a raw count matrix (genes x samples) and a sample information table with columns for
Batch(Extraction Batch ID) andCondition(Behavioral Phenotype/Day). - Run ComBat-seq: Using the
svapackage in R/Bioconductor, apply ComBat-seq, specifying thebatchparameter and preserving theconditionof interest as the biological variable.
- Validation: Re-run PCA on the adjusted count matrix. Successful correction should show reduced clustering by batch and enhanced clustering by condition.
Protocol 2.2: Incorporating Batch as a Covariate in Linear Models (DESeq2) Objective: Account for batch during statistical testing for differential expression. Methodology:
- Design Formula: Construct a design formula that includes both the primary variable of interest (e.g., behavioral condition) and the batch variable.
- Analysis: Proceed with standard DESeq2 analysis (
DESeq,results). The model will estimate and adjust for the effect ofExtraction_Batch. - Note: This method is preferred when batch is balanced with condition. It does not "remove" batch from the data but accounts for it in the model.
Table 2: Comparison of Batch Correction Methods
| Method | Input Data Type | Key Principle | Best For This Scenario |
|---|---|---|---|
| ComBat-seq | Raw Counts | Empirical Bayes adjustment of counts. | Strong RNA extraction batch effect with imbalance. |
| DESeq2 with Covariate | Raw Counts | Models batch as a covariate in GLM. | Balanced design, where batch is a known nuisance variable. |
| limma removeBatchEffect | Normalized Log-Expression | Removes batch effect via linear model. | Preparing batch-corrected data for clustering or machine learning. |
Title: Decision Pathway for Batch Correction Method
The Scientist's Toolkit: Research Reagent Solutions
| Item | Function in Batch Management |
|---|---|
| ERCC RNA Spike-In Mixes | Defined RNA controls added pre-extraction to monitor technical variance and normalization efficacy across batches. |
| RNAlater Stabilization Solution | Preserves RNA integrity at tissue collection, mitigating degradation bias between behavioral testing days. |
| Automated Nucleic Acid Extractor | Increases consistency and reduces human error during RNA extraction, the primary source of batch effects. |
| DV200 Assay Kit (Bioanalyzer/TapeStation) | Precisely assesses RNA integrity pre-library prep, allowing for batch balancing based on RNA Quality Number. |
| Unique Dual Index (UDI) Oligo Kits | Enables multiplexing of samples from different testing days into a single library prep batch, reducing confoundedness. |
| Commercial One-Step RT-qPCR Kits | For validating candidate genes post-correction; use consistent kit lot across all validation assays. |
Within the context of a thesis on RNA-seq experimental design for behavioral studies research, capturing the full dynamic range of the transcriptome is paramount. Behavioral phenotypes are often driven by subtle, cell-type-specific molecular changes, where low-abundance transcripts—such as neuropeptides, immediate-early genes, or transcription factors—can be critical mechanistic drivers. Standard RNA-seq protocols are biased toward highly expressed genes, risking the loss of these rare signals. This application note details current techniques and protocols designed to enhance the detection of low-abundance transcripts, enabling deeper insight into the molecular underpinnings of behavior.
Key Techniques for Enriching Rare Transcripts
rRNA & Globin RNA Depletion
Ribosomal RNA (rRNA) constitutes >80% of total RNA, overwhelming sequencing depth. Depletion is essential.
Protocol: Probe-Based rRNA Depletion (e.g., RNase H Method)
- Hybridization: Mix 1-2 µg of total RNA with 1 µL of species-specific rRNA DNA oligonucleotide probe set (e.g., human/mouse/rat RiboZero). Incubate at 95°C for 2 min, then 45°C for 10 min.
- RNase H Digestion: Add 2 µL of RNase H (5 U/µL) and 4 µL of 10X RNase H buffer. Incubate at 45°C for 30 min.
- Cleanup: Purify RNA using magnetic beads (e.g., SPRI beads) at a 1.8X ratio. Elute in nuclease-free water.
- QC: Assess depletion efficiency via Bioanalyzer (eukaryotic total RNA assay); ribosomal peaks should be substantially reduced.
Targeted Enrichment by Hybrid Capture
This method uses biotinylated probes to enrich for specific transcripts of interest from a cDNA library.
Protocol: Hybrid Capture for Low-Abundance Gene Panels
- Library Preparation: Construct a standard Illumina dual-indexed cDNA library from total or depleted RNA.
- Hybridization: Combine 500 ng of library with 1 µM of a custom biotinylated oligonucleotide pool (e.g., xGen Lockdown Panels) targeting your low-abundance gene set in hybridization buffer. Incubate at 95°C for 10 min, then 65°C for 16-24 hours.
- Capture: Add streptavidin magnetic beads and incubate at 65°C for 45 min. Wash beads with stringent buffers to remove non-specific binding.
- Amplification: Perform PCR amplification (12-15 cycles) of the captured library. Purify and quantify.
Molecular Indexing (Unique Molecular Identifiers - UMIs)
UMIs are random oligonucleotide tags added during reverse transcription, allowing bioinformatic correction for PCR duplication bias, crucial for accurate quantification of rare transcripts.
Protocol: UMI Integration into RNA-seq Libraries
- Primer Design: Use a reverse transcription primer containing a random UMI (e.g., 8-12 nt) and a sample barcode.
- First-Strand cDNA Synthesis: Perform RT with the UMI primer. Degrade RNA with RNase H.
- Second-Strand Synthesis: Use standard methods (e.g., dUTP for strand specificity).
- Library Construction: Proceed with adapter ligation and PCR. The final sequencing reads will contain the UMI sequence in the adapter.
- Bioinformatic Processing: Use tools like
UMI-toolsorzUMIsto group reads by UMI before alignment and deduplication.
Ultra-Deep Sequencing & Experimental Replication
Increasing sequencing depth directly increases the probability of sampling rare transcripts. Statistical power for low-count genes is heavily dependent on biological replication.
Power Analysis Protocol:
- Pilot Study: Conduct a standard RNA-seq experiment with 3-4 replicates per condition.
- Estimate Parameters: Use the pilot data to estimate the mean and dispersion of your target low-abundance genes.
- Use Power Analysis Tools: Input parameters into tools like
PROPER(R package) orScotty(web tool) to determine the required sequencing depth (e.g., 100-200 million reads/sample) and number of biological replicates (e.g., n>=6) to achieve a desired power (e.g., 80%) for fold-changes of interest.
Data Presentation: Comparative Analysis of Techniques
Table 1: Comparison of Techniques for Low-Abundance Transcript Detection
| Technique | Key Principle | Typical Increase in Detection Sensitivity for Rare Transcripts | Optimal Use Case | Major Consideration |
|---|---|---|---|---|
| rRNA Depletion | Removes abundant rRNA | 2-5x increase in unique gene detection vs. poly-A selection | Non-polyadenylated transcripts; degraded samples (e.g., post-mortem brain) | Can retain some rRNA; may deplete some mRNAs. |
| Hybrid Capture | Targeted enrichment via probes | Up to 1000x enrichment for targeted transcripts | Pre-defined gene panels (e.g., signaling pathways in a specific brain region) | Requires prior target knowledge; off-target binding. |
| Molecular Indexing (UMIs) | Corrects PCR amplification bias | Improves quantitative accuracy >50% for low-count genes | Any experiment requiring precise digital counting (e.g., single-cell or low-input) | Adds complexity to library prep and data analysis. |
| Ultra-Deep Sequencing | Increases raw sampling | Linear increase: ~2x more reads yields ~2x more rare transcript counts | Discovery-phase studies with no prior targets; complex samples | High cost; diminishing returns post-saturation. |
| Increased Replication | Improves statistical power | Increases power to detect 1.5-2x FC in low-count genes from <10% to >80% (with n=6 vs. n=3) | All behavioral studies where biological variability is high | Management of batch effects; increased total cost. |
The Scientist's Toolkit: Research Reagent Solutions
Table 2: Essential Reagents for Low-Abundance Transcript Research
| Reagent / Kit | Supplier Examples | Primary Function in Protocol |
|---|---|---|
| RiboCop rRNA Depletion Kit | Lexogen | Efficient removal of cytoplasmic and mitochondrial rRNA via RNase H. |
| xGen Hybridization Capture Kit | IDT | Provides buffers and streptavidin beads for targeted enrichment with custom probes. |
| SMARTer Stranded Total RNA-Seq Kit | Takara Bio | Integrates rRNA depletion and UMI incorporation for whole-transcriptome, strand-specific sequencing. |
| NEBNext Ultra II Directional RNA Library Prep Kit | NEB | High-efficiency library construction compatible with preceding depletion or UMI modules. |
| Qubit RNA HS Assay Kit | Thermo Fisher | Accurate quantification of low-concentration RNA pre- and post-depletion. |
| Bioanalyzer RNA 6000 Pico Kit | Agilent | Critical QC for assessing RNA integrity (RIN) and depletion efficiency. |
| Custom Double-stranded DNA Probe Pool | Twist Bioscience | Design of biotinylated probes for hybrid capture of custom gene sets. |
| SPRIselect Beads | Beckman Coulter | Size selection and cleanup of RNA and DNA libraries with minimal loss. |
Visualized Workflows and Pathways
Title: Integrated Workflow for Rare Transcript RNA-seq
Title: Factors Determining Statistical Power in RNA-seq
Within the context of a thesis on RNA-seq experimental design for behavioral studies, the integrity of RNA from post-mortem tissues is a paramount concern. Behavioral phenotypes, often linked to subtle gene expression patterns in specific brain regions, can be obscured by degradation artifacts. This document provides current Application Notes and detailed Protocols for procuring and processing post-mortem tissues to ensure high-quality RNA suitable for downstream sequencing analyses, thereby safeguarding the validity of transcriptional findings in neuropsychiatric and behavioral research.
Application Notes: Critical Factors Influencing RNA Integrity
Post-Mortem Interval (PMI)
The time between death and tissue preservation is the single most critical variable. RNases are released immediately upon cell death, leading to rapid RNA degradation. Minimizing PMI is essential, but in human studies, control over this factor is often limited.
Agonal State / Pre-Mortem Factors
The physiological state preceding death (e.g., hypoxia, fever, prolonged agonal phase) can dramatically induce stress-response genes and globally alter RNA stability, creating biological confounds distinct from degradation.
Temperature Management
Rapid cooling of the cadaver and subsequent cold chain maintenance drastically slows enzymatic degradation. Ambient temperature exposure is a primary source of artifact.
Tissue Dissection and Preservation
Rapid, precise dissection followed by immediate stabilization by flash-freezing in liquid nitrogen or immersion in RNase-inhibiting solutions is required.
RNA Integrity Number (RIN) Assessment
The Bioanalyzer or TapeStation RIN is the gold-standard metric. For RNA-seq, a minimum RIN of 7 is often required, though lower-RIN samples can be used with specific protocols (e.g., ribo-depletion).
Table 1: Impact of Post-Mortem Variables on RNA Quality
| Variable | Optimal Condition | Typical Acceptable Range | Effect on RIN (if suboptimal) |
|---|---|---|---|
| Post-Mortem Interval (PMI) | < 6 hours | < 24 hours (human); < 15 min (rodent) | Decrease of ~0.5 RIN units per 6-hour delay at RT |
| Temperature Pre-storage | 4°C immediately | 0-4°C (cold storage) | Rapid decline: >50% RNA loss in 24h at 25°C |
| Preservation Method | Snap-freeze in LN₂ | RNAlater immersion for large specimens | Incomplete stabilization leads to regional degradation |
| Tissue pH | > 6.0 (brain) | 6.0 - 6.8 | Low pH (<6.0) correlates with prolonged agonal state, lower RIN |
| Sample Size | < 0.5 cm thickness | 0.3 - 1.0 cm for flash-freezing | Core of thick samples degrades during slow freezing |
Detailed Protocols
Protocol 1: Rapid Human Brain Biobanking for RNA-seq
Objective: To harvest and stabilize human post-mortem brain tissue from specific neuroanatomical regions (e.g., prefrontal cortex, amygdala) for behavioral disorder studies.
Materials:
- Pre-chilled dissection toolkit (autoclaved, RNaseZap treated)
- Liquid nitrogen and dry ice
- Pre-labeled cryovials
- RNAlater (for optional secondary stabilization)
- -80°C freezer
- Personal protective equipment (PPE)
Procedure:
- Verification & Cooling: Confirm ethical approvals. Upon receipt, document cadaver ID, time of death, and place body in mortuary refrigerator at 4°C immediately.
- Rapid Craniotomy: Perform craniotomy as soon as possible (target PMI <12-24h). Isolate whole brain.
- Regional Dissection on Cold Stage:
- Place brain on a chilled dissection stage (0-4°C).
- Using clean tools, isolate regions of interest (ROI) with anatomical guidance.
- Cut ROI into small blocks (<0.5 cm³).
- Immediate Stabilization:
- Primary Method (Flash-Freezing): Submerge each block directly into liquid nitrogen for 60 seconds. Transfer to pre-chilled, labeled cryovial. Store at -80°C.
- Alternative Method (RNAlater): For larger or more heterogeneous samples, immerse tissue in 5-10 volumes of RNAlater at 4°C overnight, then remove and store at -80°C.
- Documentation: Record ROI, hemisphere, weight, PMI, and preservation method for each sample.
Protocol 2: RNA Extraction from Low-RIN Post-Mortem Tissue
Objective: To isolate total RNA from archived, potentially degraded post-mortem tissue, optimized for ribodepletion RNA-seq library prep.
Materials:
- Mortar and pestle (pre-chilled with LN₂)
- TRIzol Reagent or equivalent phenol-guanidine isothiocyanate solution
- Chloroform
- Glycogen (molecular biology grade)
- RNeasy MinElute Cleanup Kit (Qiagen)
- DNase I, RNase-free
| Research Reagent Solutions |
|---|
| TRIzol/Chloroform: Denatures proteins and separates RNA into aqueous phase. Critical for inactivating RNases in homogenate. |
| RNase-free DNase I: Essential for removing genomic DNA contamination, which can interfere with RNA-seq. |
| RNeasy MinElute Columns: Silica-membrane columns for purifying and concentrating low-abundance RNA from degraded samples. |
| RNA Stable Tubes (Biomatrica): For long-term storage of extracted RNA at 4°C, minimizing freeze-thaw degradation. |
| RiboCop rRNA Depletion Kit: For effective removal of ribosomal RNA from degraded samples where the 28S/18S ratio is not informative. |
Procedure:
- Homogenization:
- Under liquid nitrogen, pulverize 30-50 mg of frozen tissue using a mortar and pestle.
- Transfer powder directly to TRIzol (1 ml per 50 mg). Vortex vigorously.
- Phase Separation: Add 0.2 ml chloroform per 1 ml TRIzol. Shake, incubate 3 min at RT, centrifuge at 12,000g for 15 min at 4°C.
- RNA Precipitation: Transfer aqueous phase to a new tube. Add 1 µl glycogen and 0.5 ml isopropanol. Incubate at -20°C for 1 hour. Centrifuge at 12,000g for 30 min at 4°C.
- Wash and DNase Treatment: Wash pellet with 75% ethanol. Air-dry briefly. Resuspend in RNase-free water. Perform on-column DNase I digestion per RNeasy MinElute protocol.
- Final Purification & QC: Complete cleanup per kit instructions. Elute in 14 µl RNase-free water. Quantify via fluorometry (Qubit RNA HS Assay) and assess integrity (Agilent TapeStation, use DV200% metric for low-RIN samples).
Protocol 3: RNA-seq Library Prep from Degraded RNA (RIN 3-7)
Objective: To construct strand-specific RNA-seq libraries optimized for degraded RNA, using ribodepletion to mitigate the loss of poly-A selection efficiency.
Materials:
- NEBNext Ultra II Directional RNA Library Prep Kit
- RiboCop rRNA Depletion Kit (Human/Mouse/Rat) or similar
- AMPure XP beads
- Thermocycler
- TapeStation D1000/High Sensitivity Screens
Procedure:
- Ribosomal RNA Depletion:
- Start with 100-500 ng total RNA (input scalable based on degradation).
- Follow RiboCop protocol for probe hybridization, RNase H digestion, and cleanup. Use the provided beads.
- RNA Fragmentation & cDNA Synthesis:
- Fragment depleted RNA (if not already degraded) using metal ions at 94°C for 6-8 min.
- Synthesize first-strand cDNA using random hexamer priming (not oligo-dT).
- Synthesize second-strand cDNA with dUTP incorporation for strand specificity.
- Library Construction:
- Perform end repair, dA-tailing, and adapter ligation per NEBNext protocol.
- Clean up ligation products with AMPure XP beads (0.9x ratio).
- Perform USER enzyme digestion to degrade the second strand (strand-specific selection).
- Library Amplification & QC:
- Amplify library with 10-12 cycles of PCR.
- Perform double-sided size selection with AMPure XP beads (e.g., 0.55x/0.85x ratios) to remove adapter dimers and select ~200-500 bp inserts.
- Quantify library by qPCR (KAPA Library Quant Kit) and check size profile on TapeStation.
Visualizations
Title: Factors Leading to RNA Degradation vs. Preservation
Title: RNA Extraction & QC Workflow for Post-Mortem Tissue
Title: RNA-seq Library Prep from Degraded RNA
A primary challenge in behavioral neuroscience is distinguishing whether observed changes in gene expression (e.g., from RNA-seq) cause a behavioral phenotype, are a consequence of it, or are merely correlated with it due to a hidden third variable. Incorrect causal inference can misdirect entire research programs and drug development pipelines. This document outlines critical protocols and considerations for designing RNA-seq studies in behavioral research to move beyond correlation toward causation.
Key Confounding Factors & Interpretative Pitfalls (Table)
Table 1: Common Confounding Factors in Gene Expression-Behavior Studies
| Confounding Factor | Description | Impact on Interpretation |
|---|---|---|
| Circadian Rhythm | Gene expression varies dramatically over the 24-hour cycle. | An observed differential expression (DE) may be due to timing of tissue harvest rather than the behavioral manipulation. |
| Stress Response | Handling, novel environment, or the test itself induces a acute stress transcriptional signature. | DE may reflect generalized stress, not the specific neural process under study (e.g., learning, aggression). |
| Motor Activity & Feeding | Many behavioral tests involve changes in locomotion or food/water intake. | DE in metabolic or muscle genes may be downstream of activity changes, not upstream causatives. |
| Hidden Third Variables | Unmeasured factors like microbiota composition, subtle environmental differences. | Can create spurious correlations between transcriptome and behavior across subjects. |
| Cell Proportion Shift | Behavioral state may alter cellular composition (e.g., glial activation, cell death) in sampled tissue. | Bulk RNA-seq DE may reflect changes in cell numbers, not regulation within a consistent cell population. |
Recommended Experimental Protocols
Protocol 3.1: Paired Longitudinal Sampling Design
Objective: To disambiguate whether transcriptomic changes precede (potentially cause) or follow (are consequences of) behavior.
- Pre-Behavior Baseline: Extract tissue (e.g., via biopsy) or collect biofluid (e.g., blood) for baseline RNA-seq from all subjects.
- Behavioral Phenotyping: Perform comprehensive behavioral battery (see Protocol 3.3).
- Post-Behavior Sampling: Immediately following behavioral tests, collect matched tissue for RNA-seq.
- Analysis: Compare within-subject changes (post vs. pre). Subjects that develop a behavioral extreme can be analyzed for transcriptional changes that predicted the outcome.
Protocol 3.2: Causal Intervention & Validation
Objective: To test causal hypotheses generated from correlational RNA-seq data.
- Hypothesis Generation: From initial RNA-seq, identify candidate genes whose expression correlates with behavioral variance.
- Targeted Perturbation: In a new cohort, experimentally manipulate candidate gene expression in vivo:
- Knockdown/Knockout: Use viral-mediated RNAi, CRISPR/Cas9, or conditional mutagenesis.
- Overexpression: Use viral vectors (e.g., AAV) for gene overexpression.
- Pharmacological Modulation: Use agonists/antagonists if the gene product is druggable.
- Behavioral Assessment: Subject manipulated animals to the original behavioral paradigm.
- Interpretation: If manipulation bidirectionally affects the predicted behavior, it supports a causal role. Always include off-target and vehicle controls.
Protocol 3.3: Comprehensive Behavioral Battery for RNA-seq Studies
Objective: To control for behavioral specificity and avoid confounds from general activity or stress.
- Habituation: Handle animals and habituate to testing rooms for ≥7 days.
- Test Order: Administer tests from least to most stressful. Example order: a. Open Field (general activity, anxiety-like). b. Social Interaction (sociability). c. Elevated Plus Maze (anxiety-like). d. Forced Swim Test or Tail Suspension Test (depression-like). e. Fear Conditioning or Morris Water Maze (learning & memory).
- Temporal Control: Perform all tests at the same circadian time. Include "Cage Control" groups that are handled but not tested.
- Tissue Harvest: Harvest tissue rapidly (<5 min) following final test under controlled conditions to minimize acute stress artifacts.
Data Analysis & Validation Workflow
Title: From Correlation to Causation Workflow
Table 2: Essential Research Reagent Solutions
| Item | Function & Rationale |
|---|---|
| RNase Inhibitors (e.g., RiboGuard) | Prevents degradation of RNA during tissue dissection and extraction, critical for preserving in vivo expression patterns. |
| Single-Cell RNA-seq Kits (10x Genomics, Parse Biosciences) | Resolves cell-type-specific expression changes, distinguishing genuine regulation from cellular composition artifacts. |
| Spatial Transcriptomics Platforms (Visium, MERFISH) | Maps gene expression to histological context, linking expression to specific brain nuclei or circuits. |
| Viral Vectors (AAV, LV) with Cell-Specific Promoters (CaMKIIa, GFAP, Dlx) | Enables causal manipulation (KD/OE) of candidate genes in specific, behaviorally-relevant cell populations. |
| Cell Deconvolution Software (CIBERSORTx, Bisque) | Estimates shifts in cell type proportions from bulk RNA-seq data, a critical control analysis. |
| Behavioral Phenotyping Systems (EthoVision, ANY-maze) | Provides automated, high-throughput, and objective quantification of behavior, reducing observer bias. |
| Circadian Tracking System (Cabinets, Envigo) | Controls light-dark cycles and allows harvesting in constant darkness (DD) to control for circadian confounds. |
Signaling Pathway Diagram: Linking Immediate Early Genes to Sustained Plasticity
Title: Transcriptional Cascade from Behavior to Persistent Change
Confirming and Contextualizing Findings: Validation and Multi-Omics Integration
RNA sequencing (RNA-seq) has become a cornerstone in behavioral neuroscience research, enabling unbiased profiling of transcriptomic changes in brain regions following behavioral paradigms, pharmacological interventions, or genetic manipulations. However, a central thesis in robust experimental design argues that RNA-seq data are hypothesis-generating and require orthogonal validation at multiple molecular levels. This application note details integrated protocols for validating key differentially expressed targets from an RNA-seq study on, for example, chronic social defeat stress, using quantitative Reverse Transcription PCR (qRT-PCR), In Situ Hybridization (ISH), and Western Blotting. This multi-modal approach confirms mRNA expression, provides spatial context within heterogeneous brain tissue, and verifies corresponding protein-level changes, strengthening mechanistic conclusions.
Application Notes: Strategic Use of Orthogonal Techniques
qRT-PCR serves as the first-line, high-sensitivity validation for mRNA fold-changes observed in RNA-seq. It is crucial for confirming a subset of targets (both upregulated and downregulated) in independent biological cohorts.
In Situ Hybridization (RNAscope recommended) provides cellular resolution, confirming that expression changes localize to expected brain regions (e.g., prefrontal cortex, nucleus accumbens, VTA) and cell types (e.g., neurons vs. glia), which is vital for behavioral phenotyping.
Western Blot (or other protein assays) addresses the central dogma disconnect, as transcript abundance may not correlate with protein due to post-transcriptional regulation. Validating key targets at the protein level is essential for downstream pathway analysis and drug target validation.
Detailed Protocols
Protocol 3.1: qRT-PCR for mRNA Validation from Brain Tissue
Objective: Quantitatively validate RNA-seq results for selected genes.
- Independent Sample Preparation: Homogenize frozen brain regions (e.g., PFC, amygdala) from a new cohort of animals (Control vs. Experimental) in TRIzol. Isolate total RNA, treat with DNase I, and assess purity (A260/A280 ~2.0).
- Reverse Transcription: Use 1 µg total RNA with a High-Capacity cDNA Reverse Transcription Kit using random primers in a 20 µL reaction. Include a no-reverse transcriptase (-RT) control.
- qPCR Setup: Prepare reactions in triplicate using 1:10 diluted cDNA, SYBR Green Master Mix, and 200 nM gene-specific primers. Primer Design: Amplicons should span an exon-exon junction, be 80-150 bp, with Tm ~60°C.
- Run & Analysis: Use a standard two-step cycling protocol (95°C for 10 min, then 40 cycles of 95°C for 15s, 60°C for 1 min). Calculate ∆∆Ct values using at least two stable reference genes (e.g., Gapdh, Actb, Hprt1) validated for the behavioral model.
Protocol 3.2: RNAscope In Situ Hybridization for Spatial Localization
Objective: Visualize and localize target mRNA expression in brain sections.
- Tissue Preparation: Perfuse-fix animals with 4% PFA. Post-fix brains for 24h at 4°C, then cryoprotect in 30% sucrose. Embed in OCT and section coronally at 14-20 µm on a cryostat. Store at -80°C.
- Pretreatment: Adhere slides to room temperature, post-fix in 4% PFA for 15 min, then dehydrate in graded ethanol. Treat with hydrogen peroxide, followed by target retrieval (boiling for 15 min in RNAscope target retrieval solution). Apply protease IV for 30 min at room temperature.
- Hybridization and Amplification: Follow manufacturer's protocol (ACD Bio). Apply target-specific ZZ probe pair set for 2h at 40°C in a HybEZ oven. Perform sequential amplification steps (Amp 1-6) with specified washes.
- Detection and Counterstaining: Develop signal with Fast Red or Green substrate for 10 min. Counterstain with 50% Gill's Hematoxylin for 2 min, then mount with aqueous mounting medium.
- Imaging & Analysis: Image using a fluorescence or brightfield microscope. Quantify punctate signals per cell (e.g., in ImageJ) within anatomically defined regions from ≥3 sections per animal.
Protocol 3.3: Western Blot for Protein-Level Validation
Objective: Confirm changes in protein expression of validated RNA targets.
- Protein Extraction: Homogenize frozen brain tissue in RIPA buffer with protease and phosphatase inhibitors. Centrifuge at 14,000 x g for 15 min at 4°C. Collect supernatant and determine protein concentration via BCA assay.
- Gel Electrophoresis: Load 20-30 µg protein per lane onto a 4-20% gradient SDS-PAGE gel. Run at 120V for ~90 min alongside a pre-stained protein ladder.
- Transfer: Transfer proteins to a PVDF membrane using wet or semi-dry transfer at constant current (e.g., 300 mA for 90 min).
- Blocking and Antibody Incubation: Block membrane in 5% non-fat milk in TBST for 1h. Incubate with primary antibody (e.g., anti-target, anti-β-Actin) diluted in blocking buffer overnight at 4°C. Wash (3 x 5 min TBST), then incubate with appropriate HRP-conjugated secondary antibody for 1h at RT.
- Detection: Apply ECL chemiluminescent substrate for 1-5 min. Image on a chemiluminescence imaging system. Quantify band densitometry (ImageJ or similar). Normalize target protein signal to loading control (e.g., β-Actin, GAPDH).
Table 1: Example Orthogonal Validation Data from a Hypothetical Social Defeat Stress RNA-seq Study
| Target Gene | RNA-seq Fold Change (p-value) | qRT-PCR ∆∆Ct (Fold Change) | ISH: Signal Density (Cells/mm²) | Western Blot: Protein Fold Change |
|---|---|---|---|---|
| Bdnf | -1.8 (p=0.003) | -1.7 ± 0.2* | Ctrl: 120 ± 10; SD: 75 ± 8* | 0.6 ± 0.1* (vs. β-Actin) |
| Fosb | +3.5 (p=0.001) | +3.2 ± 0.4* | Ctrl: 50 ± 6; SD: 155 ± 12* | 2.8 ± 0.3* (vs. GAPDH) |
| Gria1 | -1.3 (p=0.02) | -1.4 ± 0.2* | N.D. (Low Abundance) | 0.7 ± 0.1* (vs. β-Actin) |
| Reference | - | Gapdh (Ct ~18) | DAPI (Nuclear Stain) | β-Actin / GAPDH |
Data presented as mean ± SEM; *p < 0.05 vs. Control (Ctrl). SD: Social Defeat group. N.D.: Not Determined.
Visualizations
Title: Orthogonal Validation Workflow from RNA-seq
Title: Example Stress-Induced Signaling Pathway for Validation
The Scientist's Toolkit
Table 2: Essential Research Reagent Solutions for Orthogonal Validation
| Category | Item | Function & Rationale |
|---|---|---|
| Nucleic Acid Analysis | TRIzol Reagent | Simultaneous extraction of RNA, DNA, and protein from precious brain samples. |
| High-Capacity cDNA RT Kit | Ensures efficient, consistent reverse transcription for sensitive qPCR. | |
| SYBR Green Master Mix | Cost-effective, reliable chemistry for qRT-PCR quantification of target genes. | |
| RNAscope Probe Sets | Pre-designed, validated ZZ probes for specific, sensitive mRNA ISH with low background. | |
| Protein Analysis | RIPA Lysis Buffer | Comprehensive lysis buffer for total protein extraction from brain tissue. |
| Protease/Phosphatase Inhibitor Cocktail | Preserves protein integrity and phosphorylation states critical for signaling studies. | |
| HRP-conjugated Secondary Antibodies | Enable chemiluminescent detection of primary antibodies in Western blot. | |
| Clarity ECL Substrate | High-sensitivity chemiluminescent substrate for detecting low-abundance proteins. | |
| General & Controls | β-Actin / GAPDH Antibodies | Standard loading controls for normalizing Western blot data. |
| Gapdh, Hprt1 qPCR Primers | Commonly used reference genes for normalizing qRT-PCR data (must be validated). | |
| DAPI (4',6-diamidino-2-phenylindole) | Nuclear counterstain for ISH and immunohistochemistry to visualize all cells. | |
| Normal Donkey/Goat Serum | Used in blocking buffers to reduce non-specific antibody binding in ISH/Western. |
Within a thesis on RNA-seq experimental design for behavioral studies, functional validation is the critical step that moves beyond correlation to establish causality. Identifying differentially expressed transcripts via RNA-seq in a behavioral paradigm (e.g., stress, learning, addiction) generates hypotheses. This document provides application notes and protocols for three core validation strategies—genetic perturbation (knockdown/knockout), pharmacological intervention, and behavioral rescue—to directly connect specific RNA transcripts or pathways to behavioral phenotypes.
Core Validation Strategies & Workflow
Strategy Comparison Table
Table 1: Functional Validation Strategies for Behavioral Transcriptomics
| Strategy | Primary Target | Temporal Control | Throughput | Key Advantage | Key Limitation |
|---|---|---|---|---|---|
| Knockout (KO) | Germline or conditional gene deletion | Conditional (e.g., Cre-ERT2) allows adult onset | Low | Conclusive evidence of gene necessity; permanent. | Developmental compensation; time/resource intensive. |
| Knockdown (KD) | mRNA via shRNA, siRNA, or ASO | Inducible systems available (e.g., Tet-off). | Medium-High | Faster than KO; allows acute manipulation in adults. | Off-target effects; incomplete efficacy. |
| Pharmacological | Protein product (receptor, enzyme) | High (acute or chronic dosing) | High | Translational relevance; rapid testing. | Lack of absolute target specificity. |
| Behavioral Rescue | Pathway modulation | Depends on rescue agent | Medium | Demonstrates sufficiency; strong causal link. | Requires prior knowledge of pathway direction. |
Integrated Experimental Workflow Diagram
Diagram Title: Functional Validation Workflow from RNA-seq to Behavior
Detailed Protocols
Protocol: Conditional Knockout & Behavioral Phenotyping
Objective: To validate that a candidate gene identified in an RNA-seq study is necessary for a specific behavior (e.g., social approach) using a tamoxifen-inducible, cell-type specific knockout mouse model.
Materials: See "Scientist's Toolkit" (Section 5).
Procedure:
- Genotyping & Group Assignment: House homozygous floxed (GeneXᶠˡˣ/ᶠˡˣ) mice expressing Cre-ERT2 under a cell-type specific promoter (e.g., CamKIIα for forebrain excitatory neurons). Randomly assign to Cre+ (Experimental) and Cre- (Control) groups. Perform tail-clip genotyping via PCR.
- Induction of Knockout: At 10-12 weeks of age, administer tamoxifen (75 mg/kg, i.p., in corn oil) or vehicle for 5 consecutive days to both groups. Allow a 14-day washout for Cre-mediated recombination and tamoxifen clearance.
- Molecular Validation: Sacrifice a subset of animals (n=3-4 per group). Perform qPCR on microdissected brain region of interest (e.g., prefrontal cortex) to confirm >70% reduction in GeneX mRNA. Western blot for protein reduction is recommended.
- Behavioral Battery (Start 3 weeks post-induction):
- Open Field Test (Day 1): Assess general locomotor activity and anxiety-like behavior.
- Social Interaction Test (Day 3): Using a three-chamber apparatus, quantify time spent investigating a novel mouse vs. an empty cup.
- Behavioral Analysis: Score videos automatically (e.g., EthoVision XT) or manually by a blinded experimenter.
- Statistical Analysis: Compare Cre+ vs. Cre- groups using two-tailed t-test or two-way ANOVA with factors Genotype and Stimulus, followed by post-hoc tests. A significant interaction effect in the social test validates the hypothesis.
Protocol: Pharmacological Rescue of a Behavioral Phenotype
Objective: To rescue a behavioral deficit observed in a genetic model (KO/KD) by acute modulation of a downstream pathway identified by RNA-seq pathway analysis (e.g., mTOR signaling).
Materials: See "Scientist's Toolkit" (Section 5).
Procedure:
- Animal Model: Use a validated knockout or knockdown model with a consistent behavioral deficit (e.g., impaired fear extinction).
- Drug Preparation: Prepare fresh solution of the rescue agent (e.g., mTOR activator, R-BPCA, 10 mg/kg) and vehicle (e.g., 5% DMSO in saline) on the day of the experiment.
- Experimental Design: Use a within-subjects or between-subjects design. For within-subjects, counterbalance vehicle/drug administration across test days with a 72-hour washout.
- Administration & Behavior: Administer drug or vehicle (i.p. or s.c.) 30 minutes prior to the behavioral session. Conduct the fear extinction paradigm: place mouse in context, play tone (CS) without foot shock (US), and record freezing behavior over 15-20 trials.
- Analysis: Compare percentage freezing across trials between Vehicle-Treated KO, Drug-Treated KO, and Wild-Type groups. A significant reduction in freezing in the Drug-Treated KO group towards wild-type levels confirms a successful rescue and implicates the pathway.
Pathway Visualization
Signaling Pathway for a Hypothetical Rescue Experiment
Diagram Title: Pharmacological Rescue of a KO-Induced Behavioral Deficit
The Scientist's Toolkit
Table 2: Essential Research Reagents & Materials
| Item | Function/Description | Example(s) |
|---|---|---|
| Tamoxifen | Induces nuclear translocation of Cre-ERT2 for conditional, temporal gene knockout in vivo. | Prepared in corn oil for intraperitoneal injection. |
| Cre-Driver Lines | Provides cell-type specificity for genetic manipulations (e.g., CaMKIIα-Cre for forebrain neurons). | Available from repositories like Jackson Laboratory. |
| AAV-shRNA | Allows region-specific, inducible knockdown in the adult brain. | Use with doxycycline-inducible (Tet-off) systems for temporal control. |
| Stereotaxic Apparatus | Enables precise intracerebral delivery of viral vectors (AAV) or antisense oligonucleotides. | Critical for targeting specific brain circuits identified in RNA-seq. |
| Behavioral Tracking Software | Automates quantification of animal movement and interaction for objective analysis. | EthoVision XT, ANY-maze, DeepLabCut. |
| Pathway-Specific Agonists/Antagonists | Pharmacological tools for rescue or mimicry experiments based on RNA-seq pathway enrichment. | mTOR activators (R-BPCA), BDNF mimetics, selective receptor modulators. |
| RNAScope / qPCR Kits | Validates target gene knockdown/knockout at the transcript level in specific brain regions. | Provides cellular resolution of molecular efficacy. |
Application Notes
Within a thesis on RNA-seq experimental design for behavioral studies, integrating bulk and single-cell/nucleus RNA-seq (sc/snRNA-seq) is paramount. Behavioral phenotypes arise from complex, coordinated changes across heterogeneous brain cell populations. Bulk RNA-seq provides a high-fidelity, cost-effective overview of the system's molecular state, ideal for longitudinal studies or large cohort analyses common in behavioral research. However, it obscures cell-type-specific contributions. sc/snRNA-seq deconvolutes this heterogeneity, identifying rare cell populations and cell-state transitions critical for neural plasticity. The true power lies in their complementarity: bulk data validates the magnitude of population-level shifts, while single-cell data explains the cellular drivers. This multi-resolution approach is essential for linking molecular changes from interventions (e.g., drug exposure, stress paradigms) to behavioral outcomes and identifying precise cellular targets for neuropsychiatric drug development.
Comparative Data Summary
Table 1: Core Characteristics and Complementary Roles of Bulk and Single-Cell/Nucleus RNA-seq
| Aspect | Bulk Tissue RNA-seq | Single-Cell/Nucleus RNA-seq | Complementary Function |
|---|---|---|---|
| Resolution | Population average (~10⁴-10⁶ cells). | Individual cell/nucleus level. | Bulk confirms system-wide changes; single-cell identifies contributing cell types. |
| Detection Sensitivity | High for abundant transcripts; masks low-expression genes from rare cells. | Can detect rare transcripts but with higher technical noise and dropouts. | Bulk validates high-confidence DEGs; single-cell finds rare, cell-type-specific markers. |
| Cost & Throughput | Lower cost per sample; high sample throughput ideal for cohorts. | High cost per cell; lower sample throughput. | Bulk screens large N for behavioral correlations; single-cell deeply profiles select key samples. |
| Data Complexity | Lower; single expression vector per sample. | High; requires specialized bioinformatics for clustering, trajectory inference. | Bulk provides straightforward DE targets; single-cell generates testable hypotheses on cellular dynamics. |
| Ideal Application in Behavioral Studies | Identifying molecular signatures of behavior across groups/time (e.g., prefrontal cortex of resilient vs. susceptible mice). | Mapping cell-type-specific responses (e.g., dopamine neuron subpopulations after reward learning). | Linking bulk behavioral signatures to specific cellular drivers and circuits. |
Table 2: Quantitative Data Integration from a Hypothetical Behavioral Study (Chronic Stress Model)
| Data Type | Key Finding | Bulk Data | Single-Cell Data | Integrated Conclusion |
|---|---|---|---|---|
| Differential Expression | Upregulation of inflammatory genes. | 5x increase in Tnf mRNA in whole hippocampus. | Tnf expression localized to a microglial subcluster (12% of cells). | Neuroinflammation is driven by a specific microglial state, not global response. |
| Pathway Analysis | Synaptic signaling alteration. | Moderate downregulation of synaptic gene set (FDR=0.01). | Strong downregulation in excitatory neuron cluster 4; offset by upregulation in cluster 7. | Net bulk change masks opposing, cell-type-specific synaptic remodeling. |
| Cohort Analysis | Correlation with behavioral despair. | Global Bdnf levels correlate with immobility time (r=-0.65). | Correlation is specific to Bdnf in oligodendrocyte precursor cells (r=-0.82). | Identifies a novel cellular target (OPCs) for modulating behavioral despair. |
Experimental Protocols
Protocol 1: Integrated Design for a Behavioral Neuroscience Study
- Cohort & Intervention: Subject a cohort (e.g., n=40 mice) to a behavioral paradigm (e.g., chronic social defeat stress) with appropriate controls.
- Bulk RNA-seq Screening: Perform bulk RNA-seq on relevant tissue (e.g., nucleus accumbens) for all subjects. Correlate expression profiles with behavioral metrics (e.g., social interaction ratio).
- Candidate Sample Selection: Based on bulk data and extreme behavioral phenotypes, select a subset of samples (e.g., n=3 resilient, n=3 susceptible) for deep profiling.
- Single-Cell/Nucleus RNA-seq: a. Tissue Dissociation or Nuclei Isolation: For scRNA-seq, prepare a live single-cell suspension using enzymatic digestion. For snRNA-seq (preferred for frozen tissue or complex brain regions), isolate nuclei via Dounce homogenization in lysis buffer, followed by density centrifugation. b. Library Preparation & Sequencing: Use a platform (e.g., 10x Genomics Chromium) to generate barcoded libraries. Target ~10,000 cells per sample and a sequencing depth of ~50,000 reads per cell.
- Computational Integration: a. Perform standard sc/snRNA-seq analysis (clustering, annotation). b. Use deconvolution tools (e.g., CIBERSORTx, MuSiC) with the single-cell data as a reference to estimate cell-type proportions in the bulk samples. c. Perform cross-validation of differential expression findings.
Protocol 2: Validation via Spatial Transcriptomics
- Sectioning: Fresh-frozen tissue from the same cohort is cryosectioned at 10 µm thickness.
- Probe Hybridization: Use a commercial spatial transcriptomics platform (e.g., Visium by 10x Genomics). Permeabilize tissue to allow mRNA binding to spatially barcoded oligonucleotides on the slide.
- Library Prep & Sequencing: Generate libraries from the bound cDNA and sequence.
- Integration: Overlay spatial expression data with cell-type markers identified from sc/snRNA-seq to confirm anatomical localization and context.
Visualizations
Diagram Title: Integrated RNA-seq Workflow for Behavioral Studies
Diagram Title: Logic of Bulk and Single-Cell Data Integration
The Scientist's Toolkit: Research Reagent Solutions
Table 3: Essential Materials for Integrated RNA-seq Studies in Neuroscience
| Item | Function/Benefit | Example Product/Category |
|---|---|---|
| Nuclei Isolation Kit (for snRNA-seq) | Gentle, optimized buffers for nuclei extraction from fresh or frozen brain tissue, preserving RNA integrity. | Miltenyi Biotec Nuclei Isolation Kit; Corning Nuclei Prep Kit. |
| Live/Dead Cell Stain | Critical for scRNA-seq viability assessment. Dead cells increase background noise. | AO/PI staining; Fluorescent reactive dyes (e.g., Calcein AM). |
| Single-Cell 3' GEM Kit | Platform-specific kit for barcoding, reverse transcription, and library construction of single-cell/nuclei suspensions. | 10x Genomics Chromium Next GEM Single Cell 3' Kit. |
| Dual Index Kit (Bulk RNA-seq) | For multiplexed, cost-effective sequencing of large bulk sample cohorts. | Illumina TruSeq RNA UD Indexes; IDT for Illumina UD Indexes. |
| RNase Inhibitor | Essential for all steps post-tissue collection to prevent RNA degradation. | Recombinant RNase Inhibitor (e.g., from Takara, Lucigen). |
| Spatial Transcriptomics Slide | Array-coated glass slide for capturing mRNA from tissue sections with spatial barcodes. | 10x Genomics Visium Spatial Tissue Optimization & Gene Expression Slides. |
| Deconvolution Software | Computational tool to infer cell-type proportions and expression from bulk data using a single-cell reference. | CIBERSORTx, MuSiC, BisqueRNA. |
Application Notes
Within the context of a thesis on RNA-seq experimental design for behavioral studies, integrating multi-omics data is essential to move from correlative gene expression snapshots to a functional, mechanistic understanding of behavior. RNA-seq identifies transcriptional changes in brain regions associated with behaviors like anxiety, reward, or social defeat. However, these mRNA levels often correlate poorly with functional protein abundance, metabolic state, or stable epigenetic modifications that underlie neuroplasticity. The integration of proteomics, metabolomics, and epigenetics contextualizes transcriptional findings, revealing post-transcriptional regulation, immediate biochemical fluxes, and enduring genomic scars of experience.
Key Insights:
- Proteomics validates and extends RNA-seq data, identifying key signaling hubs (e.g., kinase cascades) and post-translational modifications (phosphorylation) that are the direct actuators of neuronal function.
- Metabolomics provides a real-time readout of neuroenergetics, neurotransmitter cycling, and stress-related biochemical pathways, offering a direct link between cellular physiology and behavior.
- Epigenetics (e.g., ATAC-seq, MeDIP-seq) reveals the regulatory landscape that primes or perpetuates transcriptional programs, explaining long-term behavioral adaptations or predispositions.
This multi-omics integration enables the construction of causal networks, distinguishing upstream drivers from downstream consequences in behavioral phenotypes, which is critical for identifying high-confidence therapeutic targets in neuropsychiatric drug development.
Table 1: Comparison of Key Omics Technologies for Behavioral Research
| Omics Layer | Typical Sample Input (Brain Region) | Key Measured Molecules | Temporal Resolution | Primary Insight for Behavior |
|---|---|---|---|---|
| Transcriptomics (RNA-seq) | 10-100 ng total RNA | mRNA, lncRNA, miRNA | Hours to days | Differential gene expression pathways activated or suppressed. |
| Proteomics (LC-MS/MS) | 10-100 µg protein | Proteins, peptides, PTMs (e.g., phosphorylation) | Days | Functional protein abundance, signaling pathway activation, synaptic protein complexes. |
| Metabolomics (LC-MS/GC-MS) | 10-50 mg tissue / 10-50 µL biofluid | Metabolites (amino acids, neurotransmitters, lipids) | Minutes to hours | Immediate biochemical state, energy metabolism, neurotransmitter levels. |
| Epigenetics (ATAC-seq) | 50,000+ nuclei | Chromatin accessibility regions | Stable to days/months | Regulatory potential, transcription factor binding site availability. |
Table 2: Example Multi-Omics Findings in a Chronic Social Defeat Stress (CSDS) Mouse Model
| Omics Layer | Susceptible Phenotype vs. Control | Resilient Phenotype vs. Control | Integrated Interpretation |
|---|---|---|---|
| RNA-seq (Prefrontal Cortex) | ↑ Bdnf, ↑ Fkbp5, ↓ synaptic genes | Mild ↑ in inflammatory genes, ↑ Oxtr | Susceptibility involves stress-response and synaptic loss. Resilience may involve distinct neuropeptide signaling. |
| Proteomics (Prefrontal Cortex) | ↓ PSD-95 protein, ↑ phosphorylated CREB | ↑ OXTR protein, ↑ mitochondrial complex proteins | Post-transcriptional regulation of synaptic scaffolds; resilience linked to stable OXTR and energy metabolism. |
| Metabolomics (Plasma/PFC) | ↑ Kynurenine/Tryptophan ratio, ↓ GABA | ↑ Lactate, ↑ β-hydroxybutyrate | Susceptibility linked to neurotoxic metabolite shift; resilience linked to alternative energy substrates. |
| Epigenetics (ATAC-seq, NAc) | Increased accessibility at glucocorticoid receptor response elements | Increased accessibility at enhancers near Oxtr and Cpne6 | Lasting chromatin changes predispose to stress-response or resilience pathways. |
Detailed Protocols
Protocol 1: Integrated Workflow from Behavioral Paradigm to Multi-Omic Analysis
- Behavioral Model: Subject rodents to a validated paradigm (e.g., CSDS, open field test, sucrose preference). Perform precise behavioral phenotyping.
- Tissue Collection: Rapidly dissect brain regions of interest (e.g., prefrontal cortex, nucleus accumbens, hippocampus) immediately after behavioral testing. Snap-freeze in liquid nitrogen. For epigenetics, some tissue may be processed fresh for nuclei isolation.
- Sample Allocation: Homogenize each tissue sample and aliquot for RNA, protein, metabolite, and chromatin extraction.
- Parallel Processing:
- RNA-seq: Extract total RNA, assess RIN >8.5. Prepare libraries (e.g., poly-A selection). Sequence on Illumina platform (≥30M paired-end reads).
- Proteomics: Lyse tissue, digest proteins with trypsin. Perform TMT or label-free LC-MS/MS on a Q Exactive HF or similar instrument.
- Metabolomics: Extract metabolites using cold methanol/water. Analyze via hydrophilic interaction LC-MS for polar metabolites and reversed-phase LC-MS for lipids.
- Epigenetics (ATAC-seq): Isolate nuclei, tagment with Tn5 transposase, purify, and amplify DNA for sequencing.
- Bioinformatics Integration: Map and quantify each data type. Perform differential analysis per omics layer. Use multi-optic integration tools (e.g., MOFA2, WGCNA, pathway enrichment overlays) to identify convergent pathways and regulatory networks.
Protocol 2: Targeted Validation of a Multi-Omics Node (e.g., Kynurenine Pathway)
- Hypothesis: RNA-seq shows altered indoleamine 2,3-dioxygenase (Ido1) expression; metabolomics shows increased kynurenine. Hypothesis: IDO1 enzyme activity drives kynurenine production, influencing behavior.
- Enzymatic Activity Assay: Homogenize tissue in assay buffer. Use an IDO1 activity assay kit to spectrophotometrically measure kynurenine production from tryptophan. Compare activity across behavioral groups.
- Spatial Localization: Perform RNAScope in situ hybridization for Ido1 mRNA combined with immunofluorescence for cell-type markers (e.g., IBA1 for microglia) on fresh-frozen brain sections.
- Pharmacological Manipulation: Administer an IDO1 inhibitor (e.g., 1-MT) systemically during the behavioral paradigm. Re-assess behavior and post-mortem kynurenine levels via targeted LC-MS/MS.
- Functional Proteomics: Immunoprecipitate IDO1 protein and interacting partners from brain lysates, followed by LC-MS/MS to identify protein complexes regulating its function.
Visualizations
Diagram 1: Multi-omics Integration Workflow for Behavior
Diagram 2: Integrated Kynurenine Pathway in Stress Response
The Scientist's Toolkit: Key Research Reagent Solutions
Table 3: Essential Materials for Multi-Omic Behavioral Studies
| Item | Function & Application | Example Product/Kit |
|---|---|---|
| Triple Omics Kit | Sequential extraction of RNA, protein, and metabolites from a single tissue sample, minimizing biological variation. | MPLEx Protocol reagents / commercial all-in-one kits. |
| TMTpro 16plex | Tandem Mass Tag reagents for multiplexed quantitative proteomics, enabling simultaneous analysis of up to 16 behavioral samples in one LC-MS/MS run. | Thermo Scientific TMTpro 16plex Kit. |
| Tn5 Transposase | Enzyme for tagmenting accessible chromatin in ATAC-seq protocols, critical for epigenomic profiling from low cell numbers. | Illumina Tagment DNA TDE1 Enzyme / DIY purified Tn5. |
| RiboZero Gold rRNA Removal Kit | Depletion of ribosomal RNA for RNA-seq, improving sequencing depth of mRNA and non-coding RNAs from brain tissue. | Illumina RiboZero Gold (HMR). |
| C18 & HILIC SPE Columns | Solid-phase extraction columns for cleaning and fractionating metabolite samples prior to LC-MS, improving detection. | Waters Oasis, Supelco Discovery. |
| Phosphatase/Protease Inhibitor Cocktails | Essential additives to lysis buffers for proteomics and phosphoproteomics to preserve post-translational modifications. | Roche cOmplete, PhosSTOP. |
| 1-Methyl-DL-Tryptophan (1-MT) | A prototypical small-molecule inhibitor of IDO1 enzyme activity, used for functional validation of kynurenine pathway findings. | Sigma-Aldrich 457611. |
| Cell-Type-Specific Antibodies | For immunoprecipitation of nuclei (e.g., NeuN for neurons) for cell-type-specific ATAC-seq or proteomics. | Millipore Anti-NeuN (MAB377). |
1. Introduction and Thesis Context Within a thesis on RNA-seq experimental design for behavioral studies, cross-study validation using public repositories like GEO is a critical final chapter. It moves beyond single-study limitations, testing the robustness and generalizability of transcriptomic signatures (e.g., for stress, addiction, or cognitive processes) across diverse experimental conditions, populations, and platforms. This protocol details the systematic approach for this validation.
2. Key Public Repositories and Data Summary The table below summarizes primary sources for behavioral transcriptomics data.
Table 1: Primary Public Repositories for Behavioral Transcriptomics Data
| Repository Name | Primary Data Types | Key Behavioral Study Examples | Accession Example Prefix |
|---|---|---|---|
| Gene Expression Omnibus (GEO) | RNA-seq, microarray, methylation | Chronic social defeat stress, drug self-administration, fear conditioning | GSE, GDS |
| Sequence Read Archive (SRA) | Raw sequencing reads (FASTQ) | Paired with GEO studies for raw data | SRR, SRX |
| ArrayExpress | Microarray, RNA-seq | Similar scope to GEO, with European focus | E-MTAB- |
| BrainRNAseq | Curated brain-specific RNA-seq | Brain region-specific studies across behaviors | Integrated from GEO/SRA |
Table 2: Quantitative Snapshot of a Cross-Study Validation Corpus (Hypothetical)
| Validation Corpus Theme | Number of Independent Studies | Total Samples | Species | Platform Heterogeneity |
|---|---|---|---|---|
| Prefrontal Cortex in Opioid Dependence | 5 | 125 (75 case, 50 control) | Mus musculus | 3x Illumina, 2x Affymetrix |
| Hippocampal Transcriptome after Acute Stress | 8 | 200 (100 stress, 100 control) | R. norvegicus, M. musculus | 5x RNA-seq, 3x microarray |
3. Protocol: Systematic Cross-Study Validation Workflow
Protocol 3.1: Dataset Curation and Harmonization Objective: To identify, acquire, and preprocess relevant datasets into a coherent analysis-ready format.
- Search Strategy: Use controlled vocabulary. Example PubMed query:
("GEO"[All Fields] OR "Gene Expression Omnibus"[All Fields]) AND ("RNA-seq"[All Fields] OR "transcriptome"[All Fields]) AND ("fear extinction"[MeSH Terms] OR "cocaine"[MeSH Terms]). - Inclusion/Exclusion Criteria: Define by species, brain region (using ontology terms, e.g., "prefrontal cortex"), behavioral paradigm, sample size (>N=5 per group), and data completeness.
- Metadata Harmonization: Create a unified sample annotation table. Key columns:
Study_ID,Sample_ID,Phenotype(e.g., "Susceptible" vs. "Resilient"),Batch(original study),Sex,Platform. - Data Preprocessing:
- For Microarray Data: Download processed, normalized matrices from GEO. Apply cross-platform normalization (e.g., using
sva::ComBatorlimma::removeBatchEffect) when combining. - For RNA-seq Data: Download raw FASTQ from SRA. Re-process uniformly using a standardized pipeline (e.g.,
Salmonfor quantification ->tximport->DESeq2for normalization). This minimizes technical batch effects.
- For Microarray Data: Download processed, normalized matrices from GEO. Apply cross-platform normalization (e.g., using
Protocol 3.2: Meta-Analysis and Signature Validation Objective: To test if a candidate gene signature derived from a primary thesis study replicates across independent public datasets.
- Define Candidate Signature: From your primary thesis analysis, extract a gene list (e.g., 50 differentially expressed genes) with directionality (up/down) and effect size.
- Calculate Signature Score: In each validation dataset, compute a single-sample score (e.g., z-score averaged across signature genes) for each sample.
- Statistical Validation:
- Perform within-study analysis: Compare signature scores between behavioral conditions using a t-test/linear model within each independent study.
- Perform meta-analysis: Aggregate effect sizes (e.g., standardized mean difference) across all studies using a random-effects model (e.g.,
metaforR package). - Success Metric: Consistent direction of effect (p < 0.05) in >70% of studies and a significant summary effect size (p < 0.05) from the meta-analysis.
4. Visualizations
Diagram 1: Cross-Study Validation Workflow
Diagram 2: Meta-Analysis of Signature Effect Sizes
5. The Scientist's Toolkit
Table 3: Essential Research Reagent Solutions for Cross-Study Validation
| Tool/Resource | Category | Function in Protocol |
|---|---|---|
| GEO2R / GEQuery | Web Tool | Rapid initial screening and differential expression analysis of GEO datasets. |
| SRA Toolkit | Software | Command-line tools for downloading raw FASTQ files from the SRA. |
| Salmon + tximport | Bioinformatics Pipeline | Fast, alignment-free quantification of RNA-seq reads and import to R/Bioconductor. |
| DESeq2 / limma | R/Bioconductor Package | Normalization and differential expression analysis for RNA-seq or microarray data, respectively. |
| sva (ComBat) | R/Bioconductor Package | Empirical Bayes method to adjust for batch effects across combined studies. |
| metafor | R Package | Conducting random-effects meta-analysis of effect sizes across studies. |
| Synapse / zenodo | Data Sharing Platform | For publicly archiving the curated, harmonized dataset created by this protocol. |
Application Notes and Protocols
Thesis Context: Within a comprehensive thesis on RNA-seq experimental design for behavioral studies, robust bioinformatic analysis is critical. Moving from differentially expressed gene lists to biologically meaningful, behaviorally-relevant insights requires specialized pathway and network analysis. This document benchmarks current computational pipelines for this purpose, providing detailed protocols for their application in neurobehavioral research and drug discovery.
1. Quantitative Benchmarking of Core Tools
A live search for recent benchmarking studies (2023-2024) reveals performance metrics for key tools used in behavioral transcriptomics. The following table summarizes their characteristics and performance on simulated and real neuronal RNA-seq datasets.
Table 1: Benchmark of Pathway & Network Analysis Tools for Behavioral Transcriptomics
| Tool Name | Category | Core Algorithm | Input | Key Outputs | Speed (Benchmark) | Strengths for Behavioral Studies | Key Limitations |
|---|---|---|---|---|---|---|---|
| GSEA (v4.3.2) | Gene Set Enrichment | Kolmogorov-Smirnov statistic | Gene list + ranks | Enriched pathways, ES, FDR | Fast (<5 min) | Detects subtle, coordinated expression changes; well-curated neural pathways. | Less effective for small gene sets; requires pre-ranked list. |
| clusterProfiler (v4.10.0) | ORA & GSEA | Hypergeometric test / GSEA | Gene list | Enrichment plots, networks | Very Fast (<2 min) | Integrates ORA & GSEA; excellent visualization; supports many organisms. | Default pathways may lack behavioral specificity. |
| SPIA (v2.50.0) | Pathway Topology | Perturbation Accumulation | DE genes + stats | Perturbed pathways, p-values | Moderate (~10 min) | Incorporates pathway topology (activation/inhibition); yields directionality. | Smaller pathway database; computationally heavier. |
| CEMiTool (v1.24.0) | Co-expression Network | Correlation network analysis | Expression matrix | Gene modules, enrichments | Moderate (~15 min) | Identifies co-expression modules directly linked to traits (e.g., behavioral scores). | Requires sample-level data; sensitive to parameters. |
| WGCNA (v1.72-1) | Co-expression Network | Weighted correlation | Expression matrix | Signed networks, module-trait correlation | Slow (~60 min) | Robust module detection; direct correlation with phenotypic traits. | Computationally intensive; steep learning curve. |
| Enrichr (API) | Integrated Knowledge | Meta-analysis of ORA | Gene list | Combined scores from >100 libraries | Very Fast (<1 min) | Vast library collection (e.g., PsyGeNET, Kinase Perturbations). | Web interface limits batch analysis; less customizable. |
2. Detailed Experimental Protocols
Protocol 2.1: Integrated Pipeline for Stress Response Transcriptomics
- Aim: Identify key signaling pathways and regulatory networks from prefrontal cortex RNA-seq data of stressed vs. control rodents.
- Input: Count matrix from RNA-seq (e.g., Salmon output), sample metadata with behavioral phenotyping scores.
- Software: R (v4.3+), DESeq2, clusterProfiler, WGCNA, Cytoscape.
Reagents/Materials: See "The Scientist's Toolkit" below.
Step-by-Step:
- Differential Expression (DE): Perform DE analysis with DESeq2. Use adjusted p-value < 0.05 and |log2FoldChange| > 0.58 as primary filters. Output: ranked gene list.
- Pre-ranked GSEA: Run
gsea()from clusterProfiler using the C5 (GO) and C8 (cell type signature) collections from MSigDB, and the KEGG pathway database. Use 1000 permutations. - Over-Representation Analysis (ORA): For strong DEGs (adjusted p-value < 0.001), run ORA using the
enrichKEGG()andenrichGO()functions. SetqvalueCutoff = 0.05. - Co-expression Network Analysis: On variance-stabilized count data, run WGCNA:
- a. Check data for excessive missing values and outliers.
- b. Choose a soft-thresholding power (β) based on scale-free topology fit > 0.85.
- c. Construct adjacency matrix, create Topological Overlap Matrix (TOM), and perform hierarchical clustering to identify gene modules.
- d. Correlate module eigengenes with behavioral phenotype (e.g., "immobility time").
- e. Export the network for the highest-correlating module(s) to Cytoscape for visualization.
- Integration & Validation: Cross-reference top pathways from GSEA/ORA with genes from significant WGCNA modules. Prioritize pathways appearing across multiple methods.
Protocol 2.2: Topology-Based Analysis for Reward Circuitry
- Aim: Apply topology-aware pathway analysis to identify dysregulated signaling flows in addiction-related transcriptomics.
- Input: DE gene list with full statistics (p-value, log2FC).
- Software: R, SPIA, graphite package, pathview.
Reagents/Materials: See "The Scientist's Toolkit" below.
Step-by-Step:
- Data Preparation: Format DE results into a named vector of log2 fold changes, with Entrez Gene IDs as names.
- Pathway Preparation: Load the KEGG pathway collection for your organism (e.g.,
mmufor mouse) using thegraphitepackage. - Run SPIA: Execute the
spia()function with the following parameters:data = de_vector,organism = "mmu",beta = "log2FC",nB = 2000(permutations). Save thetA(perturbation accumulation) and p-value results. - Interpretation: Identify pathways with
pGFdr< 0.05 and|tA|> 0. A positivetAindicates net activation; negative indicates net inhibition. - Visualization: Use the
pathview()function to map the DE data onto the KEGG graph of the most significant pathway, generating a detailed, colored signaling map.
3. Mandatory Visualizations
Title: Behavioral Transcriptomics Analysis Workflow
Title: Stress-Activated Signaling Pathways in Behavior
4. The Scientist's Toolkit
Table 2: Essential Research Reagent Solutions for Behavioral Transcriptomics
| Item | Function & Relevance in Protocol |
|---|---|
| TRIzol Reagent / Qiazol | For simultaneous homogenization of brain tissue regions (e.g., prefrontal cortex, amygdala) and isolation of total RNA, including small RNAs. Essential for input material generation. |
| DNase I (RNase-free) | Critical for removing genomic DNA contamination from RNA samples prior to library preparation, ensuring accurate gene count quantification. |
| RNase Inhibitors | Protects RNA integrity during cDNA synthesis and library preparation steps, vital for preserving the true transcriptomic state at time of sacrifice. |
| mRNA Selection Beads | For poly-A selection of mRNA from total RNA, required for standard Illumina strand-specific library protocols. |
| Ultra II FS RNA Library Prep Kit | A common library preparation kit for constructing sequencing libraries from fragmented mRNA. Includes reagents for cDNA synthesis, end repair, and adapter ligation. |
| Unique Dual Index (UDI) Kits | Allows multiplexing of samples from different experimental groups (e.g., control, stressed, treated) in a single sequencing run, reducing batch effects. |
| SYBR Green qPCR Master Mix | For validating top differentially expressed genes identified in silico in independent biological samples. A cornerstone of pipeline validation. |
| RIPA Buffer + Protease Inhibitors | For parallel protein extraction from homogenized brain tissue aliquots, enabling western blot validation of key pathway proteins (e.g., p-CREB, BDNF). |
Conclusion
Designing a robust RNA-seq experiment for behavioral research requires meticulous planning at the intersection of neuroscience, statistics, and molecular biology. A successful study begins with a precisely defined behavioral phenotype and a model system capable of addressing it, followed by a rigorous experimental design that controls for inherent variability and confounding factors. The choice of tissue, timing, and sequencing technology must align with the core research question. While bioinformatics unlocks patterns in the data, validation through orthogonal molecular and functional assays is paramount to move from correlative transcript lists to causative mechanisms. Looking forward, the integration of RNA-seq with other omics technologies and advanced computational models promises to unravel the complex, multi-layered molecular networks that underlie behavior. This holistic approach will accelerate the translation of transcriptomic discoveries into novel biomarkers and therapeutic targets for neuropsychiatric and neurological disorders, bridging the gap between bench-side sequencing and bedside application.