Optimizing Evolutionary Algorithms for Advanced Protein Prediction: A Guide for Computational Biologists
This article provides a comprehensive guide for researchers and drug development professionals on optimizing evolutionary algorithm (EA) parameters to enhance protein prediction accuracy.
Optimizing Evolutionary Algorithms for Advanced Protein Prediction: A Guide for Computational Biologists
Abstract
This article provides a comprehensive guide for researchers and drug development professionals on optimizing evolutionary algorithm (EA) parameters to enhance protein prediction accuracy. It explores the foundational principles of EAs in structural bioinformatics, examines cutting-edge methodological applications from protein-ligand docking to inverse folding, and details systematic strategies for hyperparameter tuning and troubleshooting. By synthesizing recent advances and validating EA performance against other state-of-the-art methods, this review serves as a critical resource for improving computational efficiency and predictive power in protein science, with significant implications for accelerating drug discovery and biomedical research.
The Evolutionary Algorithm Blueprint for Protein Prediction
Proteins are dynamic entities that exist as ensembles of interconverting conformations, rather than single, static structures. These dynamic conformations are fundamental to their biological function, from enzymatic catalysis to signal transduction [1]. For researchers, the central challenge is efficiently navigating the vast, high-dimensional conformational space—the universe of all possible spatial arrangements of a protein's atoms—to identify biologically relevant structures. This space is astronomically large; a systematic search is computationally prohibitive [2]. Evolutionary Algorithms (EAs) offer a powerful, bio-inspired solution to this problem by mimicking natural selection to efficiently sample this landscape and locate low-energy, functional conformations.
FAQ: Understanding Evolutionary Algorithms in Protein Science
Q1: What are Evolutionary Algorithms, and why are they suited for protein conformation problems?
Evolutionary Algorithms (EAs) are a class of population-based, stochastic optimization techniques inspired by the principles of biological evolution. They are particularly suited for navigating protein conformational space because this problem is often NP-hard, meaning that finding an exact solution by brute-force calculation is computationally infeasible for all but the smallest proteins [3]. EAs handle this complexity by maintaining a diverse population of candidate conformations and using genetic operators like mutation and crossover to iteratively evolve this population towards regions of lower energy and higher biological relevance.
Q2: How do EAs handle the prediction of multiple conformational states, a key limitation of some AI methods?
While deep learning tools like AlphaFold have revolutionized static structure prediction, capturing multiple conformational states remains a challenge [1] [4]. EAs address this by simultaneously evolving multiple populations, each guided towards a different potential energy basin. For instance, the M-SADA algorithm uses a multiple population-based EA to sample distinct conformational states for multidomain proteins. It combines homologous and analogous templates with inter-domain distances predicted by deep learning, successfully assembling two highly distinct conformational states for 40.3% of tested proteins [5].
Q3: A common experimental issue is the algorithm getting trapped in local energy minima, yielding non-native structures. How can this be troubleshooted?
Stagnation in local minima often indicates a lack of genetic diversity or insufficient exploration pressure. The following strategies can mitigate this:
- Implement Diversity-Preserving Mechanisms: Introduce multi-objectivization, where sequence diversity itself is an explicit optimization goal alongside energy minimization. This helps the algorithm explore a wider region of sequence space, which can correlate with broader conformational sampling [6] [7].
- Employ Hybrid "Memetic" Operators: Combine global evolutionary search with local gradient-based minimization. This approach, as seen in the SIfTER algorithm, allows each candidate solution to fully relax into its nearest local minimum, providing a more accurate energy evaluation and preventing the population from being trapped in high-energy regions [8].
- Adjust Variation Operators: Design novel variation operators that are specifically tailored to protein geometry to ensure that newly generated conformations are physically plausible, thereby improving the efficiency of the search [9].
Q4: How can external biological knowledge be integrated to improve the accuracy of EA predictions?
Incorporating domain-specific knowledge significantly constrains the search space and enhances biological relevance. A key method is the use of a Functional Similarity-Based Protein Translocation Operator (FS-PTO). This mutation operator uses Gene Ontology (GO) annotations to probabilistically guide the search. Proteins with high functional similarity are more likely to be grouped together, steering the algorithm towards functionally coherent and thus more biologically plausible complexes [3]. Additionally, EAs can be initialized using experimentally determined structural fragments or templates to seed the population with promising starting conformations [8].
Experimental Protocols & Methodologies
Protocol 1: Multi-State Assembly of Multidomain Proteins using M-SADA
This protocol outlines the process for predicting multiple conformational states of a multidomain protein, as implemented in the M-SADA algorithm [5].
- Input Preparation: Gather the amino acid sequences and predicted individual domain structures (e.g., from AlphaFold2).
- Energy Function Construction: Build multiple knowledge-based energy functions by combining information from:
- Homologous Templates: Structures with high sequence similarity.
- Analogous Templates: Structures with low sequence similarity but high structural similarity.
- Predicted Inter-Domain Distances: From deep learning models.
- Multi-Population EA Initialization: Initialize separate populations for each targeted conformational state.
- Evolutionary Sampling:
- Crossover: Exchange structural domains or sub-structures between candidate solutions in the population.
- Mutation: Perturb domain orientations and linker conformations.
- Selection: Select candidates for the next generation based on a fitness function that includes the constructed energy terms and structural similarity metrics.
- Model Selection & Validation: Select final models from each population cluster based on lowest energy and highest confidence. Validate using metrics like TM-score (where a TM-score > 0.90 indicates a high-quality model).
Protocol 2: Mapping Mutation-Induced Landscape Changes with SIfTER
This protocol details how to map the conformational energy landscape of a protein and its mutants to understand functional changes, using the SIfTER algorithm [8].
- Data Curation: Collect all available experimental structures (from the PDB) for the wild-type and mutant protein sequences.
- Define Search Space: Use a dimensionality reduction technique (like Principal Component Analysis) on the collective experimental structures to identify the dominant reaction coordinates (modes of motion). This defines a reduced, biologically relevant search space.
- Conformational Sampling with EA:
- The population is initialized with the experimental structures.
- A memetic EA performs global sampling across the defined low-dimensional space.
- Each new conformation generated by the EA undergoes local energy minimization (a "memetic" step) using a physical or knowledge-based force field.
- Energy Landscape Reconstruction: Calculate the potential energy for each sampled conformation. Project these energies back onto the low-dimensional space to reconstruct a continuous energy landscape.
- Comparative Analysis: Juxtapose the landscapes of wild-type and mutant proteins. Differences in the depth, location, and connectivity of energy minima reveal the mechanistic impact of the mutation on protein function and dynamics.
Performance & Algorithm Comparison
The table below summarizes quantitative data and key characteristics of several evolutionary algorithms used in protein structure research.
Table 1: Comparison of Evolutionary Algorithms in Protein Research
| Algorithm Name | Primary Application | Key Features | Reported Performance / Output |
|---|---|---|---|
| M-SADA [5] | Multi-state multidomain protein assembly | Multi-population EA; Combines homologous/analogous templates & deep learning distances | 40.3% of proteins assembled with 2 distinct states (TM-score > 0.90); Best model TM-score 0.913 on 296 proteins. |
| SIfTER [8] | Mapping conformational landscapes of wild-type and mutant proteins | Memetic EA; Uses experimental structures to define search space; Multiscale optimization | Elucidated distinct activation mechanisms for H-Ras mutants G12V and Q61L by comparing energy landscapes. |
| USPEX [9] | De novo tertiary structure prediction | Global optimization with novel variation operators; Interfaces with Tinker & Rosetta for energy evaluation | Predicted structures with close or lower energy than Rosetta Abinitio for proteins up to 100 residues. |
| FS-PTO EA [3] | Detecting protein complexes in PPI networks | Multi-objective EA; Gene Ontology-based mutation operator (FS-PTO) | Outperformed state-of-the-art methods in identifying protein complexes, especially in noisy PPI networks. |
| EvoIF [7] | Protein fitness prediction (DMS assays) | Lightweight model; Integrates within-family (MSA) and cross-family (Inverse Folding) evolutionary profiles | State-of-the-art performance on ProteinGym (217 assays, >2.5M mutants) using only 0.15% of training data. |
The Scientist's Toolkit: Essential Research Reagents
Table 2: Key Databases and Software for EA-Driven Protein Research
| Resource Name | Type | Function in EA Workflow | Relevance |
|---|---|---|---|
| ATLAS [1] | Molecular Dynamics Database | Provides MD simulation trajectories for ~2000 proteins; used for initial sampling, validation, or constructing training sets. | Foundation for understanding dynamic conformations. |
| GPCRmd [1] | Specialized MD Database | Focuses on GPCR family; essential for studying dynamics of membrane proteins and drug target identification. | Provides specialized, high-quality conformational data. |
| PDB [1] [8] | Structural Database | Source of experimental structures for initializing EA populations and validating final predicted models. | The primary repository of ground-truth structural data. |
| Tinker / Rosetta [9] | Molecular Modeling Suite | Provides force fields and energy functions for relaxing candidate structures and evaluating their fitness within the EA. | Critical for the accurate energy evaluation of conformations. |
| Foldseek [7] | Structural Similarity Search | Used to find analogous templates (structural homologs) for constructing informed energy functions in methods like M-SADA. | Enables leverage of evolutionary information from structure. |
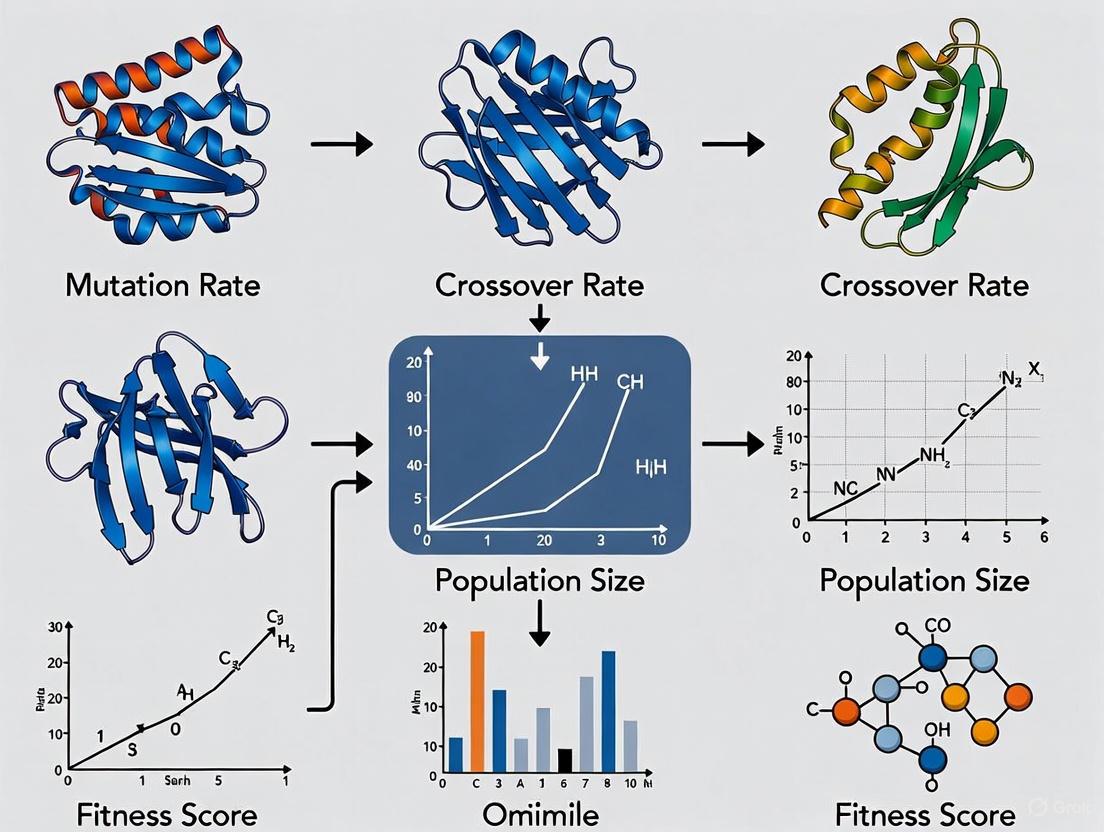
Core Workflow Visualization
The following diagram illustrates the generalized logic and workflow of an Evolutionary Algorithm applied to protein conformational sampling.
Troubleshooting Common Parameterization Issues
Optimizing EA parameters is critical for success. The table below lists common issues and evidence-based tuning strategies.
Table 3: Troubleshooting Guide for EA Parameter Optimization
| Problem | Potential Causes | Recommended Solutions & Parameter Adjustments |
|---|---|---|
| Premature Convergence | Population lacks diversity; selection pressure too high. | Increase population size. Introduce multi-objectivization (e.g., optimize for both energy and structural diversity) [6] [7]. Adjust selection operator to be less greedy. |
| Slow or Stalled Convergence | Poor exploration; inefficient variation operators. | Tune mutation rates (increase for more exploration). Design domain-specific variation operators for proteins [9]. Hybridize with local search (memetic algorithms) [8]. |
| Non-Biological or Clashing Structures | Energy function inaccuracies; unphysical moves. | Incorporate knowledge-based terms into the energy function. Use gradient-based local minimization (memetic) to relax structures [8]. Apply stricter constraints based on known structures. |
| Failure to Sample Multiple States | Search is biased towards a single, dominant energy minimum. | Implement multiple populations with different guidance [5]. Use niching techniques to maintain sub-populations in different regions of conformational space. |
Frequently Asked Questions (FAQs)
1. What are the core components of an Evolutionary Algorithm (EA) for protein modeling? An Evolutionary Algorithm for protein modeling is built on three core components: a population of candidate protein conformations, a fitness function that evaluates the energy or quality of each structure, and genetic operators (mutation and crossover) that explore the conformational space. The goal is to evolve the population towards low-energy, native-like structures through iterative application of selection, variation, and fitness evaluation [10] [11].
2. Which metaheuristics are most effective for navigating the vast protein conformational space? Several metaheuristics have proven effective for Protein Structure Prediction (PSP). Empirical analyses and benchmark studies highlight the following algorithms [10]:
- Genetic Algorithms (GA): Effective for sampling protein conformations by applying selection, crossover, and mutation to a population of structures.
- Particle Swarm Optimization (PSO): Useful for optimizing protein structures, with variants demonstrating success in multi-objective refinement by simultaneously optimizing different energy functions [11].
- Differential Evolution (DE): A robust and versatile optimizer for continuous parameter spaces, making it well-suited for refining atomic coordinates. It has been shown to outperform other EAs in many applications, including PSP [11].
3. How is fitness typically defined in protein structure refinement EAs? Fitness is most commonly defined using physics-based or knowledge-based energy functions. The central hypothesis is that the native protein conformation corresponds to the state with the lowest free energy.
- Full-Atom Energy Models: For detailed refinement, functions like the Rosetta
Ref2015score are used. This is a weighted sum of ~19 energy terms that capture interactions between non-bonded atom pairs, electrostatics, solvation, and torsional preferences [11]. - Multi-Objective Optimization: Some approaches use multiple fitness functions simultaneously. For example, a PSO-based refiner successfully optimized protein models by concurrently minimizing three different energy functions: RWplus, Rosetta, and CHARMM [11].
4. What are common challenges when applying EAs to protein modeling and how can they be troubleshooted?
- Challenge: Premature Convergence. The algorithm gets stuck in a local minimum, yielding a suboptimal protein structure.
- Troubleshooting: Increase population diversity by using a larger population size or implementing diversity-preservation mechanisms. Hybrid memetic algorithms that combine global search (like DE) with powerful local search (like the Rosetta Relax protocol) can more effectively escape local minima [11].
- Challenge: High Computational Cost. The evaluation of fitness functions for thousands of protein conformations is computationally intensive.
Experimental Protocols & Methodologies
Protocol 1: Memetic Algorithm for Protein Structure Refinement
This protocol combines Differential Evolution (DE) with the Rosetta Relax protocol for full-atom refinement of protein structures [11].
- Initialization: Generate an initial population of protein models. These can be output structures from deep learning predictors like AlphaFold2 or RoseTTAFold.
- Representation: Represent each protein conformation in full-atom detail, using Cartesian coordinates or dihedral angles.
- Fitness Evaluation: Calculate the fitness of each individual using the Rosetta
Ref2015full-atom energy function. - Differential Evolution Cycle:
- Mutation: For each target individual in the population, create a mutant vector by combining other randomly selected individuals.
- Crossover: Mix the parameters of the mutant vector with the target individual to produce a trial individual.
- Selection: Evaluate the fitness of the trial individual. If it is better than the target individual, it replaces the target in the next generation.
- Local Search (Memetic Component): Integrate the Rosetta Relax protocol into the DE cycle. This can be applied to every new individual, or to the best individuals after a set number of generations. Rosetta Relax performs local optimization of side-chain and backbone positions to minimize the energy.
- Termination: Repeat from step 3 until a convergence criterion is met (e.g., a maximum number of generations or no improvement in the best fitness).
Protocol 2: Multi-Objective Refinement using Particle Swarm Optimization
This protocol uses a decomposition-based multi-objective PSO to balance different energy functions [11].
- Problem Decomposition: Transform the multi-objective problem into a set of single-objective subproblems using a set of weight vectors. Each subproblem is a weighted sum of the three energy functions: RWplus, Rosetta, and CHARMM.
- Swarm Initialization: Initialize a swarm of particles, where each particle represents a protein conformation and is assigned to a specific subproblem.
- Fitness Evaluation: For each particle, compute the weighted sum of the three energy functions based on its assigned subproblem's weight vector.
- PSO Flight: Update the velocity and position of each particle based on its personal best position and the best position found in its neighborhood.
- Neighborhood Selection: The neighborhood for a particle is defined by the several closest weight vectors, promoting diversity.
- Termination: The swarm evolves until a maximum number of iterations is reached, providing a set of refined models that represent different trade-offs between the energy functions.
Quantitative Data on Algorithm Performance
Table 1: Summary of Metaheuristic Applications in Protein Modeling
| Metaheuristic Algorithm | Application Context | Reported Outcome | Key Reference |
|---|---|---|---|
| Differential Evolution (DE) | Full-atom structure refinement combined with Rosetta Relax (Memetic Algorithm) | Better sampling of the energy landscape and lower-energy conformations compared to Rosetta Relax alone in the same runtime. | [11] |
| Particle Swarm Optimization (PSO) | Multi-objective refinement using RWplus, Rosetta, and CHARMM energy functions | A decomposition-based version showed better diversity and convergence than a prior multi-objective version. | [11] |
| Genetic Algorithm (GA) | General Protein Structure Prediction (PSP) | Included among 15 metaheuristics shown to be effective for navigating the vast conformational space of proteins. | [10] |
Workflow Visualization
Research Reagent Solutions
Table 2: Key Software and Data Resources for EA-based Protein Modeling
| Resource Name | Type | Function in EA-based Modeling | |
|---|---|---|---|
| Rosetta Software Suite | Software Environment | Provides the fitness function (e.g., Ref2015 energy score) and local search protocols (e.g., Rosetta Relax) for full-atom refinement. | [11] |
| AlphaFold Protein Structure Database (AFDB) | Database | Source of high-quality initial protein models that can be used as starting points for the population in a refinement EA. | [12] |
| Protein Data Bank (PDB) | Database | Repository of experimentally solved protein structures used for validation, and for deriving knowledge-based energy terms for fitness functions. | [13] [11] |
| Foldseek | Software Tool | Enables fast, efficient structural comparisons and clustering, useful for analyzing population diversity or for structure-based fitness metrics. | [12] |
Frequently Asked Questions
Q1: What are the main computational models that use evolutionary information for protein design? Several powerful models leverage evolutionary data. Direct Coupling Analysis (DCA) uses a statistical energy model derived from Multiple Sequence Alignments (MSAs) to capture co-evolutionary signals and predict fitness. The model's evolutionary Hamiltonian energy correlates well with experimental protein stability [14]. Latent Space Models, trained using Variational Auto-Encoders (VAEs), project protein sequences into a continuous low-dimensional space. This representation captures evolutionary relationships and enables the learning of complex fitness landscapes, overcoming some limitations of DCA by modeling higher-order epistasis [15]. Finally, modern Protein Language Models (pLMs), trained via Masked Language Modeling (MLM), implicitly learn the fitness landscape. The log-odds scores they produce can be interpreted as fitness estimates, framing natural evolution as an implicit reward-maximization process [7].
Q2: Why might my designed protein sequences be unstable, even with a good fitness score? Instability can arise from several issues:
- Inadequate MSA Depth: The accuracy of models like DCA is highly dependent on the quantity and diversity of homologous sequences in the MSA. Performance deteriorates significantly with MSAs containing fewer than 30 homologs [16]. A shallow MSA fails to capture the necessary co-evolutionary constraints.
- Ignoring Key Contacts: Designs based solely on single-site amino acid propensities often fail because they miss critical epistatic (residue-residue) interactions. One study found that none of the 43 sequences designed using only single-site propensities for a WW domain folded correctly [14].
- Overlooking Structural Context: Modern predictors like AlphaFold and RoseTTAFold can struggle with proteins whose structures are dictated by interactions with other domains or ligands, or with intrinsically disordered regions. Always check the per-residue confidence (pLDDT) and predicted aligned error (PAE) to identify low-confidence, and potentially unstable, regions [16] [17].
Q3: How can I efficiently search ultra-large combinatorial chemical spaces for drug discovery? Exhaustive screening of billion-member libraries is computationally prohibitive. Evolutionary Algorithms (EAs) like REvoLd offer an efficient alternative by exploiting the combinatorial nature of "make-on-demand" libraries. Instead of docking every molecule, REvoLd uses an evolutionary protocol with selection, crossover, and mutation operators to iteratively optimize ligands within the RosettaLigand flexible docking framework. This approach can improve hit rates by factors of 869 to 1622 compared to random selection, exploring the space with only a few thousand docking calculations [18].
Q4: My evolutionary algorithm is converging too quickly to a suboptimal solution. How can I improve exploration? Premature convergence is a common challenge. Consider these strategies:
- Adaptive Genetic Operators: Instead of fixed crossover and mutation probabilities, implement operators that adapt based on an individual's performance. For example, probabilities can be adjusted according to non-dominated layer levels, granting superior individuals more genetic opportunities while maintaining diversity [19].
- Enhanced Mutation Steps: Introduce mutation steps that promote exploration. REvoLd, for instance, uses a mutation that switches single fragments to low-similarity alternatives, causing significant changes to small parts of otherwise promising molecules [18].
- Dynamic Scoring: Use a dynamic scoring mechanism for decision variables that is recalculated each iteration based on the current population's non-dominated layers, rather than relying on a static, initial score [19].
Troubleshooting Guides
Issue: Poor Correlation Between Predicted and Experimental Fitness
| Potential Cause | Diagnostic Steps | Recommended Solution |
|---|---|---|
| Low-quality MSA | Check the number of effective sequences in your MSA. | Use iterative search tools (e.g., Jackhmmer) to build a deeper, more diverse MSA. If homologs are scarce, consider latent space models or pLMs that leverage broader sequence context [14] [15] [7]. |
| Overfitting to phylogeny | DCA models can be inflated by indirect phylogenetic correlations instead of direct structural couplings [15]. | Ensure the DCA implementation includes pseudo-likelihood optimization to disentangle direct from indirect effects [14]. |
| Insufficient model complexity | The model may fail to capture higher-order epistasis critical for fitness. | Transition from a pairwise Potts model (DCA) to a more flexible latent space model (VAE) or a large pLM, which can capture higher-order interactions [15] [7]. |
Issue: Evolutionary Algorithm Fails to Find High-Fitness Sequences
| Potential Cause | Diagnostic Steps | Recommended Solution |
|---|---|---|
| Loss of population diversity | Monitor the genetic diversity of the population over generations. | Introduce a diversity penalty in the selection criteria. Implement mechanisms like the "second round of crossover and mutation" in REvoLd, which allows less-fit individuals a chance to improve and contribute genetic material [18]. |
| Inefficient genetic operators | Standard operators may not effectively explore the sparse sequence space. | For large-scale sparse problems, use algorithms like SparseEA-AGDS that employ adaptive genetic operators and dynamic scoring to focus search on the most promising decision variables [19]. |
| Rugged fitness landscape | The algorithm gets trapped in local optima. | Perform multiple independent runs with different random seeds. As with REvoLd, this strategy seeds different evolutionary paths and can unveil diverse high-scoring motifs [18]. |
Experimental Protocols & Data
Protocol 1: Designing Proteins Using a Co-evolutionary Fitness Landscape
This methodology uses DCA to guide Monte Carlo simulations for generating novel, stable protein sequences [14].
- Construct MSA: For your target wild-type sequence (e.g., PDB: 2FS1, 1PGA, 3THK), generate a deep Multiple Sequence Alignment using an iterative tool like Jackhmmer.
- Learn DCA Model: From the MSA, infer the parameters of the Potts model (single-site propensities
hi(X)and coupling parametersJij(X,Y)) using a pseudo-likelihood optimization procedure. - Define Evolutionary Energy: Calculate the Evolutionary Hamiltonian energy for a sequence
xasEEH(x) = -ln P(x), whereP(x)is the probability from the Potts model. - Run Monte Carlo Sampling:
- Start from a random or wild-type sequence.
- In each iteration, propose a mutation to a randomly chosen residue.
- Accept or reject the mutation based on the change in
EEHusing the Metropolis criterion. - To enhance sequence diversity, add a penalty term proportional to sequence similarity to the wild-type during sampling.
- Select Designs: Choose final sequences based on low
EEH, low sequence identity to wild-type (<50-80%), and low pairwise identity between designs (<85%).
The workflow for this protocol is summarized in the diagram below:
Protocol 2: Integrating Evolutionary Profiles for Fitness Prediction (EvoIF)
The EvoIF framework integrates multiple evolutionary signals for accurate, data-efficient fitness prediction [7].
- Input Representation: For a wild-type sequence and its structure, generate the mutant sequence, assuming the backbone structure remains unchanged.
- Extract Within-Family Profile: Perform a sequence similarity search (e.g., with BLAST) or a structure similarity search (e.g., with Foldseek) to retrieve homologous sequences. Use these to build a Multiple Sequence Alignment and create an evolutionary profile.
- Extract Cross-Family Profile: Pass the protein structure through a pre-trained Inverse Folding model (e.g., ProteinMPNN) to obtain likelihoods for all possible amino acids at each position. This provides a structural-evolutionary profile.
- Model Fusion: Input the sequence and structure into a lightweight neural network backbone. Fuse the within-family and cross-family evolutionary profiles via a compact transition block.
- Fitness Prediction: Use the fused model to calculate log-odds scores, which serve as the fitness estimate for the mutant.
Quantitative Data from Co-evolutionary Design
The table below shows experimental results for proteins designed using the co-evolutionary fitness landscape (DCA) method, demonstrating that sequences with lower evolutionary energy (EEH) generally have higher stability [14].
| Protein & Variant | Sequence Identity to WT (%) | Evolutionary Energy (EEH) in kBT | Melting Temp. (Tm) °C |
|---|---|---|---|
| GA WT (2fs1) | 100% | -127.1 | 86 |
| GA Seq1 | 79% | -129.0 | 86 |
| GA Seq2 | 54% | -117.0 | 63 |
| GA Seq3 | 50% | -114.7 | 73 |
| GA Seq5 | 50% | -111.5 | 59 |
| GB WT (1pga) | 100% | -106.5 | 77 |
| GB Seq1 | 75% | -94.2 | 73 |
| GB Seq2 | 75% | -93.9 | 75 |
| SH3 WT (3thk) | 100% | -72.3 | 70 |
| SH3 Seq1 | 45% | -96.4 | 64 |
| SH3 Seq3 | 48% | -97.9 | 63 |
The Scientist's Toolkit
| Research Reagent / Tool | Function in Research |
|---|---|
| Jackhmmer [14] | An iterative sequence search tool used to build deep and diverse Multiple Sequence Alignments (MSAs) from a query sequence, which is fundamental for DCA and other co-evolutionary analyses. |
| Direct Coupling Analysis (DCA) [14] [15] | A computational method that analyzes MSAs to infer direct, epistatic interactions between amino acid residues. It is used to build statistical fitness landscapes for protein design and contact prediction. |
| Variational Auto-Encoder (VAE) [15] | A deep learning architecture used to learn a continuous, low-dimensional latent space representation of protein sequences. This latent space captures evolutionary relationships and complex fitness landscapes. |
| RosettaLigand [18] | A flexible molecular docking protocol within the Rosetta software suite that allows for full ligand and receptor flexibility, used for accurate binding affinity predictions in virtual screening. |
| Inverse Folding Models (e.g., ProteinMPNN) [7] | Models that predict amino acid sequences compatible with a given protein backbone structure. They provide cross-family structural-evolutionary constraints for fitness prediction. |
| Evolutionary Algorithm Frameworks (e.g., REvoLd, SparseEA-AGDS) [19] [18] | Software implementations of evolutionary algorithms tailored for specific search spaces, such as ultra-large chemical libraries or large-scale sparse protein sequences, enabling efficient optimization. |
Frequently Asked Questions (FAQs)
1. What is the fundamental difference between using energy minimization and structural accuracy as an optimization goal?
Energy minimization approaches operate on Anfinsen's dogma, which states that a protein's native structure corresponds to its thermodynamic ground state—the conformation with the lowest Gibbs free energy [20]. Methods like the Rosetta ab initio protocol use search algorithms guided by a physics-based energy function to find this state [20]. In contrast, structural accuracy goals, often pursued by deep learning methods like AlphaFold2, aim to directly predict a structure that is as close as possible to the experimentally resolved native structure, typically using learned patterns from known structures [20].
2. My energy-minimized models have low energy scores but poor structural accuracy when compared to the native fold. What could be wrong?
This is a common issue indicating a potential problem with the energy function or the search algorithm's ability to escape local minima. The force field might be inaccurate or incomplete, failing to properly balance different energy terms (e.g., van der Waals, electrostatics, solvation) [20] [21]. Furthermore, the high-dimensional energy landscape of proteins is fraught with local minima, and the search algorithm may have become trapped in one that does not correspond to the global minimum (the native state) [20]. You may need to refine your force field weights or incorporate more sophisticated search strategies, like memetic algorithms that combine global and local search [20].
3. How can I improve the physical realism and structural accuracy of a low-resolution model generated by an evolutionary algorithm?
A two-step refinement protocol is often effective. First, rebuild the main-chain atoms from your Cα trace using a knowledge-based look-up table to ensure proper backbone geometry. Second, add side-chain atoms from a rotamer library and perform a full-atomic energy minimization using a composite physics- and knowledge-based force field. This process optimizes both global topology and local atomic geometry, addressing issues like unphysical bond lengths, angles, and steric clashes [21]. Tools like ModRefiner are designed specifically for this purpose [21].
4. For predicting protein complexes, what specific challenges should I consider when defining the optimization goal?
Predicting complexes introduces the critical challenge of accurately modeling inter-chain interactions alongside intra-chain folding. Relying solely on sequence-based co-evolutionary signals can be insufficient for complexes like antibody-antigen pairs, where such signals may be weak or absent [22]. Your optimization goal must therefore incorporate structural complementarity between chains. Advanced methods now use deep learning to predict interaction probability and structural similarity from sequence, which helps construct better paired multiple sequence alignments for significantly improved complex structure prediction [22].
Troubleshooting Guides
Problem: Inconsistent Performance of Evolutionary Algorithm
- Symptoms: The algorithm converges to different structures with varying energy levels and accuracies across multiple runs on the same protein sequence.
- Possible Causes:
- Poor Parameter Tuning: The parameters for the evolutionary algorithm (e.g., mutation rate, crossover rate, population size) are not optimal for the protein's conformational landscape [20] [3].
- Insufficient Diversity: The population converges prematurely to a local minimum, lacking the genetic diversity to explore the search space effectively [20].
- Solutions:
- Implement Niching: Introduce a crowding method or other niching technique to maintain population diversity and explore multiple minima simultaneously [20].
- Adopt a Memetic Strategy: Hybridize your global evolutionary search with a local search operator. For example, combine Differential Evolution with the Rosetta fragment replacement technique to refine trial solutions, leading to more consistent convergence to low-energy states [20].
- Leverage Biological Knowledge: Incorporate a domain-specific mutation operator. For instance, in protein complex detection, a Gene Ontology-based mutation operator can translocate proteins based on functional similarity, guiding the search more effectively [3].
Problem: High-RMSD in Refined Models
- Symptoms: After full-atom refinement, your model has a high Root-Mean-Square Deviation (RMSD) from the experimental reference structure, despite a good energy score.
- Possible Causes:
- Over-Relaxation: The refinement process may over-optimize the local physical geometry, causing the model to drift away from the correct global topology [21].
- Inadequate Restraints: The energy function used during refinement may lack sufficient long-range or global restraints to maintain the overall fold.
- Solutions:
- Use Multi-Source Restraints: During refinement, include a spatial restraint term in your energy function. This term should penalize deviations from the pairwise Cα distances in your initial, globally correct model [21].
- Two-Step Energy Minimization: Employ a protocol like that in ModRefiner, which first focuses on building a physically plausible backbone while keeping Cα positions restrained, and then refines side-chain rotamers and backbone atoms together [21].
Experimental Protocols & Data
Table 1: Key Metrics for Evaluating Optimization Goals
| Metric | Measures | Ideal For Goal | Tool / Method |
|---|---|---|---|
| Rosetta Score | Weighted sum of energy terms (steric clash, van der Waals, H-bonding, etc.) | Energy Minimization | Rosetta Software Suite [20] |
| Root-Mean-Square Deviation (RMSD) | Average distance between atoms of superimposed structures | Structural Accuracy | Pymol, MODELLER |
| Template Modeling Score (TM-Score) | Global topological similarity (scale 0-1; >0.5 same fold) | Structural Accuracy | TM-score program |
| Global Distance Test (GDT-TS) | Percentage of Cα atoms within a threshold distance of native structure | Structural Accuracy | CASP assessment |
| Steric Clash Score | Number of atom pairs closer than sum of van der Waals radii | Physical Realism | MolProbity, ModRefiner [21] |
| Ramachandran Outliers | Percentage of residues in disallowed backbone torsion regions | Physical Realism | MolProbity, PROCHECK |
Protocol: Memetic Algorithm for Protein Structure Prediction
This protocol outlines a hybrid approach combining Differential Evolution (DE) with the Rosetta fragment replacement technique, as described by Varela and Santos [20].
Initialization:
- Representation: Encode a protein conformation in each individual of the population using a coarse-grained model (e.g., dihedral angles φ and ψ for each residue).
- Population Seeding: Generate the initial population by running the first stage of the Rosetta ab initio protocol to create partially folded and diverse starting conformations.
Evolutionary Cycle:
- Differential Evolution: For each generation, create new trial vectors (conformations) through DE operations of mutation and crossover.
- Mutation: For a target vector ( \vec{x}i ), generate a mutant vector ( \vec{v}i ) using: ( \vec{v}i = \vec{x}{r1} + F \cdot (\vec{x}{r2} - \vec{x}{r3}) ) where ( \vec{x}{r1}, \vec{x}{r2}, \vec{x}{r3} ) are three distinct randomly selected population members, and ( F ) is a scaling factor.
- Crossover: Create a trial vector ( \vec{u}i ) by mixing parameters from the target vector ( \vec{x}i ) and the mutant vector ( \vec{v}i ) based on a crossover probability.
- Differential Evolution: For each generation, create new trial vectors (conformations) through DE operations of mutation and crossover.
Local Search (Fragment Replacement):
- Apply the Rosetta fragment replacement technique as a local search operator to both the newly created trial vector ( \vec{u}_i ) and the existing population.
- For a segment of the protein, select a small fragment (3-9 residues) from a library of resolved structures based on sequence similarity.
- Use the Metropolis criterion to decide whether to replace the current conformational angles with the fragment's angles. Always accept changes that lower the energy, and occasionally accept those that increase it to escape local minima [20].
Selection:
- Evaluate the fitness (e.g., Rosetta score) of the refined trial vector ( \vec{u}_i ).
- If the trial vector has a better (lower) energy than the target vector, it replaces the target vector in the next generation.
Multi-Stage Fitness Evaluation:
- Run the evolutionary process for a series of stages (e.g., three stages). In each stage, use a progressively more detailed Rosetta score function that incorporates additional energy terms, guiding the population toward a physically realistic and low-energy conformation [20].
Workflow Visualization
Decision Workflow: Energy Minimization vs. Structural Accuracy
The Scientist's Toolkit: Research Reagent Solutions
Table 2: Essential Software and Databases for Protein Prediction Research
| Item | Type | Function / Application |
|---|---|---|
| Rosetta | Software Suite | A comprehensive platform for macromolecular modeling. Used for ab initio structure prediction, docking, and design via energy minimization protocols [20]. |
| AlphaFold-Multimer | Software / Algorithm | A deep learning method specifically designed for predicting the 3D structures of protein complexes, extending the capabilities of AlphaFold2 [22]. |
| ModRefiner | Software Algorithm | A program for constructing and refining full-atom protein structures from Cα traces using a two-step, atomic-level energy minimization to improve physical realism [21]. |
| PDB (Protein Data Bank) | Database | The single worldwide archive of experimental structural data of biological macromolecules. Used for templates, fragment libraries, and method benchmarking [21]. |
| UniProt/UniRef | Database | A comprehensive resource for protein sequence and functional information. Used for constructing deep multiple sequence alignments (MSAs) critical for deep learning methods [22]. |
| CASP Results | Benchmark Dataset | Data from the Critical Assessment of protein Structure Prediction, the community-wide experiment to assess the state of the art in structure prediction. Essential for method comparison [20]. |
Advanced EA Implementations in Modern Protein Science
Ultra-Large Library Screening with REvoLd for Drug Discovery
REvoLd Technical Support Center
This guide provides solutions to common technical and methodological challenges researchers may encounter when using the RosettaEvolutionaryLigand (REvoLd) algorithm for ultra-large library screening in drug discovery projects.
Frequently Asked Questions (FAQs)
Q1: My REvoLd runs converge too quickly on suboptimal molecules. How can I improve the exploration of the chemical space? A1: This is often caused by excessive selective pressure. To promote diversity:
- Modify Selection Pressure: Introduce non-deterministic selectors. The
TournamentSelectororRouletteSelectorcan allow worse-scoring individuals a chance to reproduce, helping the algorithm escape local minima [23]. - Increase Crossover Rate: Boost the number of crossovers between fit molecules to enforce more variance and recombination of promising ligand scaffolds [18].
- Utilize Mutation Steps: Implement the low-similarity fragment mutation, which keeps well-performing parts of a molecule intact but makes significant changes to small parts, and the reaction-switching mutation, which explores different combinatorial reaction groups [18].
Q2: How should I configure the initial population size and number of generations for a typical screen? A2: Based on benchmark studies, the following parameters provide a good balance between efficiency and exploration [18]:
- Initial Population Size: 200 randomly created ligands. This provides sufficient variety to initiate the optimization process without excessive runtime costs.
- Generations: 30 generations of optimization. Good solutions often appear after ~15 generations, but discovery rates typically flatten around generation 30.
- Population Carryover: Allowing 50 individuals to advance to the next generation performs best, balancing effectiveness and noise reduction.
Q3: The algorithm is not finding the absolute best-scoring molecule in my defined space. Is this a flaw? A3: No, this is expected and often desirable behavior. REvoLd is a meta-heuristic designed to find numerous promising compounds rather than a single global optimum. The "rugged" scoring landscape can trap runs in local minima, which in practice enriches for a diverse set of viable hit candidates for further experimental testing [18].
Q4: What is the best strategy to obtain a large and diverse set of hits? A4: Instead of running one optimization for a very long time, perform multiple independent runs [18]. Each run, seeded with a different random starting population, will likely converge on different high-scoring molecular motifs, thereby uncovering a broader range of chemical scaffolds.
Troubleshooting Guide
| Problem | Potential Cause | Solution |
|---|---|---|
| Poor enrichment in final generation | Initial population is too small or homogeneous. | Increase the initial population size from 200 to a larger number to capture more starting diversity [18]. |
| Low diversity among top hits | Over-reliance on the ElitistSelector or insufficient mutation. |
Incorporate the TournamentSelector and increase the frequency of the low-similarity fragment mutation step [18] [23]. |
| Algorithm fails to improve fitness over generations | Reproduction steps are not creating meaningful variants. | Enable a second round of crossover and mutation that includes lower-fitness individuals to help refine them [18]. |
| High computational time per docking evaluation | Using the full RosettaLigand protocol with 150 complexes per molecule by default. | For initial screening, consider reducing the number of generated complexes per molecule, though this may affect scoring accuracy [23]. |
Key Experimental Protocols and Workflows
Standard REvoLd Screening Protocol
The following workflow outlines a standard procedure for a REvoLd screening campaign against a specific protein target [18] [23] [24].
1. Target Preparation
- Structure Refinement: Refine the target protein structure using molecular dynamics (MD) simulations to account for flexibility and generate a more physiologically relevant model [24].
- Binding Site Identification: Perform blind docking across the protein surface to identify potential binding pockets if the active site is not known [24].
2. REvoLd Configuration and Execution
- Define Chemical Space: Specify the make-on-demand library (e.g., Enamine REAL space) by providing the required reaction and fragment list files [23].
- Set Evolutionary Parameters:
- Population size: 200
- Generations: 30
- Individuals advancing: 50
- Use a combination of selection operators (Elitist, Tournament) and mutation operators (fragment swap, reaction change) [18].
- Run Optimization: Execute multiple independent REvoLd runs to maximize scaffold diversity.
3. Hit Analysis and Expansion
- Cluster and Select: Manually select top-scoring molecules from the final generations, prioritizing diverse chemotypes [24].
- Derivative Screening: Use identified hit compounds as input for a subsequent round of REvoLd to sample analogous regions of the chemical space for improved derivatives [24].
Performance Benchmarking Data
The table below summarizes the documented performance of REvoLd on five different drug targets, demonstrating its strong enrichment capabilities [18] [23].
| Performance Metric | Result / Value | Experimental Context |
|---|---|---|
| Hit Rate Improvement | 869 to 1,622 times random selection | Benchmark against five drug targets [18] [23]. |
| Total Molecules Docked per Target | ~49,000 to ~76,000 | Sum of unique molecules docked across 20 independent runs per target [18]. |
| Typical Runtime | 15-30 generations for convergence | Good solutions often emerge within 15 generations, with discovery rates flattening around 30 [18]. |
Workflow Diagram: REvoLd Algorithm
The diagram below illustrates the core iterative cycle of the REvoLd evolutionary algorithm.
The Scientist's Toolkit: Essential Research Reagents & Materials
The table below lists key resources required to implement a REvoLd-based screening campaign.
| Item | Function / Description | Relevance to Experiment |
|---|---|---|
| Make-on-Demand Library (e.g., Enamine REAL) | Defines the synthetically accessible chemical space of fragments and reactions for REvoLd to explore. | Core component. The algorithm's reproduction steps are strictly confined to molecules enumerable from this library [18] [23]. |
| Rosetta Software Suite | Provides the REvoLd application and the underlying RosettaLigand docking protocol. | Essential software platform. Required for running the evolutionary algorithm and performing flexible protein-ligand docking [18] [25]. |
| Prepared Protein Structure (PDB file) | The 3D structure of the drug target, ideally refined via MD simulations. | The target for docking. Structure quality and conformational relevance are critical for predicting valid binding poses [24]. |
| High-Performance Computing (HPC) Cluster | A computing environment with many CPUs/cores. | Necessary for practical runtime. Docking thousands of molecules with full flexibility is computationally intensive [18]. |
Multi-Objective EAs for Complex Detection in PPI Networks
Frequently Asked Questions (FAQs)
FAQ 1: What are the primary advantages of using a Multi-Objective Evolutionary Algorithm (MOEA) over single-objective approaches for protein complex detection?
Single-objective optimization methods often rely on a single fitness function, such as network density, which can overlook biologically significant but topologically sparse complexes [26]. MOEA frameworks address this by simultaneously optimizing multiple, often conflicting, objectives. This typically includes:
- Topological Objectives: Such as maximizing the internal density of a cluster or the closeness centrality of its nodes [27].
- Biological Objectives: Such as maximizing the functional similarity of proteins within a cluster, often measured using Gene Ontology (GO) semantic similarity [28] [27]. This multi-faceted approach allows MOEAs to identify complexes that are not only densely connected but also functionally coherent, leading to more biologically relevant predictions [28].
FAQ 2: How can I incorporate biological knowledge, like Gene Ontology, into my MOEA to improve the quality of predicted complexes?
A highly effective method is to integrate GO knowledge directly into the evolutionary operators of the algorithm. For instance, you can design a Functional Similarity-Based Protein Translocation Operator (a specialized mutation operator) that guides the search based on GO semantic similarity [28]. This operator promotes the grouping of proteins with high functional similarity, enhancing the biological coherence of the detected complexes. The GO-based semantic similarity serves as a key objective function, ensuring that proteins within a predicted complex share common biological functions [27].
FAQ 3: My PPI network data is known to be noisy, with both false positive and false negative interactions. How can I make my MOEA more robust to such noise?
MOEAs can be evaluated for robustness by testing them on artificially perturbed networks. The following table summarizes a protocol for such an evaluation, demonstrating that algorithms incorporating biological knowledge (e.g., GO similarity) maintain higher performance under noise [28]:
Table: Evaluating MOEA Robustness to Network Noise
| Noise Introduction | Evaluation Method | Expected Outcome for a Robust MOEA |
|---|---|---|
| Randomly remove a percentage of edges (simulate false negatives) [28]. | Compare the quality (e.g., F1-score) of complexes detected from the original and perturbed networks against a gold-standard dataset [28]. | Performance metrics remain relatively stable or degrade less significantly compared to methods that rely solely on topology. |
| Randomly add a percentage of non-existent edges (simulate false positives) [28]. | As above. | The algorithm can still recover true complexes, as biological objectives help to filter out spurious connections. |
FAQ 4: What are the key metrics and benchmarks I should use to validate the protein complexes predicted by my MOEA?
Validation should be performed against known reference complexes from databases like the Munich Information Center for Protein Sequences (MIPS) or the Saccharomyces Genome Database (SGD) [28] [26]. Common performance metrics include:
- Maximum Matching Ratio (MMR): Measures the best one-to-one mapping between predicted and reference complexes [26].
- F1-Score: The harmonic mean of precision (fraction of predicted complexes that match real ones) and recall (fraction of real complexes that are matched) [26].
- Geometric Accuracy (Acc): A composite measure that considers both the correctness and completeness of the prediction [26].
FAQ 5: My MOEA is computationally expensive on large human PPI networks. What strategies can I use to improve its efficiency?
To enhance efficiency, consider the following:
- Heuristic Initialization: Initialize the population with densely connected subgraphs or biclusters from the network's adjacency matrix instead of purely random individuals, giving the algorithm a better starting point [27].
- Objective Function Selection: Choose objective functions that are informative but computationally less intensive. For example, using a combination of internal density and a GO-based similarity measure has proven effective [27].
- Fitness Evaluation Optimization: Focus on optimizing the calculation of the most expensive objectives, such as pre-computing GO semantic similarities where possible.
Troubleshooting Guides
Issue 1: The algorithm converges to solutions that are topologically dense but lack functional coherence.
- Problem: The topological objectives are dominating the search, overpowering the biological objectives.
- Solution:
- Review Objective Functions: Ensure your biological objective (e.g., average GO semantic similarity within a cluster) is properly formulated and its value range is comparable to that of your topological objectives.
- Adjust Operator Bias: Increase the influence of biological knowledge in your evolutionary operators. Implement or strengthen a mutation operator that translocates proteins based on their functional similarity to the core of a cluster [28].
- Parameter Tuning: Adjust the weights or ranks in the multi-objective selection process to give higher priority to the biological coherence of clusters.
Issue 2: Poor overlap between predicted complexes and known reference complexes.
- Problem: The predicted complexes do not match the gold-standard data well, as measured by low precision or recall.
- Solution:
- Verify Data Preprocessing: Ensure your PPI network is properly filtered. Use functional similarity scores (e.g., TCSS) to remove interactions with low reliability [26].
- Incorporate Contrast Patterns: Use a supervised approach to discover "emerging patterns" – combinations of topological features that sharply distinguish true complexes from random subgraphs. An integrative score based on these patterns can then guide the complex detection process, improving accuracy [26].
- Benchmark Against Multiple Methods: Compare your results not just against one, but several state-of-the-art methods (e.g., MCODE, MCL, ClusterONE) to identify specific weaknesses in your approach [28] [26].
Issue 3: High computational time required for fitness evaluation, especially with GO semantic similarity.
- Problem: Calculating semantic similarity for all protein pairs in a large population is a performance bottleneck.
- Solution:
- Pre-computation: Pre-compute the GO semantic similarity for all protein pairs in the entire PPI network before starting the evolutionary algorithm. Store the results in a lookup table for fast retrieval during fitness evaluation.
- Approximate Measures: For very large networks, consider using faster, approximate measures of functional similarity.
- Parallelization: Design your fitness evaluation function to be parallelized, as calculating the fitness of individuals in a population is an embarrassingly parallel task.
Experimental Protocols & Workflows
Protocol 1: Standard Workflow for a Multi-Objective EA in Complex Detection
The following diagram illustrates the core workflow of a typical MOEA for protein complex detection.
MOEA for Complex Detection Workflow
Protocol 2: Validation and Robustness Testing Protocol
This protocol outlines the steps for rigorously validating predicted complexes and testing the algorithm's robustness to noise, a critical step for benchmarking against other methods [28] [26].
Table: Key Parameters for Robustness Evaluation
| Parameter | Description | Typical Values / Method |
|---|---|---|
| Gold-Standard Datasets | Known protein complexes used for validation. | MIPS catalog, SGD complexes [28] [26]. |
| Performance Metrics | Quantitative measures for comparing predicted and known complexes. | Maximum Matching Ratio (MMR), F1-Score, Geometric Accuracy (Acc) [26]. |
| Noise Simulation | Method to artificially corrupt the PPI network. | Randomly remove 5-20% of edges (false negatives); Randomly add 5-20% of non-existent edges (false positives) [28]. |
| Comparison Algorithms | Other complex detection methods used for benchmarking. | MCODE, MCL, ClusterONE, CMC, RNSC [26] [27]. |
Complex Validation and Benchmarking Process
The Scientist's Toolkit: Research Reagent Solutions
Table: Essential Resources for MOEA-based Protein Complex Detection Research
| Resource / Reagent | Type | Function in Research | Example Sources / Tools |
|---|---|---|---|
| PPI Network Data | Data | The primary input data representing protein interactions as a graph. | HPRD, DIP, STRING [27] [26] [29]. |
| Gold-Standard Complexes | Data | A curated set of known complexes used for training (in supervised methods) and validation. | MIPS complex catalogue, SGD [28] [26]. |
| Gene Ontology (GO) Database | Data | Provides functional annotations for proteins; used for calculating semantic similarity. | Gene Ontology Consortium [28] [27]. |
| GO Semantic Similarity Measure | Algorithm | Quantifies the functional similarity between two proteins based on their GO annotations. | Relevance measure [27]. |
| Multi-Objective Evolutionary Algorithm | Algorithm | The core optimization framework for detecting complexes. | NSGA-II [27]. |
| Complex Validation Metrics | Metric | Quantitative measures to assess the quality of predicted complexes. | Maximum Matching Ratio (MMR), F1-Score, Geometric Accuracy [26]. |
| Benchmarking Algorithms | Software | Other complex detection methods used for performance comparison. | MCODE, MCL, ClusterONE, CMC [26] [27]. |
This technical support center provides guidance for researchers implementing a Memetic Algorithm (MA) that combines Differential Evolution (DE) with the Rosetta Relax protocol for protein structure refinement. This hybrid approach addresses a critical step in computational biology: improving the quality of initial protein structure models (e.g., from deep learning tools like AlphaFold2) by optimizing the positions of amino acid atoms to resolve atomic collisions and achieve lower-energy, more biologically accurate conformations [11] [30]. The process is framed as a complex optimization problem within a vast conformational space, where the MA aims to synergistically combine DE's global search capabilities with Rosetta Relax's potent local exploitation of problem-specific knowledge [11] [31].
The following diagram illustrates the high-level workflow and logical relationship between the core components of the Relax-DE algorithm.
Frequently Asked Questions (FAQs) and Troubleshooting Guides
FAQ 1: What is the core advantage of this memetic approach over using Rosetta Relax alone?
The primary advantage is more effective sampling of the protein energy landscape. While Rosetta Relax is a powerful local search heuristic, embedding it within the Differential Evolution framework provides a robust global search strategy. This combination helps avoid getting trapped in local energy minima and explores a wider range of low-energy conformations. Empirical results demonstrate that this memetic approach can obtain better energy-optimized refined structures within the same runtime compared to the standard Rosetta Relax protocol [11] [30].
FAQ 2: My refinement process is not converging to lower-energy structures. What could be wrong?
Poor convergence often stems from an imbalance between global exploration (DE) and local exploitation (Rosetta Relax). Use the table below to diagnose and troubleshoot common convergence issues.
Table: Troubleshooting Guide for Convergence and Performance Issues
| Problem | Potential Causes | Recommended Solutions |
|---|---|---|
| Stagnation in Early Generations | DE parameters too aggressive, causing loss of diversity. | Reduce the differential weight (F parameter) to ~0.5; increase population size. |
| No Improvement Despite Sampling | Ineffective local search; Rosetta Relax not adequately refining individuals. | Increase the number of minimization cycles within the Rosetta Relax protocol. |
| Excessive Runtime | Rosetta Relax is computationally expensive, limiting the number of DE generations. | Apply the local Rosetta Relax operator selectively, not to every individual in the DE population [11]. |
| Structurally Unreasonable Output | Energy function may be dominated by a single term (e.g., fa_rep for atomic clashes). |
Ensure the full Rosetta Ref2015 energy function with all 19 weighted terms is used for a balanced physical and knowledge-based potential [11]. |
FAQ 3: How do I integrate the Rosetta Relax protocol into the Differential Evolution loop?
Rosetta Relax acts as a local search operator applied to individuals (protein conformations) within the DE population. A standard practice is to apply it to the best-performing individuals after each generation or to a subset of offspring before selection. The key is to use Rosetta Relax to "polish" the structures found by DE, driving them to the nearest local minimum on the energy landscape, which is defined by the Rosetta Ref2015 all-atom energy function [11].
FAQ 4: Are there alternative memetic or evolutionary approaches for refinement in Rosetta?
Yes, the IterativeHybridize protocol is another genetic-algorithm-inspired refinement method available within Rosetta. While the Relax-DE method uses DE as its global sampler, IterativeHybridize uses a different selection and sampling strategy, with its HybridizeMover as the core structural operator for crossover and mutation. It also incorporates concepts from Conformational Space Annealing (CSA) to manage structural diversity [32]. Comparing the performance of your Relax-DE implementation against IterativeHybridize on your target proteins is an excellent validation step [32].
The following workflow provides a detailed, step-by-step methodology for implementing the core Relax-DE experiment as described in the primary literature [11].
The Scientist's Toolkit: Research Reagent Solutions
This table details the essential software tools, libraries, and data required to implement and run the Relax-DE protein structure refinement protocol.
Table: Essential Research Reagents and Resources
| Item Name | Type | Function/Purpose | Acquisition/Usage Notes |
|---|---|---|---|
| Rosetta Software Suite | Software Environment | Provides the Rosetta Relax protocol and the Ref2015 full-atom energy function for local minimization and scoring [11] [32]. | Licensed from the University of Washington; required for the local search component. |
| Differential Evolution Library | Algorithmic Code | Implements the global search operations (mutation, crossover, selection). | Can be implemented from scratch (e.g., Python, C++) or using libraries like SciPy. |
| Initial Structural Models | Data | The starting 3D protein models to be refined. | Often generated by AI predictors like AlphaFold2 or RoseTTAFold [11] [33]. |
| Protein Data Bank (PDB) | Database | Source of experimentally-solved "native" structures for benchmarking and validating refinement performance [11] [13]. | Publicly available; used to calculate metrics like GDT-TS or RMSD. |
| Fragment Libraries | Data | Used by some Rosetta protocols for conformational sampling [32]. | Generated for a target sequence using the Rosetta fragment_picker application [32]. |
Frequently Asked Questions (FAQs)
Q1: What is the primary advantage of using Evolutionary Algorithms (EAs) for the Inverse Protein Folding Problem (IFP)?
Evolutionary Algorithms (EAs), particularly Multi-Objective Genetic Algorithms (MOGAs), excel in exploring the vast sequence space to discover novel protein sequences that fold into a target structure. A key advantage is their ability to simultaneously optimize multiple, often competing, objectives. For instance, one study implemented a MOGA that concurrently optimizes for secondary structure similarity and sequence diversity. This approach, known as diversity-as-objective (DAO) multi-objectivization, allows the algorithm to search more deeply and broadly in the sequence solution space, preventing premature convergence and generating a diverse set of viable sequence solutions for a single target structure [6].
Q2: When using EAs for sequence design, my designs are stable but often lack biological function. How can I preserve function during optimization?
This is a common challenge, as over-optimizing for structural stability can disrupt precise functional motifs. The issue arises because standard inverse folding does not inherently incorporate functional constraints. To address this, you should integrate functional information directly into the evolutionary fitness function or the initial sequence sampling. Modern approaches, including advanced machine learning models, suggest several strategies:
- Incorporate Evolutionary Information: Use Multiple Sequence Alignments (MSA) to inform the EA. The MSA contains evolutionary constraints that can guide the algorithm toward sequences that are not only stable but also functionally competent [34].
- Include Multiple Structural States: If your protein's function relies on conformational dynamics (e.g., an allosteric protein or a binding protein that undergoes induced fit), optimize sequences against multiple backbone conformations. This prevents the EA from overspecializing on a single, static structure and helps preserve the dynamic behavior essential for function [34].
- Explicitly Model Functional Sites: For enzymes or binding proteins, fix the identities or physico-chemical properties of catalytically essential residues or binding pocket residues during the evolutionary optimization process. An alternative is to add a term to the fitness function that rewards the preservation of these critical residues [35] [34].
Q3: How do I balance the trade-off between exploration (diversity) and exploitation (fitness) in my EA parameters?
Balancing exploration and exploitation is critical for the success of an EA. The DAO strategy explicitly treats diversity as an objective to be maximized alongside fitness [6]. Beyond this, parameter tuning is essential:
- Population Size: A larger population promotes diversity but increases computational cost.
- Crossover and Mutation Rates: A higher crossover rate facilitates the exploitation of good building blocks, while a higher mutation rate promotes exploration of new sequences.
- Selection Pressure: Implement selection mechanisms like tournament or roulette-wheel selection with carefully tuned pressure. Too much pressure leads to premature convergence; too little slows optimization.
The table below summarizes key parameters and their effect on the exploration-exploitation balance [6]:
| Parameter | Effect on Exploration | Effect on Exploitation | Recommendation for IFP |
|---|---|---|---|
| Population Size | Increases | Decreases | Use a large size (hundreds to thousands) to maintain diverse sequence pools. |
| Mutation Rate | Increases | Decreases | Set to a moderate-to-high level (e.g., 0.01-0.1 per residue) to encourage novelty. |
| Crossover Rate | Decreases | Increases | Use a high rate to effectively combine stable structural motifs. |
| Selection Pressure | Decreases | Increases | Apply moderate pressure (e.g., tournament size of 3-5) to avoid early convergence. |
Q4: What are the key metrics to validate sequences designed by my EA for the target structure?
Validation should occur at multiple levels, from fast in silico checks to experimental verification.
- In Silico Validation:
- Tertiary Structure Prediction: Use tools like I-TASSER or AlphaFold2 to predict the 3D structure of your designed sequence [6] [36].
- Structure Similarity: Compare the predicted model to your original target structure using metrics like TM-Score (values >0.5 suggest similar folds; >0.8 indicate a functionally similar structure) and GDT_TS [6] [37].
- Secondary Structure Annotation: Verify that the secondary structure elements (alpha-helices, beta-sheets) of the predicted model match the target using tools like DSSP [6].
- Experimental Validation:
- Thermal Stability (∆Tm): Measure the melting temperature. A significant increase (e.g., ∆Tm ≥ 10 °C) indicates successful stabilization [35] [34].
- Functional Assays: Perform activity assays specific to the protein's function (e.g., enzyme kinetics, binding affinity measurements) to confirm that function is retained or enhanced [34].
Troubleshooting Guides
Issue 1: Poor Sequence Diversity and Premature Convergence
Problem: Your EA converges quickly on a single, sub-optimal sequence variant, failing to explore the full solution space.
Solutions:
- Implement Multi-Objectivization: Reformulate the single-objective problem (e.g., maximize stability) into a multi-objective one. A proven method is the Diversity-as-Objective (DAO) approach, where you explicitly optimize for both structural fitness and sequence diversity. This forces the algorithm to maintain a Pareto front of diverse, high-quality solutions [6].
- Adjust Algorithmic Parameters: Increase the mutation rate and population size. Decrease the selection pressure by using a less aggressive selection scheme [6].
- Use Niching Techniques: Integrate methods like fitness sharing or crowding to prevent any single sequence variant from dominating the population too quickly. This promotes the formation of stable sub-populations (niches) around different local optima in the fitness landscape [6].
Issue 2: Computationally Expensive Fitness Evaluation
Problem: The energy or fitness calculation for each candidate sequence is slow, severely limiting the number of generations and population size you can realistically evaluate.
Solutions:
- Utilize Fast Approximations: During the main evolutionary loop, use fast, approximate energy functions or statistical potentials. Reserve more accurate but slower physics-based calculations (like those in CHARMM) only for the final refinement of top-ranked candidates [6].
- Leverage Machine Learning Potentials: Train or use pre-trained deep neural networks as surrogate fitness functions. These models, once trained, can evaluate sequence fitness orders of magnitude faster than traditional physics-based calculations [36].
- Parallelize Fitness Evaluations: The fitness evaluation of individuals in a population is an "embarrassingly parallel" problem. Distribute these computations across multiple CPU/GPU cores or an HPC cluster to drastically reduce wall-clock time [6].
Issue 3: Designed Sequences Are Stable but Misfolded or Non-Functional
Problem: Your designed sequences express well and are thermally stable, but structural validation reveals they are misfolded or lack the intended biological activity.
Solutions:
- Integrate Negative Design: Your fitness function must not only stabilize the desired target state (positive design) but also destabilize competing, misfolded states (negative design). This can be implicitly achieved by using evolutionary guidance. Filter candidate mutations based on natural sequence variation from homologous proteins (MSA), as evolution has already selected against aggregation-prone and misfolding motifs [35].
- Incorporate Co-evolutionary Data: Use direct coupling analysis (DCA) on a multiple sequence alignment to identify evolutionarily coupled residue pairs. Adding a term to your fitness function that rewards the preservation of these couplings can strongly guide the EA toward natively-like, functional folds [38].
- Validate with Folding Models: Incorporate a step where candidate sequences are passed through a protein folding model like AlphaFold2 or ESMFold. Use the predicted TM-Score relative to the target structure as a critical filter or an additional fitness objective before selecting sequences for experimental testing [37].
Experimental Protocols & Workflows
Protocol 1: MOGA with Diversity-as-Objective for Inverse Folding
This protocol outlines the methodology for using a Multi-Objective Genetic Algorithm to design protein sequences for a target structure [6].
1. Input Preparation:
- Obtain the target protein's 3D backbone structure (e.g., from PDB).
- Annotate its secondary structure using a tool like DSSP.
2. Algorithm Initialization:
- Representation: Encode a protein sequence as a string of characters (amino acids).
- Initialization: Generate a random population of sequences or seed it with fragments of natural sequences.
- Parameter Setting: Set population size (e.g., 1000), number of generations (e.g., 500), crossover rate (e.g., 0.8), and mutation rate (e.g., 0.05).
3. Fitness Evaluation (Multi-Objective): For each individual in the population, calculate two primary fitness objectives:
- Objective 1: Secondary Structure Similarity. Measure how well the sequence's predicted secondary structure (using a tool like PSIPRED) matches the target's.
- Objective 2: Sequence Diversity. Calculate the pairwise sequence diversity within the current population (e.g., average Hamming distance).
4. Evolutionary Loop:
- Selection: Apply a multi-objective selection method (e.g., NSGA-II) to select parents based on the Pareto front of the two objectives.
- Crossover: Perform crossover (e.g., single-point) on parent sequences to produce offspring.
- Mutation: Introduce point mutations in the offspring sequences.
- Replacement: Form a new population from the best parents and offspring.
5. Validation and Output:
- Select a subset of the best-performing sequences from the final Pareto front.
- Perform tertiary structure prediction (e.g., with I-TASSER) for these sequences.
- Validate by comparing the predicted model's tertiary structure and secondary structure annotation to the original target [6].
MOGA for Inverse Folding Workflow
Protocol 2: Integrating Evolutionary Algorithms with Inverse Folding Feedback
This protocol describes a advanced workflow that uses a folding model's feedback to iteratively improve an inverse folding process, inspired by Direct Preference Optimization (DPO) techniques [37].
1. Setup:
- Have a target protein structure ready.
- Choose a base inverse folding model (e.g., a trained EA or a neural network like ProteinMPNN).
- Choose a protein folding model (e.g., AlphaFold2, ESMFold).
2. Sequence Sampling and Folding:
- Use the inverse folding model to generate a diverse set of candidate sequences for the target structure.
- For each candidate sequence, use the folding model to predict its 3D structure.
3. Preference Pair Generation:
- Calculate the TM-Score between each predicted structure and the original target structure.
- For a given target, rank the sequences and create pairwise preference data: (chosensequence, rejectedsequence) based on their TM-Scores.
4. Model Optimization:
- Use a preference optimization algorithm (like DPO) to fine-tune the inverse folding model. The objective is to increase the probability of generating "chosen" sequences over "rejected" ones.
- This process can be repeated for multiple rounds, creating a self-improving loop where the inverse folding model learns to produce sequences that are more likely to fold correctly according to the folding model [37].
DPO Feedback Loop for Inverse Folding
Research Reagent Solutions
The table below lists key computational tools and resources essential for conducting research in Evolutionary Algorithms for Inverse Protein Folding.
| Resource Name | Type | Primary Function in Research |
|---|---|---|
| I-TASSER Suite [6] | Software Suite | Protein structure prediction for validating designed sequences. |
| CHARMM [6] | Molecular Dynamics | Detailed energy minimization and dynamics calculations for final sequence refinement. |
| ESM Protein Language Model [34] | Machine Learning Model | Provides evolutionary-informed sequence embeddings to guide design towards functional regions. |
| AlphaFold2 / ESMFold [37] | Folding Model | Provides fast, accurate in silico feedback on whether a designed sequence will fold into the target structure. |
| DSSP [6] | Algorithm | Annotates protein secondary structure from 3D coordinates, used for fitness calculation. |
| NSGA-II [6] | Algorithm | A multi-objective optimization algorithm for managing trade-offs like stability vs. diversity. |
| ProteinMPNN [39] [37] | Inverse Folding Model | A neural network-based inverse folding model; can be used as a baseline or within a hybrid EA/ML workflow. |
| Direct Coupling Analysis (DCA) [38] | Analytical Method | Infers evolutionarily coupled residues from MSAs to constrain the EA's search space. |
Technical Support Center
Frequently Asked Questions (FAQs)
Q1: Our model's performance has plateaued on the ProteinGym benchmark. What are the most effective strategies for improvement? Strategies include integrating complementary evolutionary signals and ensuring proper calibration of probabilities for log-odds scoring. The EvoIF model demonstrates that fusing within-family profiles from homologs with cross-family structural constraints significantly improves robustness across different function types, MSA depths, and mutation depths. For optimal performance, use a compact transition block to fuse sequence-structure representations with these evolutionary profiles [40] [41].
Q2: We are dealing with limited assay data relative to the vastness of protein sequence space. How can we build an accurate model? Leverage protein language models (pLMs) trained with Masked Language Modeling (MLM) for strong zero-shot fitness prediction. Furthermore, adopt an Inverse Reinforcement Learning (IRL) perspective where natural evolution is viewed as implicit reward maximization and existing protein sequences serve as expert demonstrations. This approach allows a lightweight model like EvoIF to achieve state-of-the-art performance using only 0.15% of the training data required by larger models [40].
Q3: What are the key hyperparameters for evolutionary algorithm-based HPO, and how should we manage them? Key hyperparameters include the population size, crossover rate, and mutation rate. Advanced frameworks like DRL-HP-* use Deep Reinforcement Learning (DRL) to adapt these hyperparameters across different stages of the evolutionary process. The framework uses a novel reward function and states characterizing the evolutionary process to determine hyperparameters, outperforming many state-of-the-art methods [42].
Q4: How do we effectively tune hyperparameters for a machine learning model in protein prediction? Beyond evolutionary algorithms, consider several optimization techniques. The performance of different methods is summarized below:
Table: Comparison of Hyperparameter Optimization (HPO) Techniques
| Method | Key Principle | Advantages | Disadvantages |
|---|---|---|---|
| Grid Search [43] | Exhaustive search over a specified set | Simple, comprehensive | Curse of dimensionality, computationally slow |
| Random Search [43] | Random selection from parameter space | More efficient than grid search in high dimensions | Can miss optimal regions, inefficient |
| Bayesian Optimization (BO) [43] | Builds a surrogate model to guide search | Efficient, tracks past evaluations | Inherently serial, choice of acquisition function is critical |
| Evolutionary Algorithms (EA) [43] [42] | Population-based, inspired by natural selection | Good for complex/noisy spaces, robust | Can be computationally expensive |
| Multi-Fidelity Methods [43] | Uses low-fidelity approximations (e.g., less data) | Reduces computational cost | Introduces approximation error |
Q5: Our dataset has a severe class imbalance. How does this affect model training, and how can we address it? Class imbalance causes models to be biased toward the majority class. Performance metrics like accuracy can be misleading. To address this:
- Data-level methods: Use Random Over-Sampling (ROS), Random Under-Sampling (RUS), or the Synthetic Minority Over-sampling Technique (SMOTE) [44].
- Algorithm-level methods: Up-weight the misclassification cost for the minority class [44].
- Evaluation metrics: Rely on Area Under the Precision-Recall Curve (AUPRC), F-measure, or Matthews Correlation Coefficient (MCC) instead of accuracy [44].
Troubleshooting Guides
Issue: Poor Generalization Across Different Protein Families or Taxa
- Problem: The model performs well on some protein families but poorly on others.
- Solution: Ensure your model incorporates both within-family and cross-family evolutionary profiles. Ablation studies for EvoIF confirm that these two signal types are complementary and are crucial for improving model robustness across different taxa and function types [40].
- Protocol:
- Within-Family Profiles: Retrieve homologous sequences for your target protein to build multiple sequence alignments (MSAs).
- Cross-Family Constraints: Use inverse folding models to distill structural-evolutionary constraints that are shared across different protein folds.
- Integration: Fuse these two profiles using a neural network transition block to generate calibrated fitness predictions.
Issue: High Computational Cost of Model Training or Hyperparameter Optimization
- Problem: The HPO process is too slow or resource-intensive.
- Solution: Implement multi-fidelity optimization methods or leverage optimized frameworks.
- Protocol for Multi-Fidelity HPO (e.g., Hyperband):
- Configure: Define a large set of hyperparameter configurations and a resource (e.g., epochs, data subset) to minimize.
- Successive Halving: Run all configurations with a small budget, then only promote the top-performing half to the next, larger budget.
- Repeat: Iterate the halving process until the maximum budget is allocated to the best configuration(s) [43].
- Alternative: For Evolutionary Algorithms, use frameworks like DRL-HP-* that employ DRL to set hyperparameters efficiently across different stages of the search, reducing the need for exhaustive tuning [42].
Experimental Protocols & Data Presentation
Detailed Methodology: EvoIF Model for Fitness Prediction The following workflow outlines the EvoIF pipeline for predicting the fitness impact of protein mutations.
Title: EvoIF Protein Fitness Prediction Workflow
Protocol Steps:
- Generate Evolutionary Profiles:
- Within-Family Profile: Iteratively search genomic and metagenomic databases (e.g., using HHblits, Jackhmmer) to build deep Multiple Sequence Alignments (MSAs) for the input protein. This captures conservation patterns within its protein family [40] [45].
- Cross-Family Profile: Use an inverse folding model (e.g., ProteinMPNN) to process the protein's predicted or native structure. The output logits from this model distill structural constraints that are evolutionarily conserved across different protein families [40].
- Fuse Sequence-Structure Data: Process the initial protein sequence and predicted structural features through a pre-trained protein Language Model (pLM) like ESM-2 to get a residue-level embedding. These embeddings, along with the two evolutionary profiles, are integrated using a compact neural network transition block [40] [46].
- Compute Fitness Score: The fused representation is used to produce calibrated probabilities. The final fitness impact of a mutation is calculated as the log-odds score between the mutant and wild-type probabilities [40].
Quantitative Performance Data on ProteinGym The EvoIF model was benchmarked on ProteinGym, a comprehensive set of 217 mutational assays comprising over 2.5 million mutants [40].
Table: EvoIF Benchmarking Results on ProteinGym
| Model Variant | Key Features | Training Data Used | Performance vs. Baselines |
|---|---|---|---|
| EvoIF (Core) | Within-family + Cross-family profiles | 0.15% | Competitive or state-of-the-art on many assays |
| EvoIF (MSA-enabled) | Enhanced with deep MSAs | 0.15% | Improved robustness, especially with sufficient MSA depth |
The Scientist's Toolkit
Table: Essential Research Reagents and Computational Tools
| Item / Resource | Function / Purpose | Example or Note |
|---|---|---|
| Protein Language Models (pLMs) [40] | Generate semantic representations of protein sequences; used for zero-shot fitness prediction. | ESM-2, ProtT5 |
| Inverse Folding Models [40] | Predict a sequence that fits a given protein backbone structure; provides cross-family evolutionary constraints. | ProteinMPNN |
| Structure Prediction Tools [45] [46] | Generate 3D protein structures from amino acid sequences for feature extraction. | AlphaFold2, AlphaFold3, ESMFold |
| Evolutionary Algorithm Frameworks [42] | Provide robust optimization for complex hyperparameter spaces where gradients are unavailable. | DE, CMA-ES, DRL-HP-* |
| Hyperparameter Optimization (HPO) Libraries [43] | Automate the process of finding optimal model parameters. | Optuna, Scikit-optimize |
| Benchmark Datasets [40] | Standardized datasets for training and fairly evaluating model performance. | ProteinGym (for fitness prediction) |
Parameter Optimization and Performance Tuning Strategies
Frequently Asked Questions (FAQs)
Q1: What is the most common cause of premature convergence in my evolutionary algorithm for protein design? The most common cause is excessive selection pressure, often combined with a population size that is too small. This combination rapidly reduces population diversity, trapping the algorithm in a local optimum. For instance, in protein-ligand docking with REvoLd, allowing only the fittest individuals to reproduce initially caused fast convergence but limited exploration of the chemical space. This was mitigated by introducing additional crossover and mutation steps for lower-fitness individuals, which improved the discovery of diverse, high-scoring molecules [18].
Q2: How do I balance population size and generation count when computational resources are limited? This is a classic trade-off. A larger population supports diversity and exploration, while a higher generation count allows for more refinement and exploitation. For problems like protein structure refinement, a robust approach is to use a moderate population size and incorporate problem-specific local search heuristics (as in memetic algorithms) to improve solutions efficiently within a limited number of generations [11]. The Paddy algorithm demonstrates that a well-designed algorithm can maintain strong performance with a feasible number of evaluations, avoiding the need for an excessively large population or generations [47].
Q3: My algorithm is consuming too much memory. Which hyperparameters should I adjust first? Population size is the primary lever for controlling memory usage, as it directly scales with the number of candidate solutions stored. If memory is a constraint, consider reducing the population size and compensating for the potential loss of diversity by increasing the mutation rate or adjusting the selection operator to be less greedy. Furthermore, algorithms like the modified Differential Evolution (DE) have been specifically designed to address time and memory inefficiencies, demonstrating that the choice of algorithm itself can mitigate these issues [48].
Q4: In a multi-objective protein complex detection problem, how does selection pressure work?
In multi-objective optimization, selection pressure is applied based on Pareto dominance and often a density metric like crowding distance. Instead of selecting only the absolute best solutions, the algorithm selects a set of non-dominated solutions that represent a trade-off between the objectives. The FSPTO operator, for example, translocates proteins based on functional similarity from Gene Ontology, applying a biologically informed selection pressure that improves the identification of coherent protein complexes [28].
Troubleshooting Guides
Problem: Premature Convergence
Description: The algorithm's performance stagnates early, returning a sub-optimal solution that is often a local optimum.
Diagnosis and Solutions:
- Check Selection Pressure: An overly aggressive selector (e.g., always taking only the top 5%) can cause this. Solution: Use a less greedy selection strategy like tournament selection or incorporate fitness scaling.
- Increase Population Size: A small population lacks the genetic diversity to explore the search space effectively. Solution: Gradually increase the population size until performance improves. For screening ultra-large chemical libraries, a starting population of 200 was found to be effective [18].
- Introduce Niching: Apply niching techniques like fitness sharing or crowding to maintain sub-populations around different optima. This is particularly effective for multimodal problems, such as identifying multiple potential protein complexes or drug scaffolds [49].
- Adjust Mutation Rate: A low mutation rate fails to introduce sufficient new genetic material. Solution: Increase the mutation rate. In peptide discovery with POETRegex, mutation is a key operator for exploring the vast sequence space [50].
Table 1: Experimental Protocols for Mitigating Premature Convergence
| Method | Key Parameter Adjustments | Reported Outcome in Protein Research |
|---|---|---|
| Modified DE with Weighted Donor Vectors [48] | Replaces random index selection with best-fitted donor vectors. | Outperformed standard DE; achieved 89.3% accuracy in host-pathogen PPI prediction. |
| Introducing Crossovers & Mutations [18] | Added crossover between fit molecules and a mutation to low-similarity fragments. | Increased the number and diversity of virtual hits in ultra-large library screening. |
| Paddy Field Algorithm (PFA) [47] | Propagation based on both fitness and population density (pollination factor). | Maintained robust performance across mathematical and chemical optimization tasks, avoiding early convergence. |
Problem: Failure to Converge
Description: The algorithm continues to explore without showing signs of stabilizing or improving the solution quality over many generations.
Diagnosis and Solutions:
- Increase Selection Pressure: The selection mechanism might be too weak. Solution: Increase the selection pressure by selecting a smaller proportion of the population for reproduction or by using an elitist strategy that guarantees the best solutions are carried forward.
- Check Generation Count: The algorithm may simply not have run for long enough. Solution: Increase the maximum generation count. Benchmarking can help determine a sufficient number; for example, REvoLd showed good results after 30 generations [18].
- Reduce Disruptive Genetic Operators: An excessively high mutation or crossover rate can prevent the algorithm from exploiting good building blocks. Solution: Decrease the mutation and crossover probabilities.
- Utilize Local Search: Incorporate a local search (memetic algorithm) to refine individuals. The Relax-DE algorithm for protein structure refinement combines Differential Evolution with the Rosetta Relax protocol, allowing for faster convergence to low-energy conformations [11].
Problem: Population Diversity Collapse
Description: The genotypes of individuals in the population become very similar, halting productive exploration.
Diagnosis and Solutions:
- Implement Diversity-Preserving Techniques: Use niching or crowding to penalize overly similar individuals. In multimodal DE, this is achieved through niching methods that form stable subpopulations targeting different optima [49].
- Adaptive Parameter Control: Dynamically adjust the mutation rate based on population diversity metrics. If diversity drops below a threshold, the mutation rate can be automatically increased.
- Injection of New Individuals: Periodically introduce new randomly generated individuals into the population to reintroduce diversity. This mimics migration in natural populations.
Table 2: Summary of Key Hyperparameter Interactions and Solutions
| Problem Symptom | Primary Hyperparameter to Adjust | Compensating Adjustments | Recommended Algorithmic Strategies |
|---|---|---|---|
| Premature Convergence | Decrease Selection Pressure | Increase Population Size; Increase Mutation Rate. | Tournament Selection; Fitness Sharing; Modified DE [48]. |
| Slow / No Convergence | Increase Selection Pressure | Increase Generation Count; Decrease Mutation Rate. | Elitism; Memetic Algorithms (e.g., Relax-DE) [11]; Steady-State Evolution. |
| Loss of Diversity | Increase Population Size | Introduce Niching; Adjust Mutation Operator. | Crowding; Niche Formation; Paddy Field Algorithm [47]. |
Experimental Protocols and Workflows
Protocol: Tuning an EA for Protein-Peptide Ligand Docking
This protocol is adapted from the hyperparameter optimization of the REvoLd algorithm for docking on ultra-large make-on-demand libraries [18].
- Initialization:
- Set a random start population of 200 ligands to ensure initial variety.
- Define a maximum generation count of 30 as a starting point.
- Selection and Reproduction:
- Allow the top 50 individuals (25% of the population) to advance to the next generation.
- Apply a crossover operator between the fittest molecules to recombine promising traits.
- Apply a mutation operator that can switch fragments for low-similarity alternatives to explore broadly.
- Evaluation and Iteration:
- Use a flexible docking protocol (e.g., RosettaLigand) to evaluate the fitness of new offspring.
- Run for the set number of generations. To avoid local minima, perform multiple independent runs with different random seeds instead of a single, very long run.
- Troubleshooting:
- If converging too fast: Reduce selection pressure by allowing more than 50 individuals to reproduce. Increase the strength of the mutation operator.
- If not converging: Increase the selection pressure by allowing fewer individuals to reproduce. Introduce a second round of crossover/mutation focused on the best performers.
Protocol: Memetic Refinement of Protein Structures
This protocol outlines the Relax-DE approach for refining protein structures, which combines a global evolutionary search with a local, domain-specific search [11].
- Problem Encoding:
- Represent a protein conformation as a vector of its chi rotation angles (side chain dihedrals) and/or backbone torsion angles.
- Algorithm Configuration:
- Use Differential Evolution (DE) as the global search operator to generate new candidate conformations.
- Use the Rosetta Relax protocol as the local search (meme) operator. This operator is applied to offspring generated by DE to locally minimize the energy function before selection.
- Workflow Execution:
- The DE population evolves over multiple generations.
- New trial vectors (conformations) created by DE are passed to Rosetta Relax for local energy minimization.
- The refined conformation is evaluated using the full-atom energy score (e.g., Ref2015).
- The algorithm selects the best individuals between parents and refined offspring to form the next generation.
- Outcome: This hybrid approach provides better sampling of the energy landscape and finds lower-energy structures than using Rosetta Relax alone for the same computational budget [11].
Memetic Algorithm for Protein Refinement
The Scientist's Toolkit
Table 3: Essential Research Reagents and Software Solutions
| Tool / Reagent | Function / Application | Example in Context |
|---|---|---|
| Rosetta Software Suite | A comprehensive platform for macromolecular modeling. Used for tasks like protein-ligand docking (RosettaLigand) and structure refinement (Rosetta Relax). | REvoLd uses RosettaLigand for flexible docking [18]. Relax-DE uses Rosetta Relax for local energy minimization [11]. |
| Paddy Field Algorithm (PFA) | An evolutionary optimization algorithm that propagates parameters based on fitness and population density. | Benchmarked for robustness in chemical optimization tasks, including hyperparameter tuning of neural networks on chemical data [47]. |
| Differential Evolution (DE) | A powerful population-based evolutionary algorithm for continuous parameter optimization. | Used as the core optimizer in a memetic algorithm for protein structure refinement (Relax-DE) [11]. A modified DE optimized a deep forest model for PPI prediction [48]. |
| EvoTorch / Hyperopt | Software libraries for implementing and tuning evolutionary algorithms and Bayesian optimization. | Used as benchmark algorithms against which the Paddy algorithm was compared [47]. |
| Gene Ontology (GO) Annotations | A structured, controlled vocabulary for describing gene and gene product attributes. | Used to create a heuristic mutation operator (FSPTO) in a multi-objective EA for detecting biologically coherent protein complexes [28]. |
| Enamine REAL Space | A make-on-demand virtual library of billions of synthesizable compounds. | Used as the search space for the REvoLd evolutionary docking algorithm [18]. |
Balancing Exploration vs. Exploitation to Avoid Premature Convergence
Troubleshooting Guides and FAQs
Why is my algorithm converging quickly to a suboptimal solution?
This is a classic sign of premature convergence, where exploitation dominates and the population loses diversity too early. Your algorithm is likely over-exploiting known good regions of the search space and failing to explore new, potentially better areas [51].
- Recommended Action: Increase the mutation rate moderately and consider implementing mechanisms like Covariance-Matrix Adaptation (CMA) that dynamically adjust the search scope based on population diversity [52].
How can I measure the exploration-exploitation balance in my experiment?
Measuring this balance quantitatively remains a challenge in the field [51]. However, you can use proxies.
- Recommended Action: Monitor the population diversity in both the decision (search) space and the objective space over generations. A rapid decline in diversity indicates excessive exploitation. Some advanced methods use a survival analysis to derive a probabilistic indicator that guides the use of exploratory versus exploitative operators [53].
Which operator is responsible for exploration and which for exploitation?
There is confusion in literature, but the most consistent interpretation is:
- Exploration (Finding new regions): Primarily driven by mutation and crossover. Mutation introduces new genetic material, while crossover combines existing solutions in novel ways [54].
- Exploitation (Refining existing solutions): Primarily driven by selection. Selection pressure favors the best current solutions, intensifying the search around them [54].
The key is that both crossover and mutation are exploration mechanisms, but they can be tuned to be more explorative or exploitative [53] [54].
My model performs well on training data but generalizes poorly to new protein sequences. What should I do?
This indicates that your train/test split may not reflect the real-world application, a common issue in protein regression [55].
- Recommended Action: Re-evaluate your data splitting strategy. Avoid simple random splits. Use a position-level cross-validation or a split that ensures sequences in the test set are sufficiently different from those in the training set to better simulate predicting truly novel variants [55]. Also, ensure your fitness function accurately reflects the functional trait of interest, not just a noisy proxy [55].
The table below summarizes methodologies cited in recent literature for managing exploration and exploitation.
Table 1: Methodologies for Balancing Exploration and Exploitation
| Method Name | Core Principle | Key Mechanism | Reported Application/Effectiveness |
|---|---|---|---|
| Survival Analysis (EMEA) [53] | Guides trade-off based on solution survival patterns during search. | Uses a "Survival length in Position" indicator to adaptively choose between a explorative DE operator and an exploitative sampling operator. | Effectively finds complex Pareto sets/fronts in multiobjective optimization; superior to NSGA-II, SMS-EMOA in studies [53]. |
| Attention Mechanism (LMOAM) [56] | Balances trade-off at the level of individual decision variables. | Uses an attention network to assign a unique weight to each variable, guiding the search dimension-by-dimension. | Validated on nine large-scale multiobjective optimization (LSMOP) benchmarks; handles problems with thousands of variables [56]. |
| Insights-Infused Framework [57] | Uses deep learning to extract knowledge from evolutionary data. | A pre-trained MLP network learns evolutionary patterns and provides "synthesis insights" to guide the search direction via a neural network-guided operator (NNOP). | Enhances performance on benchmark problems (CEC2014, CEC2017) and real-world optimization problems; improves algorithm convergence [57]. |
| Covariance-Matrix Adaptation ES (CMA-ES) [52] | Adaptively controls the search distribution. | Dynamically updates the covariance matrix of a multivariate normal distribution based on the best solutions, adapting the search scope and direction. | Effectively navigates rugged landscapes with many local optima, as demonstrated on Rastrigin and Schaffer functions [52]. |
| Hybrid Operator Selection [53] | Combines multiple operators with known exploration/exploitation traits. | Hybridizes a explorative Differential Evolution (DE) operator and an exploitative clustering-based sampling strategy, switching based on algorithm state. | Achieves a better balance than using a single operator, leading to more diverse and closer-to-optimal solution sets [53]. |
Detailed Experimental Methodology
For researchers aiming to implement these strategies, here is a deeper dive into two representative protocols.
Survival Analysis for Multiobjective Optimization (EMEA)
This algorithm uses the search process's history to intelligently guide the balance [53].
Workflow:
- Track Survival History: For each solution in the population, record how many generations it survives without being replaced.
- Calculate Balance Indicator: Derive a control probability,
β, based on the survival status of solutions over a history window ofHgenerations. - Adaptive Operator Selection: Use the
βindicator to probabilistically choose between two recombination operators:- Exploration Operator: A Differential Evolution (DE) operator (e.g., DE/rand/1/bin) is favored when more exploration is needed.
- Exploitation Operator: A clustering-based advanced sampling strategy (CASS), which models the distribution of good solutions, is favored for local refinement.
- Iterate: Repeat the process, allowing the search to automatically shift between exploratory and exploitative phases.
Deep-Learning Guided Evolutionary Framework
This framework leverages neural networks to extract knowledge from the evolutionary process itself [57].
Workflow:
- Data Collection: During the run of a baseline EA, collect pairs of parent and offspring individuals where the offspring has better fitness. These
(parent, offspring)pairs represent successful evolutionary steps. - Pre-training: Construct a dataset from these pairs and train a Multi-Layer Perceptron (MLP) network to learn the mapping from a parent solution to a better offspring. To handle variable-length protein data, a fixed-length encoding with padding is used.
- Synthesis Insights: The trained network encapsulates "synthesis insights" — learned knowledge about promising search directions.
- Guidance via NNOP: A Neural Network-Guided Operator (NNOP) is created. This operator, given the current population, uses the network's predictions to generate new candidate solutions that are likely to be improvements.
- Self-Evolution for New Problems: When applied to a new problem (e.g., a different protein system), the pre-trained network is fine-tuned using only data generated by the algorithm on the new problem, ensuring the insights remain relevant.
Workflow and Logical Diagrams
Evolutionary Algorithm Balance Strategy
Exploration vs. Exploitation in EA Operators
The Scientist's Toolkit: Key Research Reagents and Solutions
Table 2: Essential Computational Tools for Protein Optimization with EAs
| Tool / 'Reagent' | Function / Purpose | Considerations for Protein Research |
|---|---|---|
| Protein Language Model (PLM) Embeddings (e.g., ESM, ProtT5) [55] | Provides rich, evolution-aware numerical representations of protein sequences as input for the fitness function. | Superior to one-hot encoding for extrapolating to novel sequences. Choose a model trained on a broad protein family database [55]. |
| Differential Evolution (DE) Operator [53] | A powerful recombination operator for exploration, especially in continuous search spaces. | Highly effective for the initial, broad exploration of the protein sequence space. The DE/rand/1/bin variant is a standard choice [53]. |
| Model-Based Sampling (e.g., CASS, CMA-ES) [53] [52] | An operator that builds a probabilistic model of promising solutions to guide exploitation and refinement. | Crucial for the later stages of optimization. A clustering-based advanced sampling strategy (CASS) can model the distribution of high-fitness protein variants [53]. |
| Fitness Function with Calibrated Uncertainty [55] | A regression model that predicts both the expected fitness value and the uncertainty of the prediction. | Essential for Bayesian optimization. It enables a principled trade-off between exploring high-uncertainty sequences and exploiting known high-fitness ones [55]. |
| Multiobjective Evolutionary Algorithm (e.g., NSGA-II, MOEA/D) [53] | An optimization framework for handling multiple, conflicting objectives (e.g., solubility, stability, activity). | Most real-world protein engineering problems are multiobjective. The choice of algorithm and its diversity maintenance mechanism is critical [53]. |
| Neural Network-Guided Operator (NNOP) [57] | A deep learning module that learns from evolutionary data to suggest promising new candidate solutions. | Can accelerate convergence on new protein families by transferring insights from previous optimization runs, reducing the number of expensive fitness evaluations [57]. |
Understanding the REvoLd Algorithm and Its Configuration
What is the REvoLd algorithm and what is its purpose? REvoLd (RosettaEvolutionaryLigand) is an evolutionary algorithm designed to efficiently screen ultra-large, make-on-demand combinatorial chemical libraries for drug discovery. Its purpose is to identify promising drug candidates by optimizing entire molecules from spaces like the Enamine REAL database, which contains billions of compounds, using a fitness function based on protein-ligand docking scores. It achieves this with far fewer docking calculations than exhaustive screening methods. [18] [58]
What is the significance of the "200-50-30" configuration? The "200-50-30" configuration refers to the key hyperparameters that govern the core evolutionary optimization process in REvoLd. These values were determined through systematic testing to strike an optimal balance between exploring the vast chemical space and exploiting promising molecular scaffolds. [18]
- 200: The size of the random starting population of molecules.
- 50: The number of individuals (population size) allowed to advance to the next generation.
- 30: The number of generations for which the optimization process runs.
The selection of 200 initial ligands provides sufficient variety to initiate an effective search without being computationally prohibitive. Allowing 50 individuals to advance carries forward enough genetic diversity to prevent premature convergence, while 30 generations is the point where the rate of discovering new high-scoring molecules begins to plateau. [18]
Troubleshooting Common Experimental Issues
The following table outlines common problems, their potential causes, and recommended solutions.
| Problem | Possible Causes | Recommended Solutions |
|---|---|---|
| Low Hit Rate / Poor Enrichment | Protocol converges too quickly to local minima; population lacks diversity. | Increase mutation rates; use TournamentSelector for less deterministic selection; execute multiple independent runs. [18] |
| Algorithm Fails to Find Known Binders | Rugged scoring landscape; initial population lacked crucial molecular fragments. | Verify target protein preparation and docking score reliability; increase initial population size; perform multiple runs with different random seeds. [18] |
| High Computational Resource Demand | Large population/generation settings; complex fitness function; protein flexibility in docking. | Adhere to 200-50-30 baseline; leverage parallel computing for docking evaluations; consider rigid docking for initial tests. [18] |
| Excessive Homogeneity in Output | Overly aggressive selection pressure; insufficient mutation. | Incorporate RouletteSelector; increase crossover and "low-similarity" fragment mutation rates. [18] |
Frequently Asked Questions (FAQs)
Q1: Why is the initial population size set to 200? Could I use a larger size for better coverage? A population of 200 was found to provide a sufficient diversity of molecular starting points to initiate an effective search. While a larger population might increase the chance of immediately discovering good binders, it also significantly increases the computational runtime. A smaller population risks being too homogeneous and missing promising regions of the chemical space. The 200-molecule baseline is recommended as an optimal balance. [18]
Q2: My run concluded after 30 generations but is still finding new hits. Should I extend the number of generations? The benchmark suggests that while good solutions often appear within 15 generations, the discovery rate typically flattens after 30 generations. The algorithm rarely fully converges and may continue to find new molecules even after hundreds of generations, but with diminishing returns. Instead of extending a single run indefinitely, it is more effective to launch multiple independent runs. This approach seeds different evolutionary paths and often yields a more diverse set of high-scoring molecular motifs. [18]
Q3: What selection and reproduction operators are recommended for maintaining diversity? REvoLd uses a combination of operators to balance exploration and exploitation:
- Selectors:
ElitistSelector(biases fittest),TournamentSelector, andRouletteSelector. Using less deterministic selectors likeRouletteSelectorcan help maintain diversity. [58] - Reproduction: Occurs through
IdentityFactory,MutatorFactory, andCrossoverFactory. Key steps include:- Point mutations and reaction mutations to explore new chemistries.
- Crossover events to recombine well-suited ligands.
- An additional round of crossover and mutation that excludes the very fittest molecules, allowing worse-scoring ligands to improve and contribute their molecular information. [18]
Q4: How does REvoLd ensure that the proposed molecules are synthetically accessible? REvoLd is explicitly tailored to search within make-on-demand combinatorial libraries, such as the Enamine REAL space. These libraries are defined by lists of available substrates and robust chemical reaction rules. By constructing molecules exclusively within this predefined, synthetically feasible space, REvoLd guarantees that any proposed hit molecule can be readily and economically synthesized for subsequent in-vitro testing. [18]
Experimental Protocols and Workflows
Standard REvoLd Workflow with 200-50-30 Configuration The following diagram illustrates the primary experimental workflow for a REvoLd run.
Detailed Methodology for a Single Docking and Scoring Run The fitness of each molecule is determined by flexible protein-ligand docking using the Rosetta software suite. [18]
- Input Preparation: Generate the 3D structure of the ligand molecule and prepare the target protein's PDB file, including adding hydrogen atoms and optimizing side-chain rotamers.
- Docking Setup: Use the RosettaLigand protocol, which allows for full flexibility of both the ligand and the protein's binding site side chains.
- Execution: Run the docking simulation to generate multiple potential binding poses.
- Scoring: The RosettaEnergyFunction is used to score each generated protein-ligand complex. The score, typically in Rosetta Energy Units (REU), represents the predicted binding affinity. This score serves as the fitness value for the evolutionary algorithm, with lower (more negative) scores indicating stronger binding.
The Scientist's Toolkit: Essential Research Reagents & Materials
The table below lists the key computational tools and data resources required to implement the REvoLd protocol.
| Item Name | Function / Purpose in the Experiment |
|---|---|
| Rosetta Software Suite | The core computational platform that hosts the REvoLd application and provides the flexible docking (RosettaLigand) and energy scoring functions. [18] |
| Enamine REAL Space | An ultra-large, make-on-demand combinatorial chemical library, constructed from simple building blocks and robust reactions, serving as the search space for REvoLd. [18] |
| Protein Data Bank (PDB) File | The file containing the experimentally determined or predicted 3D atomic coordinates of the target protein, used as the input structure for docking. |
| REvoLd Application | The specific evolutionary algorithm implemented within Rosetta that performs the optimization using the 200-50-30 configuration and other parameters. [18] [58] |
Advanced Configuration and Optimization Pathways
For researchers looking to adapt the protocol for specific needs, the following diagram outlines the decision-making process for key parameter adjustments.
Incorporating Biological Knowledge through Specialized Mutation Operators
Troubleshooting Guides & FAQs
Troubleshooting Guide: Specialized Mutation Operator Implementation
| Problem Symptom | Potential Root Cause | Recommended Solution | Verification Method |
|---|---|---|---|
| Algorithm converges to biologically irrelevant solutions [28] | Mutation operator disrupts functionally important protein clusters [28]. | Integrate Gene Ontology (GO) similarity metrics to guide protein translocation during mutation [28]. | Check for increased functional coherence in detected complexes using GO term enrichment analysis [28]. |
| Performance degrades on noisy PPI networks [28] | Standard mutation introduces spurious interactions in low-confidence network regions [28]. | Employ heuristic perturbation operator that weights mutation probability by interaction reliability scores [28]. | Evaluate algorithm robustness on artificial networks with controlled noise levels [28]. |
| Poor fitness prediction for deep mutations [7] | Model lacks evolutionary context from homologous sequences [7]. | Incorporate within-family evolutionary profiles from Multiple Sequence Alignments (MSA) [7]. | Use zero-shot log-odds scoring on ProteinGym benchmarks to assess fitness prediction accuracy [7]. |
| Inability to capture structural constraints [7] | Sequence-based model ignores 3D structural viability of mutations [7]. | Fuse cross-family evolutionary information from Inverse Folding (IF) model likelihoods [7]. | Validate predicted mutant sequences for backbone structure compatibility using IF models [7]. |
| Expert knowledge fails to improve search efficiency [59] | Knowledge incorporation is unbalanced, e.g., used only in selection but not mutation [59]. | Implement symmetric expert knowledge guidance in both selection and mutation operators [59]. | Compare convergence speed and solution quality using balanced vs. unbalanced knowledge integration [59]. |
Frequently Asked Questions (FAQs)
Q1: What is a Functional Similarity-Based Protein Translocation Operator, and when should I use it?
This is a specialized mutation operator that translocates proteins within a predicted complex based on their Gene Ontology (GO) functional similarity rather than just network topology [28]. It is particularly useful when you need to detect protein complexes that are not only densely connected but also functionally coherent. Use this operator when standard topological approaches yield complexes with poor functional enrichment scores [28].
Q2: Why would I reformulate the Protein Structure Prediction (PSP) problem as a multi-objective optimization problem?
The PSP problem naturally involves conflicting objectives, such as minimizing local (bond) interaction energy and non-local (non-bond) interaction energy simultaneously [60]. A single-objective function that aggregates these can misguide the search. A multi-objective formulation allows you to discover a Pareto front of conformations representing the trade-offs, which better reflects the ensemble of native-like structures existing in solution [60].
Q3: How can I incorporate expert knowledge into a Genetic Programming (GP) mutation operator for genetic analysis?
You can guide the mutation process by biasing it toward features that expert knowledge deems important. For example, in genome-wide association studies, you can use Tuned ReliefF (TuRF) scores—which estimate the quality of attributes for detecting epistasis—to weight the probability of selecting specific single-nucleotide polymorphisms (SNPs) for mutation [59]. This integrates domain knowledge directly into the search process.
Q4: What is the fundamental connection between Masked Language Modeling (MLM) and protein fitness prediction?
Protein evolution can be viewed as an implicit reward-maximization process, where naturally selected sequences are "expert demonstrations." MLM pre-training aligns with Inverse Reinforcement Learning (IRL), whose goal is to recover a latent reward function (fitness) from expert data (natural sequences). Therefore, the log-odds ratio produced by a protein language model can serve as a valid fitness estimate [7].
Q5: My multi-objective algorithm for complex detection is slow. What are some key optimization strategies?
Focus on problem-specific operators, like the GO-based mutation operator, which can guide the search more efficiently than random variation [28]. Additionally, for conformational space search in PSP, leveraging multi-objectivization can reduce the number of local optima and facilitate a more effective exploration of the energy landscape [60].
Experimental Protocols & Data
Protocol: Implementing a GO-Based Mutation Operator
Purpose: To enhance the detection of biologically relevant protein complexes in PPI networks by incorporating functional knowledge from Gene Ontology during the mutation phase of a multi-objective evolutionary algorithm [28].
Workflow:
- Input: A PPI network and precomputed GO functional similarity scores for all protein pairs.
- Initialization: Initialize the population of candidate protein complexes.
- Evaluation: Evaluate each candidate complex using multiple conflicting objectives (e.g., topological density and functional homogeneity).
- Selection & Variation:
- Select parents based on non-domination and crowding distance.
- For a candidate complex selected for mutation:
- Identify a protein within the complex to be translocated.
- Instead of a random move, identify a set of candidate proteins from the network that have high GO functional similarity to the proteins in the current complex.
- Translocate the selected protein to a position near a candidate protein from this functionally similar set.
- Termination: Repeat steps 3-4 until a stopping criterion is met (e.g., max generations).
- Output: A set of non-dominated protein complexes.
Protocol: Multi-objective Protein Structure Prediction
Purpose: To identify an ensemble of low-energy protein conformations by simultaneously optimizing conflicting energy terms [60].
Workflow:
- Problem Formulation: Define the PSP as a multi-objective problem with at least two objectives: minimizing local interaction energy (f₁) and minimizing non-local interaction energy (f₂) [60].
- Algorithm Selection: Employ a Multi-Objective Evolutionary Algorithm (MOEA) such as PAES or MO-fmGA as the search strategy [60].
- Conformational Search:
- Representation: Encode a protein conformation as a vector in the decision variable space.
- Initialization: Generate an initial population of random conformations.
- Evaluation: Calculate both objective functions (f₁ and f₂) for each conformation.
- Selection & Archive: Use Pareto dominance to select parents and maintain an archive of non-dominated solutions.
- Variation: Apply crossover and mutation operators to generate new candidate conformations.
- Analysis: Upon termination, the algorithm outputs an approximation of the Pareto front. Analyze this set of conformations to understand the trade-offs and identify the native-like ensemble [60].
Table 1: Performance Comparison of Complex Detection Methods on Yeast PPI Network [28]
| Method | MIPS Complexes Matched (Recall) | Functional Coherence (Avg. GO Similarity) | Robustness (Performance drop at 20% noise) |
|---|---|---|---|
| MOEA with GO-Mutation | 0.72 | 0.85 | < 5% |
| MCL Algorithm | 0.58 | 0.71 | ~15% |
| MCODE | 0.49 | 0.65 | ~20% |
Table 2: Fitness Prediction Performance on ProteinGym Benchmark (217 assays) [7]
| Model | Training Data Volume | Parameters | Average Spearman's ρ |
|---|---|---|---|
| EvoIF (Ours) | 0.15% | ~200M | 0.67 |
| ESM-2 | 100% | 650M | 0.61 |
| AIDO-Protein-RAG | 100% | >1B | 0.69 |
Workflow Visualization
GO-Guided Complex Detection Workflow
Multi-objective Protein Structure Prediction
The Scientist's Toolkit
Table 3: Key Research Reagents & Computational Tools
| Item Name | Function / Purpose | Key Feature / Application |
|---|---|---|
| Gene Ontology (GO) | Provides structured, controlled vocabularies (terms) for describing gene product functions [28]. | Used to compute functional similarity scores to guide mutation operators in complex detection [28]. |
| Tuned ReliefF (TuRF) | A feature selection algorithm robust to epistasis (gene-gene interactions) in genetic studies [59]. | Provides expert knowledge scores to weight mutation probabilities in Genetic Programming [59]. |
| Inverse Folding (IF) Models | Predicts amino acid sequences that are compatible with a given protein backbone structure [7]. | Source of cross-family structural-evolutionary constraints for fitness prediction models [7]. |
| Multiple Sequence Alignment (MSA) | Alignment of homologous protein sequences from the same family [7]. | Provides within-family evolutionary information to contextualize mutation impact [7]. |
| Protein Language Models (pLMs) | Large models (e.g., ESM) pre-trained on protein sequences via Masked Language Modeling [7]. | Serve as a base for zero-shot fitness prediction; log-odds scores approximate fitness [7]. |
Addressing Rugged Energy Landscapes and Local Minima Traps
This guide provides troubleshooting support for researchers facing challenges with rugged energy landscapes and local minima when using evolutionary algorithms (EAs) in protein prediction and design.
Frequently Asked Questions
Q1: What practical strategies can prevent my EA from getting stuck in local minima during protein structure prediction?
Incorporating problem-specific knowledge is key. Effective strategies include:
- Using Dynamic Speciation and Fragment Insertion: An EA for protein structure prediction uses a dynamic speciation technique and inserts fragments from a library generated by the Rosetta Quota protocol. This actively promotes population diversity, helping the algorithm escape local minima [61].
- Implementing a Memetic Algorithm: Combine a global search algorithm like Differential Evolution (DE) with a local refinement protocol such as Rosetta Relax. This hybrid, or memetic, approach allows the EA to broadly explore the energy landscape while the local refinement efficiently navigates rugged regions [11].
Q2: How can I improve optimization in ultra-large combinatorial chemical spaces for drug discovery without exhaustive screening?
The REvoLd (RosettaEvolutionaryLigand) protocol is designed for this exact scenario. It screens billion-member "make-on-demand" libraries by exploiting their combinatorial structure [18]. Key parameter settings and methodological choices that aid in navigating the rugged landscape are summarized in the table below.
Table 1: REvoLd Protocol Parameters for Navigating Rugged Landscapes
| Parameter/Method | Recommended Setting | Function in Avoiding Local Minima |
|---|---|---|
| Population Size | 200 initial ligands | Provides sufficient variety to seed the optimization process without excessive runtime cost [18]. |
| Selection Strategy | 50 individuals advance | Balances convergence and exploration; larger populations carry noise, smaller ones become homogeneous [18]. |
| Crossover | Increased number | Enforces variance and recombination between well-suited ligands [18]. |
| Mutation | Low-similarity fragment switch | Keeps well-performing parts intact while enforcing significant changes to small parts of a molecule [18]. |
| Termination | ~30 generations | A good balance; new hits are found up to 400 generations, but multiple independent runs are more effective [18]. |
Q3: Our EA for identifying protein complexes in PPI networks lacks biological consistency. How can we integrate biological knowledge?
Recast the problem as a Multi-Objective Optimization (MOO). You can define one objective based on network topology (e.g., graph density) and another on biological data, such as Gene Ontology (GO) functional similarity. These objectives are often conflicting, which naturally encourages diversity in solutions. Furthermore, design a Gene Ontology-based mutation operator (e.g., a Functional Similarity-Based Protein Translocation Operator). This operator translocates proteins between complexes based on their GO semantic similarity, directly integrating biological knowledge into the search process and steering it toward more meaningful biological solutions [3].
Detailed Experimental Protocols
Protocol 1: Implementing the REvoLd Framework for Ligand Docking
This protocol is designed for ultra-large library screening against a protein target with full ligand and receptor flexibility using the Rosetta software suite [18].
- Initialization: Define the combinatorial chemical space by specifying the lists of substrates and chemical reactions that constitute the "make-on-demand" library.
- Population Seeding: Generate an initial random population of 200 ligands from the defined chemical space.
- Fitness Evaluation: Dock each ligand in the population against the target protein using the flexible docking protocol
RosettaLigandto calculate a binding score (fitness). - Evolutionary Cycle: For approximately 30 generations, perform the following:
- Selection: Select the top 50 scoring individuals as parents for the next generation.
- Reproduction: Apply a series of crossover and mutation operations:
- Perform crossover between high-fitness molecules.
- Apply a mutation that switches single fragments with low-similarity alternatives.
- Apply a mutation that changes the reaction scheme and searches for compatible fragments.
- Offspring Evaluation: Dock the new offspring molecules to calculate their fitness.
- Output: After the final generation, output the highest-scoring molecules discovered during the run. For diverse results, execute multiple independent runs.
The following diagram illustrates the REvoLd workflow and its strategies to combat local minima.
Protocol 2: A Memetic Algorithm (Relax-DE) for Protein Structure Refinement
This protocol combines Differential Evolution (DE) with Rosetta Relax for refining protein structures, such as those generated by AI predictors [11].
- Problem Encoding: Represent a protein conformation as a vector of real numbers encoding the Cartesian coordinates or dihedral angles of its atoms.
- Initialization: Create an initial population of protein conformations, often around a starting model (e.g., from AlphaFold2).
- Memetic Cycle: For each generation, perform the following:
- Differential Evolution: Apply DE's mutation and crossover operations to generate new candidate conformations. This provides a global search mechanism.
- Local Refinement (The Memetic Step): Apply the
Rosetta Relaxprotocol to each new candidate conformation. This local search optimizes the side-chain and backbone positions to find the nearest local minimum in the energy landscape according to theRef2015energy function. - Fitness Evaluation: Calculate the fitness of each refined conformation using the full-atom energy score (e.g., Rosetta's
Ref2015). - Selection: Select the best individuals to form the next population.
- Output: The conformation with the lowest energy score after convergence.
The Scientist's Toolkit
Table 2: Essential Research Reagents and Software for EA-based Protein Research
| Item | Function in the Protocol |
|---|---|
| Rosetta Software Suite | A comprehensive platform for macromolecular modeling. It provides essential tools like RosettaLigand for flexible docking [18] and Rosetta Relax for local energy minimization [11]. |
| Combinatorial Library Definition | The lists of substrates and reaction rules that define a "make-on-demand" chemical space (e.g., Enamine REAL Space). This is the search space for ligand docking EAs like REvoLd [18]. |
| Fragment Library (e.g., from Rosetta) | A collection of short protein structure fragments used in prediction EAs to guide conformational changes and maintain structural plausibility [61]. |
| Gene Ontology (GO) Annotations | A structured vocabulary of biological terms. Used to compute functional similarity, which can serve as an objective in multi-objective EAs or guide a mutation operator [3]. |
| Knowledge-Based Potential / Energy Function (e.g., Ref2015) | A scoring function that estimates the energy of a protein conformation. It is used as the fitness function to guide the EA towards stable, native-like structures [11]. |
Benchmarking EA Performance Against State-of-the-Art Methods
Frequently Asked Questions (FAQs)
Q1: My evolutionary algorithm found a protein structure with low energy, but the RMSD to the experimental target is still high. Why did this happen, and what should I check?
A1: This is a common issue when the force field or scoring function does not perfectly correlate with native structure similarity [9]. We recommend the following troubleshooting steps:
- Verify the Metric: First, confirm that a global RMSD is the appropriate metric. RMSD is highly sensitive to outliers; a single poorly predicted flexible loop or terminus can disproportionately increase the overall value [62]. Check if the high RMSD is global or local.
- Use a Complementary Metric: Calculate the GDTTS score. This metric is more robust to local errors because it measures the largest set of residues that superimpose within a range of distance cutoffs (1, 2, 4, and 8 Å) [63] [64]. A high GDTTS concurrent with a high RMSD often indicates a generally correct fold with specific regional errors.
- Inspect the Force Field: The energy function used by your evolutionary algorithm may be inaccurate. As noted in protein prediction research, "existing force fields are not sufficiently accurate for accurate blind prediction of protein structures without further experimental verification" [9]. Consider using a consensus of multiple force fields or incorporating knowledge-based terms.
Q2: When running the LGA server to calculate GDT_TS, my score for a long protein was lower than for a short one, even though the model looks good. How should I interpret this?
A2: GDT_TS is a percentage score and can be influenced by protein length and the choice of reference structure.
- Check for Length Normalization: The raw GDT_TS output from the LGA server must be adjusted for the length of the reference structure used in your assessment [63]. The formula is:
Final_GDT_TS = Reported_GDT_TS * (N_aligned / N_total_reference_residues)Ensure you are using the correct denominator for your specific experiment. - Review the Superposition: The GDT_TS is calculated based on the optimal superposition found by the LGA algorithm. A poor superposition will lead to an artificially low score. Always use the two-step LGA process (superposition first, then GDT calculation) as recommended by the server documentation [63].
Q3: In my docking experiments, the hit rate enrichment is low. What are the primary strategies to improve it within an evolutionary algorithm framework?
A3: Low enrichment suggests that the algorithm is not effectively distinguishing true binders from decoys.
- Refine the Objective Function: The scoring function used for fitness evaluation is critical. Ensure it balances multiple objectives, such as:
- Energy-based terms (e.g., van der Waals, electrostatics, solvation).
- Knowledge-based terms derived from known protein complexes.
- Biological constraints, such as Gene Ontology (GO) functional similarity, which can guide the search towards biologically plausible interactions [3].
- Incorporate Biological Knowledge: Integrate functional annotations directly into the algorithm's operators. For example, a Functional Similarity-Based Protein Translocation Operator (FS-PTO) can mutate solutions by swapping proteins with high GO term similarity, steering the population towards functionally coherent complexes [3].
- Validate with Standard Datasets: Benchmark your refined protocol on standard PPI networks (e.g., from MIPS) with known complexes to ensure the improvement is generalizable and not an artifact of your specific test case [3].
Troubleshooting Guides
Troubleshooting High RMSD in Protein Structure Prediction
Problem: The protein structure model generated by your evolutionary algorithm has a high RMSD when compared to the experimental reference structure.
| Step | Action & Rationale | Expected Outcome |
|---|---|---|
| 1 | Calculate GDTTS and RMSD simultaneously. Rationale: GDTTS is less sensitive to large, localized errors than RMSD. A good GDT_TS (>~70) with a high RMSD suggests a globally correct fold with local errors [62] [64]. | Identification of whether the error is global or local. |
| 2 | Visually inspect the superposition. Use molecular visualization software (e.g., PyMOL) to overlay your model and the target. Rationale: This will pinpoint the specific regions (e.g., loops, termini, domains) causing the high deviation. | Visual confirmation of error localization (e.g., a single misfolded loop or a domain rotation). |
| 3 | Analyze the evolutionary algorithm's variation operators. Rationale: If operators are too disruptive, they can destroy correctly folded regions. If too conservative, they cannot escape local minima. Tune the balance between exploration and exploitation [9] [11]. | A more stable algorithmic convergence towards lower-energy and lower-RMSD structures. |
| 4 | Verify the energy/force field model. Rationale: The algorithm will optimize for the provided objective function. An inaccurate force field will guide it toward non-native, low-energy states [9]. Test with a different, established force field (e.g., Rosetta's REF2015, CHARMM). | Improved correlation between the algorithm's low-energy solutions and the native structure. |
Troubleshooting GDT_TS Calculation and Interpretation
Problem: GDT_TS scores are inconsistent, unexpectedly low, or difficult to interpret in the context of model quality.
| Step | Action & Rationale | Expected Outcome |
|---|---|---|
| 1 | Follow the standard LGA server protocol exactly. Rationale: GDT_TS is calculated based on a specific superposition. Using non-standard parameters will yield non-comparable results [63]. | A consistent and reproducible GDT_TS value. |
* Run 1 (Superposition): Use parameters -4 -o2 -gdc -lga_m -stral -d:4.0 [63]. |
||
* Run 2 (GDT Calculation): Paste Run 1 output into a fresh form and use parameters -3 -o2 -gdc -lga_m -stral -d:4.0 -al [63]. |
||
| 2 | Correct for reference length. Rationale: The raw output from the LGA server is based on the number of aligned residues. You must normalize it to the full length of your target reference structure [63]. | A final GDT_TS score that accurately reflects the similarity for the entire protein. |
| 3 | Use GDTHA for high-accuracy models. Rationale: For models very close to the native structure, the standard GDTTS (with cutoffs up to 8Å) may not be sensitive enough. The GDT_HA (High Accuracy) version uses stricter distance cutoffs to better discriminate among top models [64]. | A more nuanced assessment of high-quality models. |
| 4 | Check for domain movements. Rationale: In multi-domain proteins, a relative domain shift can result in a mediocre GDTTS even if the individual domains are correctly folded. Calculate GDTTS per domain. | Identification of whether the error stems from intra-domain folding or inter-domain orientation. |
Table 1: Key Performance Metrics for Protein Structure Comparison
| Metric | Calculation Method | Typical Range | Interpretation Guide | Key Advantage |
|---|---|---|---|---|
| RMSD (Root Mean Square Deviation) | 0 Å (perfect) to ∞. Random: >~10Å; Good: <2.0Å [62] [65] | Sensitive to the largest error. Poor for models with local errors but correct global topology [62]. | Simple, intuitive, and widely used. | |
| GDT_TS (Global Distance Test Total Score) | Average percentage of Cα atoms under cutoffs of 1, 2, 4, and 8Å after optimal superposition [63] [64]. | 0-100%. Random: ~20; Good topology: ~70; High accuracy: >90 [63]. | Robust to local errors. Better for assessing global fold correctness [62] [64]. | More representative of structural similarity than RMSD. CASP standard. |
| GDT_HA (Global Distance Test High Accuracy) | Similar to GDT_TS but uses stricter distance cutoffs (e.g., 0.5, 1, 2, 4 Å) [64]. | 0-100%. Used to discriminate among very high-quality models. | Measures high-accuracy details. Low scores indicate small but significant deviations. | Essential for evaluating refinements in high-accuracy regimes. |
| Hit Rate Enrichment | Measures the increase in true positive rate (hit rate) in a virtual screen compared to random selection. | >1 (better than random). Good: >10; Excellent: >50 [62]. | Indicates the efficiency of a docking/scoring method in identifying active compounds. | Directly relevant to drug discovery efforts. |
Table 2: Benchmarking AlphaFold2 on Peptide Structure Prediction (Cα RMSD) Data adapted from McDonald et al. (2022) [65]
| Peptide Category | Number of Peptides | Mean Normalized Cα RMSD (Å per residue) | Performance Notes |
|---|---|---|---|
| α-Helical Membrane-Associated | 187 | 0.098 | Predicted with good accuracy, few outliers. |
| α-Helical Soluble | 41 | 0.119 | More outliers than membrane-associated counterparts. |
| Mixed Sec. Struct. Membrane-Associated | 14 | 0.202 | Largest variation and RMSD values. |
| Disulfide-Rich Peptides | 167 | 0.115 | Predicted with high accuracy. |
Experimental Protocols
Protocol: Calculating GDT_TS Using the LGA Server
This protocol provides a step-by-step method to quantify the similarity between a predicted protein model and an experimental reference structure, a common requirement when benchmarking evolutionary algorithm output [63].
I. Initial Superposition Run
- Access Server: Navigate to the AS2TS/LGA server at
linum.proteinmodel.org. Under "Protein Structure Analysis services," click "LGA = pairwise protein structure comparison." - Input Details:
- Enter your email address.
- In the structure input section, provide the PDB code and chain (e.g.,
7jx6_A) or upload your model and reference structure files. Specify the predicted/model structure first, which will be superposed onto the reference structure specified second.
- Set Parameters: In the parameters field, enter:
-4 -o2 -gdc -lga_m -stral -d:4.0 - Execute: Press the "START" button. Save the full text output for the next step.
II. GDT_TS Calculation Run
- New Session: Open a new browser tab and navigate to the same LGA form. Clear any existing data.
- Input Method: Paste the entire output from Run 1 into Box 4 on the form.
- Set Parameters: Change the parameters to:
-3 -o2 -gdc -lga_m -stral -d:4.0 -al - Execute and Calculate: Press "START". The server will return a GDT_TS value. You must adjust this value based on the length of your reference structure:
Final_GDT_TS = Reported_GDT_TS * (N_aligned / N_total_reference_residues)For CASP comparisons, use the official target length as the denominator [63].
Protocol: Incorporating Gene Ontology into an Evolutionary Algorithm for Complex Detection
This protocol outlines how to integrate biological knowledge to improve the detection of protein complexes in PPI networks using a multi-objective evolutionary algorithm (MOEA), thereby enhancing the biological relevance of results [3].
- Problem Formulation: Recast the complex detection problem as a Multi-Objective Optimization (MOO). Define at least two conflicting objectives to optimize, for example:
- Objective 1: Maximize the topological density (e.g., using Internal Density) of the detected subgraphs.
- Objective 2: Maximize the functional coherence of the subgraphs, measured by the average semantic similarity of Gene Ontology (GO) annotations for proteins within the complex.
- Algorithm Initialization: Initialize the EA population with candidate protein complexes, often as sets of nodes from the PPI network.
- Integration of GO via Mutation: Implement the Functional Similarity-Based Protein Translocation Operator (FS-PTO).
- For a given candidate complex, select a protein within it.
- Calculate the functional similarity (based on GO term overlap) between this protein and others in the network.
- With high probability, translocate (swap) the selected protein with a top functionally similar protein from outside the complex. This operator biases the search towards functionally coherent groupings.
- Evaluation and Selection: Evaluate each candidate complex against the two objectives defined in Step 1. Use a multi-objective selection method (e.g., non-dominated sorting) to create the next generation.
- Validation: Benchmark the algorithm's output against gold-standard complexes (e.g., from MIPS). Compare the quality (e.g., using precision and recall) against methods that use only topological data [3].
Essential Diagrams
Protein Structure Metric Relationship
GDT-TS Calculation Workflow
The Scientist's Toolkit: Research Reagent Solutions
Table 3: Essential Software and Resources for Performance Metric Analysis
| Item Name | Type | Function in Research | Example Use Case |
|---|---|---|---|
| LGA (Local-Global Alignment) | Software Program | The standard method for calculating GDT_TS and performing structure superpositions [63] [64]. | Quantifying the accuracy of a protein structure model generated by an evolutionary algorithm against a PDB reference. |
| AS2TS Server | Web Server | A publicly accessible online interface for running the LGA program [63]. | Researchers without local installation capabilities can calculate GDT_TS and RMSD via a web browser. |
| Gene Ontology (GO) Annotations | Biological Database | A structured, controlled vocabulary for describing gene and gene product functions across species [3]. | Integrating functional knowledge into an EA's fitness function or mutation operator to improve complex detection in PPI networks. |
| Rosetta Relax | Software Protocol | A widely used method for full-atom refinement of protein structures, optimizing side-chain conformations [11]. | Refining the output of a deep learning or evolutionary algorithm prediction to remove atomic clashes and improve local geometry. |
| Differential Evolution (DE) | Algorithm | A powerful evolutionary algorithm for real-valued optimization problems. Often used in memetic algorithms combined with domain-specific heuristics [48] [11]. | Optimizing the atomic coordinates of a protein structure during a refinement step, as in the Relax-DE protocol [11]. |
| CASP & CAPRI Assessments | Community Benchmarks | Blind tests for evaluating protein structure prediction and protein-protein interaction docking methods [62]. | Providing standard datasets and established metrics (like GDT_TS) for objectively benchmarking new evolutionary algorithms against state-of-the-art. |
REvoLd's 869-1622x Hit Rate Improvement Over Random Screening
Frequently Asked Questions (FAQs)
Q1: Why does my evolutionary algorithm converge slowly or produce poor results on my Protein-Protein Interaction (PPI) network?
Slow convergence often stems from improper parameter tuning or a failure to integrate biological knowledge. Relying solely on topological network data can mislead the algorithm. The ABC-DEP method addresses this by using Approximate Bayesian Computation with a Differential Evolution algorithm to more efficiently explore the parameter space and converge on optimal solutions [66]. Furthermore, integrating functional insights from Gene Ontology (GO) annotations directly into the mutation operator (e.g., the FS-PTO operator) provides a biologically meaningful guide, significantly improving the quality and reliability of the identified protein complexes [3].
Q2: How can I effectively integrate biological knowledge to improve my evolutionary algorithm's performance?
Incorporate biological data, such as Gene Ontology (GO) annotations, directly into the algorithm's objective functions and operators. Formulate the complex detection problem as a Multi-Objective Optimization (MOO) that balances both topological density (e.g., internal density) and biological similarity (e.g., functional coherence based on GO terms) [3]. Develop specialized mutation operators, like the Functional Similarity-Based Protein Translocation Operator (FS-PTO), which probabilistically translocates proteins between clusters based on their functional similarity, ensuring results are both densely connected and biologically relevant [3].
Q3: What are the key metrics for evaluating the performance of a complex detection method? Performance should be evaluated using a combination of topological and biological metrics. The table below summarizes key benchmarks from a study comparing a novel multi-objective evolutionary algorithm (MOEA) with other methods on standard PPI datasets [3].
Table 1: Performance Benchmarking of Complex Detection Algorithms
| Algorithm | MIPS Dataset (F-measure) | MIPS Dataset (Functional Homogeneity) | Noisy Yeast PPI (F-measure) |
|---|---|---|---|
| MOEA with FS-PTO (Proposed) | 0.721 | 0.812 | 0.685 |
| MCODE | 0.523 | 0.654 | 0.512 |
| MCL | 0.601 | 0.723 | 0.598 |
| DECAFF | 0.587 | 0.705 | 0.554 |
| GCN-based | 0.634 | 0.741 | 0.601 |
Q4: My algorithm is sensitive to noise in the PPI network. How can I make it more robust? The inherent sparsity and false positives/negatives in PPI data can severely impact results. Algorithms that integrate confidence features during the clustering process show greater robustness [3]. For instance, the DECAFF algorithm employs a probabilistic model to evaluate connection reliability and a hub-removal strategy to reduce noise, which enhances the precision of the detected complexes [3]. Testing on artificially noised networks (e.g., with 10-15% of edges randomly rewired) has demonstrated that MOEA methods incorporating biological knowledge maintain higher performance (F-measure > 0.68) compared to topology-only methods, which can drop below 0.55 [3].
Troubleshooting Guides
Issue: Poor Parameter Estimation in Evolutionary Models
Problem: The parameters for your evolutionary model (e.g., Duplication-Divergence) do not accurately reflect the observed PPI network, leading to unrealistic simulated networks.
Solution: Implement the ABC-DEP (Approximate Bayesian Computation with Differential Evolution and Propagation) methodology for simultaneous model selection and parameter estimation [66].
Experimental Protocol:
- Model Definition: Define a set of candidate evolutionary models (e.g., Duplication-Attachment, Scale-Free) and their parameters (e.g., duplication probability, divergence edge retention probability) [66].
- Spectral Distance Calculation: Use graph spectral analysis to compute the distance between simulated and observed networks. This involves: a. Representing networks as adjacency matrices. b. Calculating the ordered eigenvalues (αi, βi) of these matrices. c. Computing the distance as: ( d(A,B) = \sumi (αi - β_i)^2 ) [66].
- Differential Evolution & Propagation: a. Initialize a population of particles, where each particle represents a model and its parameters. b. For each generation, create new trial particles through mutation and crossover operations from the DE algorithm. c. Simulate a network for each trial particle and compute its spectral distance to the observed network. d. Accept or reject particles based on this distance. Integrate a propagation kernel to share information between accepted particles, refining the posterior distribution.
- Output: The algorithm outputs the posterior probability for each model and the estimated distribution for parameters, identifying the most likely evolutionary mechanism and its configuration [66].
Diagram: Workflow for Evolutionary Model Selection and Parameter Estimation
Issue: Detecting Small or Sparsely Connected Functional Modules
Problem: Standard density-based algorithms overlook small (2-3 proteins) or sparsely connected but functionally coherent protein complexes.
Solution: Recast the problem as a Multi-Objective Optimization (MOO) and use a specialized evolutionary algorithm with a biologically-informed mutation operator [3].
Experimental Protocol:
- Problem Formulation: Define the multi-objective problem. A common approach is to maximize both: a. Topological Objective: Internal Density (ID) of the cluster. b. Biological Objective: Functional Homogeneity, calculated as the average semantic similarity of Gene Ontology terms within the cluster [3].
- Algorithm Initialization: Initialize a population of candidate solutions (protein clusters), often starting with seed proteins or random clusters.
- Evolutionary Operations:
a. Selection: Select parent clusters based on their non-dominated rank and crowding distance in the objective space (common in NSGA-II).
b. Crossover: Combine two parent clusters to create offspring.
c. Mutation (
FS-PTO): This is the key step. For a given protein in a cluster, calculate its functional similarity to all other proteins in the network. Then, with a probability proportional to this similarity, translocate the protein to the cluster where it has the highest average functional similarity [3]. - Evaluation & Iteration: Evaluate the new population of clusters against the two objectives and repeat the process for multiple generations until stable, high-quality complexes are identified.
Diagram: Multi-Objective EA with Functional Mutation
The Scientist's Toolkit: Research Reagent Solutions
Table 2: Essential Resources for Evolutionary Algorithm-based Protein Analysis
| Resource Name | Type | Function / Application |
|---|---|---|
| PPI Network Data | Data | Provides the foundational interaction graph for analysis. Sources include high-throughput experiments (Y2H) and curated databases [3]. |
| Gene Ontology (GO) | Data / Annotation | A structured, controlled vocabulary for describing gene and gene product attributes. Used to calculate functional similarity and homogeneity to guide evolutionary algorithms [3]. |
| Approximate Bayesian Computation (ABC) | Algorithmic Framework | A simulation-based method for performing statistical inference in complex models where the likelihood function is intractable, used for model selection and parameter estimation [66]. |
| Differential Evolution (DE) | Algorithm | A powerful population-based metaheuristic optimization algorithm, effective for real-valued parameter spaces. Integrated with ABC to improve efficiency (ABC-DEP) [66]. |
| Multi-Objective Evolutionary Algorithm (MOEA) | Algorithm | A class of EAs designed to optimize multiple conflicting objectives simultaneously, ideal for balancing topological and biological goals in complex detection [3]. |
| Graph Spectral Analysis | Analytical Method | Uses the eigenvalues of a network's adjacency matrix to compute a low-dimensional representation, enabling efficient and accurate comparison of network structures [66]. |
In protein prediction and design, Evolutionary Algorithms (EA) and Deep Learning (DL) represent two powerful but distinct paradigms. EA methods, like those implemented in the Rosetta suite, excel at exploring vast sequence spaces through iterative mutation and selection. In contrast, DL systems, such as AlphaFold, leverage deep neural networks trained on vast datasets to make highly accurate predictions from single sequences. Framing them as opposing forces, however, overlooks a critical opportunity. Their strengths are profoundly complementary. This technical support guide explores how integrating EA and DL can overcome the limitations of each approach individually, providing troubleshooting and methodological advice for researchers aiming to optimize protein prediction and design workflows. The following FAQs are framed within the broader thesis of improving evolutionary algorithm parameters for protein prediction research.
Frequently Asked Questions (FAQs)
Q1: How can I use AlphaFold predictions to guide my Rosetta-based evolutionary algorithms?
AlphaFold can significantly accelerate and improve the initial phases of an EA workflow. Instead of starting from a random population or a single wild-type sequence, you can use AlphaFold's predicted structures to inform your initial population generation.
- Procedure: First, generate a multiple sequence alignment (MSA) for your protein of interest. Use the MSA to create an initial set of variant sequences. Then, pass these sequences through AlphaFold to obtain predicted 3D structures. Evaluate these structures using Rosetta's scoring functions (e.g.,
ref2015orbeta_nov16). The sequences that produce the most stable and well-folded predicted structures should be selected as the high-fitness starting population for your EA run. - Troubleshooting: If AlphaFold returns a low per-residue confidence score (pLDDT < 70) for your initial sequence, this indicates a low-confidence region or an intrinsically disordered region. For EA, you may choose to focus mutagenesis efforts on high-confidence (pLDDT > 80) structural elements to maintain fold integrity while exploring functional variations [67] [68].
Q2: My EA is converging on a local optimum with poor expression. How can DL models help diversify the sequence space?
A common problem in EA is premature convergence, where the population becomes genetically homogeneous and gets stuck in a local fitness peak. Protein Language Models (PLMs) and other DL sequence models are excellent tools for introducing meaningful diversity.
- Procedure: Integrate a PLM like ESM or a specialized model like AntiBERTy (for antibodies) as a mutation operator within your EA. Instead of purely random mutagenesis, use the PLM to generate novel, but biologically plausible, sequence variations. This can be done by providing the current best sequence to the model and sampling new sequences from its output distribution.
- Troubleshooting: To maintain control over the number of changes, implement a constraint on the Hamming distance (the number of amino acid differences) between the parent and child sequences. Furthermore, you can use a developability filter based on a PLM's pseudo-perplexity score to screen out anomalous sequences that are unlikely to be functional, ensuring that diversification does not compromise protein stability [69] [70].
Q3: When designing a protein with a fixed functional motif, should I use a structure-based (DL) or sequence-based (EA) approach first?
For motif scaffolding—designing a novel protein fold around a known functional motif—a hybrid approach is most effective. RFdiffusion (DL) is highly proficient at generating backbones that scaffold a motif, while ProteinMPNN (DL) and Rosetta (EA) are powerful for sequence design.
- Recommended Workflow:
- Backbone Generation: Use RFdiffusion with your motif's structural coordinates fixed as a constraint to generate hundreds of potential backbone scaffolds.
- Initial Sequence Design: Use ProteinMPNN to rapidly generate sequences that are predicted to fold into each of these backbones.
- Sequence Refinement: Take the top designs from ProteinMPNN and use Rosetta's flexible backbone design protocols for further refinement. Rosetta can perform more detailed energy minimization and side-chain packing, optimizing for stability and function.
- Troubleshooting: If the final designs have high AlphaFold2 (AF2) pAE (predicted Aligned Error) scores around the motif, this indicates low confidence in the relative positioning of the motif and the scaffold. Return to the backbone generation step in RFdiffusion and increase the weight of the motif constraint, or generate more backbone samples [71] [69].
Q4: What are the key limitations of AlphaFold that EAs can help address?
While revolutionary, AlphaFold has known limitations that EAs can help overcome in a design context.
- Multistate Proteins: AlphaFold typically predicts a single, static structure. It struggles with proteins that adopt multiple conformations (multistate) or are inherently flexible. EA approaches, guided by multi-objective optimization, can explicitly design for sequences that are compatible with several distinct target structures.
- Non-Native Conditions: AlphaFold's predictions are based on evolutionary data and may not reflect structures under non-native conditions (e.g., extreme pH or temperature). Rosetta's physics-based energy functions can be used to simulate these conditions and select for stable variants.
- Complex Interactions: Predicting structures of complexes with nucleic acids, small molecules, or other proteins is challenging. While AlphaFold3 addresses this, EAs can be used to optimize protein-protein or protein-ligand interaction energies directly, as calculated by RosettaDock or other docking protocols [72] [73].
Troubleshooting Guides
Problem 1: Low Experimental Success Rate of Computationally Designed Proteins
Potential Cause: The designed sequences, while scoring well in silico, may have low "realism" and contain features that cause aggregation, poor expression, or instability in vivo.
Solutions:
- Incorporate a Language Model Filter: Use a protein language model (e.g., ESM) to calculate the pseudo-perplexity of your designed sequences. Filter out sequences with scores significantly higher than those of natural, well-behaved proteins. This metric has been shown to correlate with experimental success [71] [70].
- Multi-Objective Optimization with EA: Frame your fitness function to optimize for more than one property. Instead of just Rosetta energy, include objectives for:
- Sequence Similarity to Naturals: Penalize sequences that are too distant from the natural sequence distribution.
- Developability: Use simple predictors for aggregation propensity (e.g., CamSol) and net charge. The table below summarizes key metrics to use in a multi-objective EA.
Table 1: Key Objectives for Multi-Objective Optimization in Protein Design
| Objective | Computational Metric | Tool Examples | Rationale |
|---|---|---|---|
| Stability | Rosetta Total Score | Rosetta, PyRosetta |
Lower energy indicates a more stable folded state. |
| Fitness | Functional Activity Score | Custom Oracle, DMS Data | Predicts whether the protein performs its intended function. |
| Expressibility | PLM Pseudo-Perplexity | ESM, AntiBERTy |
Lower scores indicate more "natural," likely expressible sequences. |
| Developability | Aggregation Score, Net Charge | CamSol, SCoV2 |
Filters sequences with poor solubility or non-drug-like properties. |
Problem 2: EA is Computationally Too Expensive for Large Proteins
Potential Cause: The sequence space grows exponentially with protein length, making exhaustive search by EA infeasible.
Solutions:
- Use DL for Pre-screening: Train a surrogate model (e.g., a simple neural network) on a subset of sequence-function data generated from initial EA rounds or from deep mutational scanning (DMS) studies. Use this fast model to pre-screen hundreds of thousands of sequences, only running the computationally expensive Rosetta energy calculations on the top candidates proposed by the surrogate model [70].
- Implement a Hybrid Guided-Search: The following workflow diagram illustrates how to integrate Deep Learning and Evolutionary Algorithms efficiently, creating a closed-loop feedback system that leverages the strengths of both.
Problem 3: Designing for Multiple Functional States or Properties
Potential Cause: Standard DL and EA approaches often optimize for a single, rigid structure or a single objective, which is insufficient for proteins that need to be dynamic or possess multiple functions.
Solutions:
- Explicit Multi-State Design with PG: Use a sequence-space diffusion model like ProteinGenerator (PG), which is explicitly designed for this task. PG can run multiple parallel diffusion trajectories, each conditioned on a different structural constraint (e.g., two different conformations). By averaging the sequence logits from these trajectories, it can design a single sequence that is compatible with multiple target states [71].
- Pareto Optimization in EA: For multi-objective problems (e.g., optimize stability for state A and activity for state B), implement a Pareto frontier selection in your EA. Instead of selecting only the absolute top performers for a single objective, the algorithm maintains a population of solutions that are non-dominated across all objectives. This allows you to explore a trade-off space and select the best compromise sequences for your specific application [70].
Research Reagent Solutions
The following table details key computational tools and resources essential for modern protein research that integrates evolutionary algorithms and deep learning.
Table 2: Essential Computational Tools for Hybrid EA/DL Protein Research
| Tool Name | Type | Primary Function | Role in Hybrid Workflows |
|---|---|---|---|
| AlphaFold DB | Database | Provides over 200 million pre-computed protein structure predictions [67] [74]. | Source of reliable structural data for initial population generation and fitness evaluation in EA. |
| Rosetta | Software Suite | A comprehensive platform for protein structure prediction, design, and docking using physics-based and knowledge-based scoring functions [69]. | Provides high-resolution energy evaluation and refinement for sequences proposed by DL models. |
| ProteinMPNN | Deep Learning Tool | A neural network for fast and robust protein sequence design given a backbone structure [71] [69]. | Rapidly generates potential sequences for backbones generated by RFdiffusion or other DL tools. |
| RFdiffusion | Deep Learning Tool | A diffusion model for generating novel protein structures and scaffolding functional motifs [71] [69]. | Creates novel backbone scaffolds based on user-defined constraints, which can then be passed to EA for sequence optimization. |
| ESM | Protein Language Model | A large-scale transformer model trained on millions of protein sequences [70]. | Used as a fitness proxy for sequence "naturalness," a filter for poor designs, and a guided mutation operator in EA. |
| ProteinGenerator | Deep Learning Tool | A sequence-space diffusion model based on RoseTTAFold for joint sequence-structure generation [71]. | Directly designs sequences guided by desired attributes; capable of multi-state design. |
Frequently Asked Questions (FAQs)
Q1: Why does my protein structure prediction fail on low-homology or orphan proteins, and how can I improve it?
Prediction failures for low-homology or orphan proteins primarily occur because state-of-the-art folding pipelines like AlphaFold depend heavily on evolutionary information from Multiple Sequence Alignments (MSAs). When MSAs are sparse, shallow, or noisy, they contain insufficient co-evolutionary information, leading to inaccurate models [13] [75]. To improve predictions:
- Use MSA Enhancement Tools: Employ MSA design frameworks like PLAME, which generates augmented MSAs using evolutionary embeddings from protein language models, specifically targeting low-homology scenarios [75].
- Engineer MSA Inputs: Utilize diverse MSA generation strategies, including different sequence databases, alignment tools, and domain-based segmentation, as demonstrated by the MULTICOM4 system [76].
- Apply Extensive Model Sampling: Generate a large number of structural models to explore a wider conformation space, increasing the chance of capturing a correct fold [76].
Q2: How can I assess if my MSA is too "noisy" or of poor quality, and what are the corrective steps?
You can assess MSA quality through both direct and indirect metrics:
- Direct MSA Analysis: Examine the MSA's depth (number of sequences) and diversity. An MSA dominated by a few sequences or containing many misaligned regions provides a poor evolutionary signal [75].
- Indirect Quality Metrics: After structure prediction, examine the model's self-reported confidence scores, such as AlphaFold's pLDDT (predicted local distance difference test) or PAE (predicted aligned error). Consistently low pLDDT scores (e.g., below 70) or high PAE across many models may indicate underlying issues with the input MSA [77] [78].
- Corrective Steps: If noise is suspected:
- MSA Filtering and Clustering: Use tools like AFcluster to perform MSA clustering (e.g., with the DBSCAN algorithm). This isolates dense, coherent sequence subgroups, reducing the influence of outlier or noisy sequences [78].
- Subsampling: Experiment with different MSA subsampling strategies (e.g., varying the
max_msaparameter in ColabFold) to find a subset of sequences that yields a more confident structural model [78].
Q3: My model generation works well, but my final model selection is poor. How can I improve model ranking?
This is a common challenge, particularly for "hard" targets. Standard quality scores like plDDT can be unreliable for ranking [76].
- Implement Consensus Ranking: Use multiple, complementary Model Quality Assessment (QA) methods instead of relying on a single score. Combine scores from different tools and use model clustering to select the most representative high-quality structure [76].
- Incorporate Experimental Data: When available, use low-resolution experimental data or proteomics data (e.g., from cross-linking mass spectrometry) to validate and rank predicted models, as this can unambiguously identify near-native states [77].
Q4: Can noise ever be beneficial in evolutionary optimization processes?
Yes, under specific circumstances, noise can be beneficial. Theoretical analyses of evolutionary algorithms (EAs) on rugged landscapes have shown that prior noise can help algorithms escape from local optima by blurring the fitness landscape, allowing the algorithm to perceive the underlying gradient and avoid getting trapped [79] [80]. However, this effect is highly problem-dependent, and on functions like LeadingOnes, noise is overwhelmingly detrimental [79].
Troubleshooting Guides
Problem: Low Prediction Confidence (pLDDT) on Single-Chain Proteins
Symptoms
- AlphaFold2/3 outputs a 3D model with large regions in low confidence (pLDDT < 70, often colored orange or red).
- The predicted aligned error (PAE) plot shows high error between many residue pairs, indicating low confidence in relative positioning.
Diagnosis Flowchart
Resolution Steps
- MSA Enhancement:
- Action: Use a tool like PLAME to generate an augmented MSA. It creates synthetic but evolutionarily plausible sequences to deepen the alignment [75].
- Protocol: Input your target sequence and any initial MSA into the PLAME framework. Use its built-in conservation-diversity loss to generate a balanced, high-fidelity MSA for downstream folding.
- MSA Clustering for Noise Reduction:
- Action: Apply MSA clustering to filter out noise [78].
- Protocol:
- Use AFcluster with the DBSCAN algorithm.
- Exclude sequences with >25% gaps before clustering.
- Cluster the MSA using parameters (e.g., epsilon distance) that identify dense core sequence regions.
- Use the resulting clustered MSA for structure prediction.
- Extensive Model Sampling & Ranking:
- Action: Increase the number of models generated and use advanced ranking [76].
- Protocol:
- In your prediction run (e.g., using local ColabFold), significantly increase the number of models sampled (e.g., generate 25-50 models instead of 5).
- Do not rely solely on pLDDT for picking the best model. Use a combination of at least two other QA methods (e.g., VoroMQA, ModFold), and select the model that ranks highest across the board or is the center of a high-scoring cluster.
Problem: Inaccurate Multi-Chain (Complex) Structure Predictions
Symptoms
- The predicted quaternary structure has clashing chains or an unnatural conformation.
- The PAE plot shows high error between different protein chains, indicating low confidence in their relative orientation.
- The model does not match known experimental data (e.g., from cross-linking mass spectrometry).
Diagnosis Flowchart
Resolution Steps
- Build Paired MSAs:
- Action: Ensure your MSA reflects the multimeric state. Do not use unpaired single-chain MSAs [77] [78].
- Protocol: For a homodimer, duplicate the MSA sequences to create a paired homooligomeric MSA. For hetero-complexes, use tools that create concatenated MSAs with diagonal padding to correctly represent the inter-chain co-evolution [78].
- Sample Multiple Conformational States:
- Action: Use MSA clustering to capture different conformational states of the complex [78].
- Protocol: Feed the paired MSA through AFcluster-Multimer. This will generate models for different clusters, potentially representing active/inactive states or other conformational changes upon binding.
- Incorporate Experimental Restraints:
- Action: Use low-resolution experimental data to guide and validate predictions [77].
- Protocol: If you have cross-linking mass spectrometry data, calculate the distances between cross-linked residues in your predicted models. Discard models where these distances are violated beyond the linker length. This filters unrealistic predictions.
- Divide-and-Conquer for Large Complexes:
- Action: For large, challenging complexes, break the problem into smaller parts [76].
- Protocol: As done in CASP16, split a long filamentous complex into overlapping segments. Predict the structure of each segment independently using the above methods, then superimpose them on the overlapping regions to assemble a full-length model.
Table 1: Evolutionary Algorithm Robustness to Noise
This table summarizes key findings from theoretical analyses of how evolutionary algorithms (EAs) perform under different noise conditions, providing insights applicable to stochastic optimization in protein research. Data is drawn from analyses of the (1+1) EA on benchmark functions [79].
| Noise Model | Noise Level (p) | Expected Optimization Time on LeadingOnes | Performance Characterization |
|---|---|---|---|
| One-bit prior noise | p = O(1/n²) | Θ(n²) | Polynomial (Efficient) |
| One-bit prior noise | p = Θ((log n)/n²) | Polynomial | Polynomial (Efficient) |
| One-bit prior noise | p = ω((log n)/n²) | Superpolynomial | Performance Degradation |
| One-bit prior noise | p = Ω(1/n) | exp(Θ(n)) | Exponential (Inefficient) |
| - | Offspring Population Size λ ≥ 3.42 log n | Can handle higher noise levels | Increased Robustness |
Table 2: MSA Enhancement Impact on Prediction Accuracy
This table compiles data on how improving Multiple Sequence Alignments (MSAs) enhances the quality of protein structure predictions, as measured by standard metrics like TM-score and GDT-TS [76] [75].
| Method / Strategy | Key MSA Metric Improved | Impact on Structure Prediction | Use Case Context |
|---|---|---|---|
| PLAME Framework [75] | Conservation-Diversity Balance | State-of-the-art gains in lDDT & TM-score for low-homology/orphan proteins | Low-homology & Orphan Proteins |
| MULTICOM4 System [76] | MSA Diversity & Quality via Engineering | Average TM-score of 0.902 on 84 CASP16 domains; 73.8% of targets achieved high accuracy (TM-score>0.9) | Difficult Targets (CASP16) |
| AFcluster-Multimer [78] | Conformational State Coverage | Accurately predicted active/inactive states and oligomeric states in test cases (CXCR4, GCGR, Lymphotactin) | Multi-chain & Conformational Landscapes |
| Standard AlphaFold3 [76] | - (Baseline) | Ranked 29th in CASP16 (Z-score: 25.71) | General Context (Baseline) |
Table 3: Key Software Tools for Robustness Testing
| Tool Name | Primary Function | Relevance to MSA Depth/Nooise |
|---|---|---|
| AlphaFold2/3 [13] [76] | Protein Structure Prediction | Core folding engine whose performance is critically dependent on input MSA quality and depth. |
| ColabFold [78] [75] | Fast, Accessible Protein Folding | Provides MSA subsampling and tuning options, useful for rapid prototyping and diagnostics. |
| PLAME [75] | MSA Enhancement & Generation | Directly addresses MSA depth issues by generating evolutionarily plausible sequences for low-homology targets. |
| AFcluster [78] | MSA Clustering & Sampling | Reduces noise in MSAs by identifying dense sequence clusters, helping to predict conformational landscapes. |
| MMseqs2 [78] [75] | Rapid MSA Construction | Standard tool for building initial MSAs from sequence databases. |
| MULTICOM4 QA [76] | Model Quality Assessment & Ranking | Ensemble ranking tool to select the best structural model from many sampled decoys, overcoming poor plDDT ranking. |
Frequently Asked Questions
1. My evolutionary algorithm for protein-ligand docking is converging too quickly on suboptimal solutions. How can I improve its exploration of the chemical space? Quick convergence often indicates a lack of diversity in your population. The REvoLd protocol successfully addressed this by implementing a multi-faceted strategy [18]:
- Increase Crossovers: Promote more genetic recombination between your fittest individuals to generate novel combinations.
- Introduce Low-Similarity Mutations: Implement a mutation step that replaces fragments of promising molecules with highly dissimilar alternatives, preserving good sections while forcing exploration.
- Vary Reaction Rules: Add a mutation that changes the reaction used to construct the molecule, opening up entirely new areas of the combinatorial library.
- Promote Less-Fit Individuals: Allow a second round of crossover and mutation that excludes the top performers, giving worse-scoring ligands a chance to contribute their genetic information.
2. I need to run large-scale protein structural alignment searches, but my computational resources are limited. What are my options? For researchers with standard computing hardware, efficient tools like SARST2 are designed precisely for this scenario [81]. It employs a sophisticated "filter-and-refine" strategy to minimize computational load.
- Strategy: Fast, coarse filters (using linear structural encoding and machine learning) quickly discard irrelevant proteins from the database. Only the remaining candidate homologs undergo slower, accurate alignment and scoring.
- Performance: In benchmarks searching the massive AlphaFold Database (over 200 million structures), SARST2 completed a search in 3.4 minutes using 9.4 GiB of memory. This was significantly faster and less memory-intensive than Foldseek (18.6 min, 19.6 GiB) and BLAST (52.5 min, 77.3 GiB) [81].
3. How can I efficiently optimize hyperparameters for a machine learning model used in bioinformatics, such as for predicting protein-protein interactions? Evolutionary algorithms like Differential Evolution (DE) are highly effective for hyperparameter tuning. A recent study used a modified DE to optimize a Deep Forest model for host-pathogen protein-protein interaction prediction [48].
- Method: The standard DE algorithm, which can randomly select suboptimal solutions, was modified to use a weighted and adaptive technique. This change selects the best-fitted donor vectors to construct new solutions, leading to more efficient convergence.
- Outcome: This optimized approach outperformed other methods, including traditional Bayesian optimization and genetic algorithms, achieving an accuracy of 89.3% [48].
4. What is a reasonable number of generations and population size to start with for an evolutionary algorithm in drug discovery? While problem-dependent, benchmarks from the REvoLd tool offer a robust starting point [18]:
- Initial Population Size: A pool of 200 randomly generated ligands provides sufficient variety to initiate the optimization process without excessive runtime costs.
- Generations: Running the algorithm for 30 generations typically strikes a good balance. High-quality solutions often emerge after ~15 generations, but discovery rates tend to flatten after 30.
- Selection for Reproduction: Allowing the top 50 individuals from a generation to advance to the next round was found to be optimal, balancing effectiveness and avoidance of noise.
5. How can I handle uncertainty in model parameters, such as real-valued and uncertain activity durations in project scheduling for research pipelines? A simulation-assisted evolutionary framework is a powerful approach for these stochastic problems [82]. The key is to reduce the high computational cost of simulating all possible scenarios (e.g., different activity durations) for every individual in every generation.
- Efficient Strategy: Instead of full simulation at every step, you can evaluate all individuals in a generation using a single scenario based on the mean values of uncertain parameters. The average fitness of the best individual is then calculated across all scenarios. This strategy significantly reduces computational time while maintaining acceptable solution quality [82].
Performance Benchmarks and Resource Requirements
The table below summarizes quantitative data from recent research on the computational efficiency of various algorithms in bioinformatics.
Table 1: Computational Performance Benchmarking of Bioinformatics Algorithms
| Algorithm / Tool | Primary Application | Reported Performance & Resource Metrics | Comparative Performance |
|---|---|---|---|
| REvoLd [18] | Virtual screening of ultra-large chemical libraries | Docks 49,000 - 76,000 unique molecules per target; improves hit rates by factors of 869–1622. | Far more efficient than exhaustive screening (billions of compounds). |
| SARST2 [81] | Protein structural alignment search | Search time: 3.4 min; Memory: 9.4 GiB (AlphaFold DB, 32 CPUs). Database storage: 0.5 TiB. | Faster and less memory-intensive than Foldseek (18.6 min, 19.6 GiB) and BLAST (52.5 min, 77.3 GiB). |
| Modified DE for Deep Forest [48] | Hyperparameter optimization for host-pathogen PPI prediction | Achieved 89.3% accuracy; outperformed standard Bayesian optimization, Genetic Algorithms, and Evolutionary Strategies. | Demonstrated competitive time and memory efficiency. |
Experimental Protocols for Efficiency Analysis
Protocol 1: Benchmarking an Evolutionary Algorithm for Protein-Ligand Docking This protocol is based on the REvoLd benchmark study [18].
- Define the Chemical Space: Select a make-on-demand combinatorial library (e.g., Enamine REAL space) defined by its constituent substrates and reaction rules.
- Set Algorithm Parameters:
- Initialize with a population of 200 random molecules.
- Set the number of generations to 30.
- Select the top 50 individuals for reproduction in each generation.
- Configure genetic operators: crossover, low-similarity fragment mutation, and reaction-rule mutation.
- Run and Monitor: Execute multiple independent runs (e.g., 20) for each target protein. Track the diversity of discovered scaffolds and the development of docking scores over generations to monitor convergence and exploration.
- Evaluate Performance: Calculate the hit rate enrichment by comparing the number of high-scoring ligands found by the EA against a random selection from the same chemical space.
Protocol 2: Evaluating Structural Search Tool Efficiency This protocol is derived from the SARST2 accuracy and speed evaluations [81].
- Prepare Datasets: Use a standard query set (e.g., Qry400 with 400 proteins) and a target database with known structural homologs (e.g., from SCOP).
- Execute Searches: Run the structural search tool (e.g., SARST2, Foldseek, BLAST) against the target database. Ensure tools are configured to retrieve a sufficient number of hits to allow for 100% recall potential.
- Measure Metrics:
- Accuracy: Calculate precision and recall by verifying if retrieved subjects are true family-level homologs.
- Speed: Record the total wall-clock time for the search to complete.
- Resource Use: Monitor peak memory usage during execution.
- Compare Results: Compare the average precision, search time, and memory usage against state-of-the-art methods.
Workflow Visualization
1. Standard Evolutionary Algorithm Flow
2. Optimized Framework for Uncertain Parameters
The Scientist's Toolkit
Table 2: Essential Research Reagents and Computational Tools
| Item Name | Function / Application | Key Features / Notes |
|---|---|---|
| REvoLd (RosettaEvolutionaryLigand) [18] | Evolutionary algorithm for screening ultra-large make-on-demand compound libraries. | Integrates with RosettaLigand for flexible docking; exploits combinatorial library structure to avoid exhaustive enumeration. |
| SARST2 [81] | Rapid protein structural alignment against massive databases (e.g., AlphaFold DB). | Uses a filter-and-refine strategy with machine learning; enables searches on standard PCs due to low memory and storage needs. |
| Modified Differential Evolution [48] | Hyperparameter optimization for machine learning models in bioinformatics. | Uses a weighted, adaptive donor vector technique for more efficient selection than random methods. |
| AlphaFold Database [81] [83] | Repository of over 200 million predicted protein structures. | Serves as a key target database for structural searches; requires efficient tools to navigate its scale. |
| Enamine REAL Space [18] | A make-on-demand combinatorial library of billions of compounds. | Represents a "golden opportunity" for virtual drug discovery; used as a benchmark chemical space for EAs. |
| RosettaLigand [18] | A flexible protein-ligand docking protocol within the Rosetta software suite. | Used for fitness evaluation (docking scoring) in the REvoLd algorithm, accounting for full ligand and receptor flexibility. |
Conclusion
Evolutionary algorithms represent a powerful and versatile approach for protein prediction challenges, particularly when carefully parameterized and integrated with domain-specific knowledge. The optimization of key parameters—such as population size, generation count, and specialized genetic operators—directly impacts their ability to efficiently navigate complex conformational spaces and avoid local minima. When benchmarked against other methods, EAs demonstrate remarkable performance in specific applications like ultra-large library screening and multi-objective optimization, achieving orders-of-magnitude improvements in hit rates. The future of EA-optimized protein prediction lies in deeper integration with deep learning frameworks, development of adaptive parameter control systems, and application to emerging challenges in predicting protein dynamics and complex interactions. These advances will significantly accelerate rational drug design and expand our understanding of protein function in biomedical research.
References
- 1. Beyond static structures: protein dynamic conformations ... [https://pmc.ncbi.nlm.nih.gov/articles/PMC12262120/]
- 2. towards solving the protein-folding problem computationally [https://pmc.ncbi.nlm.nih.gov/articles/PMC6790072/]
- 3. A multi-objective evolutionary algorithm for detecting ... [https://www.nature.com/articles/s41598-025-01667-y]
- 4. Critical assessment of AI-based protein structure prediction [https://www.sciencedirect.com/science/article/pii/S2950363925000353]
- 5. Multiple conformational states assembly of multidomain ... [https://www.sciencedirect.com/science/article/pii/S2667325824002103]
- 6. Evolutionary Algorithms for the Inverse Protein Folding ... [https://link.springer.com/rwe/10.1007/978-3-032-00385-0_59]
- 7. Evolutionary Profiles for Protein Fitness Prediction [https://arxiv.org/html/2510.07286v1]
- 8. Mapping the Conformation Space of Wildtype and Mutant H ... [https://journals.plos.org/ploscompbiol/article?id=10.1371/journal.pcbi.1004470]
- 9. Protein structure prediction using the evolutionary ... [https://pubmed.ncbi.nlm.nih.gov/36780132/]
- 10. Metaheuristics for protein structure prediction [https://www.sciencedirect.com/science/article/pii/S2468227625002893]
- 11. Protein structure refinement with a memetic algorithm [https://link.springer.com/article/10.1007/s11047-025-10027-8]
- 12. Large protein databases reveal structural complementarity ... [https://www.nature.com/articles/s41467-025-63250-3]
- 13. Protein structure prediction via deep learning: an in-depth ... [https://pmc.ncbi.nlm.nih.gov/articles/PMC12003282/]
- 14. Co-evolutionary fitness landscapes for sequence design [https://pmc.ncbi.nlm.nih.gov/articles/PMC6147258/]
- 15. Deciphering protein evolution and fitness landscapes with ... [https://www.nature.com/articles/s41467-019-13633-0]
- 16. Solution of the protein structure prediction problem at last [https://pmc.ncbi.nlm.nih.gov/articles/PMC9815721/]
- 17. Title: Protein Structure Prediction: AlphaFold Pitfalls, Fixes ... [https://medium.com/@QuarkAndCode/title-protein-structure-prediction-alphafold-pitfalls-fixes-validation-9817386a564f]
- 18. Ultra-large library screening with an evolutionary algorithm ... [https://www.nature.com/articles/s42004-025-01758-x]
- 19. Evolution algorithm with adaptive genetic operator and ... [https://www.nature.com/articles/s41598-025-91245-z]
- 20. Protein structure prediction with energy minimization and ... [https://pmc.ncbi.nlm.nih.gov/articles/PMC10165305/]
- 21. Improving the Physical Realism and Structural Accuracy of ... [https://pmc.ncbi.nlm.nih.gov/articles/PMC3218324/]
- 22. High-accuracy protein complex structure modeling based ... [https://www.nature.com/articles/s41467-025-65090-7]
- 23. REvoLd: Ultra-Large Library Screening with an ... [https://arxiv.org/html/2404.17329v1]
- 24. CACHE: Utilizing Ultra-Large Library Screening in Rosetta ... [https://chemrxiv.org/engage/chemrxiv/article-details/68012c7ee561f77ed47f49ed]
- 25. REvoLd: Ultra-Large Library Screening with an ... [https://pubmed.ncbi.nlm.nih.gov/38711437/]
- 26. Using contrast patterns between true complexes and ... [https://www.nature.com/articles/srep21223]
- 27. A multiobjective approach for identifying protein complexes and... [https://link.springer.com/article/10.1186/s13015-015-0056-2]
- 28. A multi - objective evolutionary algorithm for detecting protein... [https://pmc.ncbi.nlm.nih.gov/articles/PMC12081708/]
- 29. Evolutionary analysis and interaction prediction for protein ... [https://pmc.ncbi.nlm.nih.gov/articles/PMC5590856/]
- 30. Memetic Algorithms Outperform Heuristics in Protein ... [https://www.linkedin.com/posts/pablo-moscato-0040052b_protein-structure-refinement-with-a-memetic-activity-7341628129775374336-ivQJ]
- 31. A multi-population memetic algorithm for the 3-D protein ... [https://www.sciencedirect.com/science/article/abs/pii/S2210650219304791]
- 32. Iterative Hybridize: protein model refinement protocol [https://docs.rosettacommons.org/docs/latest/IterativeHybridize]
- 33. What's Hot in 2025: Protein Structure Prediction using AI [https://www.criver.com/eureka/whats-hot-2025-protein-structure-prediction-using-ai]
- 34. Enhancing functional proteins through multimodal inverse ... [https://www.nature.com/articles/s41467-025-65175-3]
- 35. Opportunities and challenges in design and optimization of ... [https://pmc.ncbi.nlm.nih.gov/articles/PMC7616297/]
- 36. Protein sequence design with a learned potential [https://www.nature.com/articles/s41467-022-28313-9]
- 37. Protein Inverse Folding From Structure Feedback [https://arxiv.org/html/2506.03028v1]
- 38. Functional Protein Dynamics Directly from Sequences - PMC [https://pmc.ncbi.nlm.nih.gov/articles/PMC10009744/]
- 39. Benchmarking inverse folding models for antibody CDR ... [https://journals.plos.org/plosone/article?id=10.1371/journal.pone.0324566]
- 40. Evolutionary Profiles for Protein Fitness Prediction [https://arxiv.org/abs/2510.07286]
- 41. Evolutionary Profiles for Protein Fitness Prediction - Paper Detail [https://deeplearn.org/arxiv/642756/evolutionary-profiles-for-protein-fitness-prediction]
- 42. Knowledge-based hyper-parameter adaptation of multi ... [https://www.sciencedirect.com/science/article/abs/pii/S0925231225013050]
- 43. An improved hyperparameter optimization framework for ... [https://www.nature.com/articles/s41598-023-32027-3]
- 44. Machine and deep learning methods for predicting 3D ... [https://pmc.ncbi.nlm.nih.gov/articles/PMC10942493/]
- 45. Deep-learning-based single-domain and multidomain ... [https://www.nature.com/articles/s41587-025-02654-4]
- 46. DPFunc: accurately predicting protein function via deep ... [https://www.nature.com/articles/s41467-024-54816-8]
- 47. Paddy: an evolutionary optimization algorithm for chemical ... [https://pubs.rsc.org/en/content/articlehtml/2025/dd/d4dd00226a]
- 48. An optimized deep-forest algorithm using a modified ... [https://www.sciencedirect.com/science/article/pii/S2001037025000212]
- 49. Advancements in multimodal differential evolution [https://link.springer.com/article/10.1007/s10462-025-11314-7]
- 50. Computational peptide discovery with a genetic ... [https://pmc.ncbi.nlm.nih.gov/articles/PMC11416381/]
- 51. Evolution and Trends of the Exploration–Exploitation Balance ... [https://pmc.ncbi.nlm.nih.gov/articles/PMC12383399/]
- 52. A Visual Guide to Evolution Strategies | 大トロ [https://blog.otoro.net/2017/10/29/visual-evolution-strategies/]
- 53. Balancing exploration and exploitation in multiobjective ... [https://www.sciencedirect.com/science/article/abs/pii/S0020025519304499]
- 54. Difference between exploration and exploitation in genetic ... [https://stackoverflow.com/questions/20161980/difference-between-exploration-and-exploitation-in-genetic-algorithm]
- 55. A systematic analysis of regression models for protein ... - PMC [https://pmc.ncbi.nlm.nih.gov/articles/PMC11095727/]
- 56. Balancing Exploration and Exploitation for Solving Large ... [https://arxiv.org/abs/2205.10052]
- 57. Deep-Insights Guided Evolutionary Algorithm for Optimization [https://www.sciencedirect.com/science/article/abs/pii/S0957417425031537]
- 58. REvoLd: Accelerating Drug Discovery Through ... [https://cbirt.net/revold-accelerating-drug-discovery-through-evolutionary-algorithm-driven-ultra-large-library-screening-in-rosetta/]
- 59. An Expert Knowledge -Guided Mutation for... | SpringerLink Operator [https://link.springer.com/chapter/10.1007/978-3-540-75286-8_4]
- 60. A multi-objective evolutionary approach to the protein ... [https://pmc.ncbi.nlm.nih.gov/articles/PMC1629082/]
- 61. Protein structure prediction with evolutionary algorithm [https://pubmed.ncbi.nlm.nih.gov/40973395/]
- 62. Methods of protein structure comparison - PMC [https://pmc.ncbi.nlm.nih.gov/articles/PMC4321859/]
- 63. Calculating GDT TS - Proteopedia, life in 3D [https://proteopedia.org/wiki/index.php/Calculating_GDT_TS]
- 64. Global distance test [https://en.wikipedia.org/wiki/Global_distance_test]
- 65. Benchmarking AlphaFold2 on Peptide Structure Prediction [https://pmc.ncbi.nlm.nih.gov/articles/PMC9883802/]
- 66. Evolutionary model selection and parameter estimation for ... [https://pmc.ncbi.nlm.nih.gov/articles/PMC4719153/]
- 67. AlphaFold Protein Structure Database [https://alphafold.ebi.ac.uk/]
- 68. AlphaFold: Five Years of Impact [https://deepmind.google/blog/alphafold-five-years-of-impact/]
- 69. 1-day Protein Design workshop at Summer RosettaCon 2025 [https://rosettacommons.org/2025/06/03/1-day-protein-design/]
- 70. Large Language Model is Secretly a Protein Sequence ... [https://arxiv.org/html/2501.09274v1]
- 71. Multistate and functional protein design using ... [https://www.nature.com/articles/s41587-024-02395-w]
- 72. Challenges and future directions in protein structure ... [https://www.elspub.com/doi/10.55092/bi20250005]
- 73. Advancing protein structure prediction beyond AlphaFold2 [https://www.sciencedirect.com/science/article/abs/pii/S0959440X2500003X]
- 74. AlphaFold is five years old — these charts show how it ... [https://www.nature.com/articles/d41586-025-03886-9]
- 75. PLAME: Lightweight MSA Design Advances Protein ... [https://arxiv.org/html/2507.07032v2]
- 76. Boosting AlphaFold protein tertiary structure prediction ... [https://www.nature.com/articles/s42003-025-08960-6]
- 77. Challenges in bridging the gap between protein structure ... [https://pmc.ncbi.nlm.nih.gov/articles/PMC11623436/]
- 78. MSA clustering enhances AF-Multimer's ability to predict ... [https://pmc.ncbi.nlm.nih.gov/articles/PMC11671036/]
- 79. Analysing the Robustness of Evolutionary Algorithms to Noise: Refined Runtime Bounds and an Example Where Noise is Beneficial | Algorithmica [https://link.springer.com/article/10.1007/s00453-020-00671-0]
- 80. [PDF] On the robustness of evolutionary algorithms to noise: refined results and an example where noise helps | Semantic Scholar [https://www.semanticscholar.org/paper/On-the-robustness-of-evolutionary-algorithms-to-and-Sudholt/b79f74e76203e8942a7ce02be699188abb93e3ea]
- 81. SARST2 high-throughput and resource-efficient protein ... [https://www.nature.com/articles/s41467-025-63757-9]
- 82. An evolutionary approach for resource constrained project ... [https://www.sciencedirect.com/science/article/abs/pii/S0305054820302215]
- 83. AI Models For Protein Structure Prediction [https://frontlinegenomics.com/ai-models-for-protein-structure-prediction/]