Phylodynamic Inference of R0: A Comprehensive Guide from Foundations to Frontiers in Biomedical Research
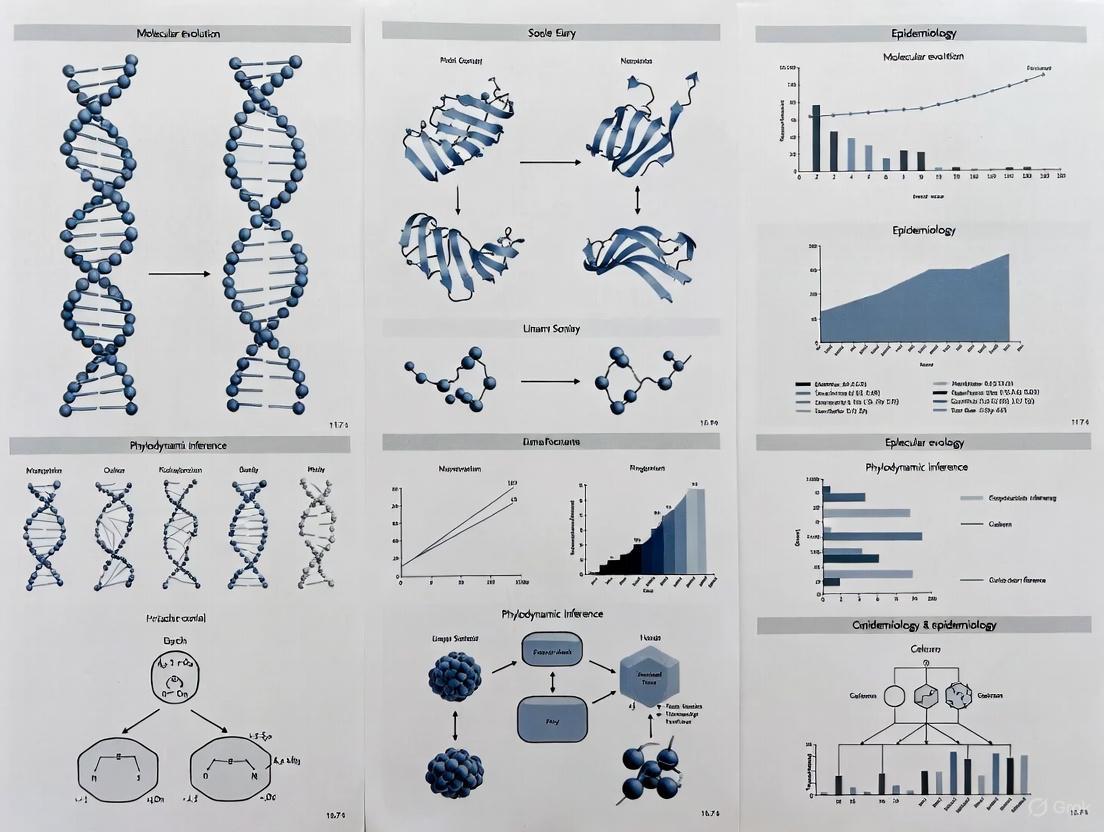
This article provides a comprehensive overview of phylodynamic inference for estimating the basic reproduction number (R0), a critical epidemiological parameter.
Phylodynamic Inference of R0: A Comprehensive Guide from Foundations to Frontiers in Biomedical Research
Abstract
This article provides a comprehensive overview of phylodynamic inference for estimating the basic reproduction number (R0), a critical epidemiological parameter. Tailored for researchers, scientists, and drug development professionals, it explores the foundational principles of integrating phylogenetic analysis with epidemiological models. The scope spans methodological approaches for diverse pathogens, including viruses and bacteria, addresses key challenges in model specification and data sampling, and validates phylodynamic estimates against traditional epidemiological data. By synthesizing recent advances and real-world applications from SARS-CoV-2, Ebola, HIV, and pandemic Escherichia coli, this guide serves as a vital resource for leveraging genomic surveillance to understand and combat infectious disease dynamics.
The Foundation of Phylodynamics: Bridging Viral Evolution and Epidemiological Dynamics
Defining Phylodynamics and the Basic Reproduction Number (R0)
Phylodynamics is an interdisciplinary field that studies how epidemiological, immunological, and evolutionary processes act and interact to shape the phylogenetic trees of pathogens [1] [2]. The term was introduced by Grenfell et al. in 2004 to describe the "melding of immunodynamics, epidemiology, and evolutionary biology" required to analyze interacting evolutionary and ecological processes, particularly for rapidly evolving viruses where both processes operate on similar timescales [3]. This approach leverages the genomic signature left by ongoing evolution during transmission to generate evidence about pathogen spread and source, corroborating and enhancing findings from traditional epidemiological modelling [4].
The Basic Reproduction Number (R₀) is an epidemiological metric describing the average number of secondary infections generated by a single infectious individual in a completely susceptible population [5] [6] [7]. Also called the basic reproduction ratio or rate, R₀ represents the combined effects of a pathogen's phenotypic transmission propensity alongside relevant environmental and social determinants of transmission rate [4]. This metric serves as a threshold value: an outbreak is expected to continue if R₀ > 1 and end if R₀ < 1 [5] [7].
Theoretical Framework: Linking Evolution and Epidemiology
Phylodynamic inference connects evolutionary models of pathogen population size to epidemiological models of infected population size [4]. This integration allows researchers to infer geospatial transmission patterns, networks, and key epidemiological parameters from genetic sequence data [8]. The field operates on the principle of measurable evolution, where pathogen molecular evolution occurs on the same timescale as transmission, making accumulated genetic diversity informative about transmission timing [4].
Two foundational modelling approaches underpin phylodynamics:
Coalescent Theory: A backward-in-time model describing how the ancestry of sampled populations relates to demographic history, where internal nodes correspond to coalescence times into common ancestors [4] [2]. This approach estimates effective population size (Nₑ) through time, which can be translated into epidemiological parameters using knowledge of generation time and offspring distribution variance [9].
Birth-Death Models: Forward-in-time models where birth events represent transmissions and death events represent recoveries, deaths, or sampling [3] [4]. These models directly parameterize epidemiological processes like transmission and removal rates.
The following diagram illustrates the core conceptual framework of phylodynamic analysis:
Figure 1: Phylodynamic Analysis Framework. This workflow shows how genetic sequences are transformed into epidemiological parameters through evolutionary and epidemiological models.
Quantitative Comparison of R₀ Across Pathogens
R₀ values vary significantly across pathogens due to differences in transmission mechanisms, contact rates, and infectious periods. The table below summarizes R₀ values and corresponding herd immunity thresholds for notable infectious diseases:
Table 1: Comparative R₀ Values and Herd Immunity Thresholds for Selected Pathogens
| Disease | Transmission Mode | R₀ Value | Herd Immunity Threshold (HIT) |
|---|---|---|---|
| Measles | Aerosol | 12-18 [5] | 92-94% [5] |
| Chickenpox (Varicella) | Aerosol | 10-12 [5] | 90-92% [5] |
| COVID-19 (Omicron variant) | Respiratory droplets & aerosol | 9.5 [5] | 89% [5] |
| COVID-19 (ancestral strain) | Respiratory droplets & aerosol | 2.9 (2.4-3.4) [5] | 65% (58-71%) [5] |
| Polio | Fecal-oral route | 5-7 [5] | 80-86% [5] |
| Smallpox | Respiratory droplets | 3.5-6.0 [5] | 71-83% [5] |
| Influenza (2009 pandemic strain) | Respiratory droplets | 1.6 (1.3-2.0) [5] | 37% (25-51%) [5] |
| Influenza (seasonal strains) | Respiratory droplets | 1.3 (1.2-1.4) [5] | 23% (17-29%) [5] |
| Ebola (2014 outbreak) | Body fluids | 1.8 (1.4-1.8) [5] | 44% (31-44%) [5] |
| MERS | Respiratory droplets | 0.5 (0.3-0.8) [5] | 0%* [5] |
Note: HIT calculated as 1 - 1/R₀. *When R₀ < 1.0, the disease naturally disappears without herd immunity.
R₀ is affected by three primary parameters: the duration of contagiousness, the likelihood of infection per contact between susceptible and infectious individuals, and the contact rate [7]. Importantly, R₀ is not a biological constant for a pathogen but varies based on local sociobehavioral and environmental circumstances, as evidenced by measles R₀ values ranging from 5.4 to 18 across different studies [7].
Experimental Protocols for Phylodynamic R₀ Estimation
Protocol: Bayesian Phylodynamic Estimation of R₀ from Genetic Sequence Data
This protocol outlines the methodology for estimating R₀ using Bayesian phylodynamic approaches, as implemented in software packages such as BEAST (Bayesian Evolutionary Analysis Sampling Trees) [8] [4] [9].
I. Sample Collection and Sequencing (Wet Lab Phase)
- Step 1: Sample Collection: Collect pathogen samples from infected hosts across multiple time points. For between-host dynamics, each sequence should ideally come from a different host [4].
- Step 2: Genome Sequencing: Perform whole-genome sequencing using next-generation sequencing platforms. For RNA viruses, ensure proper reverse transcription and amplification.
- Step 3: Sequence Alignment: Generate multiple sequence alignment using tools such as MAFFT or MUSCLE. For coronaviruses, mask spurious SNPs as needed [9].
- Step 4: Data Curation: Remove sequences from known transmission clusters that may violate the assumption of random sampling from the infected population, unless specifically modeling cluster dynamics [9].
II. Evolutionary Model Selection (Bioinformatic Phase)
- Step 5: Substitution Model Selection: Select appropriate nucleotide substitution models (e.g., HKY or GTR) using model selection tools such as ModelTest or bModelTest. Apply gamma distributed rate heterogeneity among sites if supported [9].
- Step 6: Molecular Clock Model: Specify a clock model to convert genetic distances to time. Strict or relaxed molecular clock models can be used depending on rate variation among branches [8] [4].
- Step 7: Tree Prior Specification: Select appropriate tree prior based on study design:
III. Phylodynamic Analysis (Computational Phase)
- Step 8: Parameter and Prior Specification:
- Step 9: MCMC Execution: Run Bayesian MCMC sampling to approximate posterior distributions of parameters (typically 10-100 million steps, depending on dataset size) [9].
- Step 10: Parameter Transformation: Convert estimated parameters to R₀ using appropriate formulas:
IV. Diagnostic Validation
- Step 11: Convergence Assessment: Check MCMC convergence using effective sample sizes (ESS > 200) and trace plot inspection in Tracer software.
- Step 12: Model Comparison: Compare marginal likelihoods using path sampling or stepping-stone sampling if multiple models were tested.
- Step 13: Uncertainty Quantification: Report median estimates with 95% highest posterior density (HPD) intervals for all parameters, including R₀.
The following workflow diagram illustrates the key steps in this protocol:
Figure 2: Phylodynamic R₀ Estimation Workflow. This protocol details the steps from sample collection to R₀ estimation.
Case Study: SARS-CoV-2 R₀ Estimation During Early Pandemic
A phylodynamic study of SARS-CoV-2 during the early pandemic period utilized 53 publicly available genomes collected between December 24, 2019, and February 4, 2020 [9]. The analysis employed BEAST v1.10.4 with a strict molecular clock, exponential growth tree prior, and gamma-distributed HKY nucleotide substitution model [9]. Key parameters included:
- Substitution rate: 0.9 × 10⁻³ (95% CI 0.5-1.4 × 10⁻³) substitutions per site per year
- Doubling time: 7.2 (95% CI 5.0-12.9) days
- R₀ estimate: 2.15 (95% CI 1.79-2.75) [8] [9]
This analysis demonstrated how phylodynamic methods could estimate infection burden independent of case reporting data, estimating 55,800 total infections by February 8, 2020, compared to 34,886 reported cases [9].
Table 2: Essential Research Resources for Phylodynamic R₀ Estimation
| Resource Category | Specific Tools/Reagents | Function/Application |
|---|---|---|
| Computational Frameworks | BEAST (Bayesian Evolutionary Analysis Sampling Trees) [8] [4] | Primary software platform for Bayesian phylodynamic analysis |
| BEAST2 [4] | Updated version with modular architecture | |
| R/phangorn/ape packages [8] | Statistical computing and phylogenetic analysis | |
| Evolutionary Models | Strict & Relaxed Molecular Clocks [4] | Convert genetic distances to time units |
| HKY/GTR substitution models [9] | Model nucleotide substitution patterns | |
| Coalescent & Birth-Death Tree Priors [4] | Model population dynamics and sampling | |
| Data Resources | GISAID [9] | Primary repository for pathogen genome data |
| NCBI Virus | Public repository for viral sequence data | |
| Analysis & Visualization | Tracer [9] | MCMC diagnostic analysis and visualization |
| FigTree | Phylogenetic tree visualization | |
| R/ggplot2 [8] | Data visualization and custom plotting |
Critical Considerations and Methodological Limitations
Distinguishing R₀ from Related Metrics
Several key distinctions are essential for proper interpretation of reproduction numbers:
R₀ vs. Effective Reproduction Number (Rₑ or Rₜ): While R₀ assumes a completely susceptible population, Rₜ measures actual transmission in populations with partial immunity and interventions [5] [6] [7]. Control measures affect Rₜ, not R₀ [7].
R₀ vs. Case Reproduction Number: The case reproduction number counts secondary cases diagnosed rather than infected, potentially differing due to surveillance limitations [10].
Methodological Limitations and Assumptions
Phylodynamic R₀ estimation faces several important limitations:
- Time Lag: Rₜ estimates reflect transmission dynamics from when current cases were infected, not current dynamics, due to incubation periods and reporting delays [10].
- Population Averaging: R₀ and Rₜ are population-averaged values that may mask important heterogeneity in transmission across subgroups or regions [10].
- Model Dependence: Estimated R₀ values depend heavily on model structures, assumptions, and prior distributions [7].
- Sampling Biases: Non-random sampling can bias estimates, particularly if sequences are oversampled from transmission clusters [9].
- Generation Time Uncertainty: Accurate translation of effective population size to prevalence requires knowledge of generation time distribution, which is often uncertain for novel pathogens [9].
Phylodynamic approaches to R₀ estimation provide powerful tools for understanding transmission dynamics, particularly when traditional surveillance data are limited or unreliable. By leveraging pathogen genetic variation as a natural recording device of epidemiological processes, these methods offer unique insights into epidemic spread, control effectiveness, and spatial dynamics [8] [2].
The integration of phylodynamics with traditional epidemiology has proven particularly valuable during recent outbreaks of SARS-CoV-2, Ebola, and Zika, where genomic surveillance has become a cornerstone of coordinated response efforts [4]. As genomic sequencing capacity continues to expand globally, phylodynamic inference of R₀ and related parameters will play an increasingly important role in public health decision-making and infectious disease control strategy development.
For researchers implementing these methods, careful attention to model assumptions, thorough diagnostic testing, and appropriate interpretation within epidemiological context remain essential for generating reliable, actionable insights into pathogen transmission dynamics.
Estimating the reproduction number (R0) is a critical aspect of understanding and controlling infectious disease outbreaks. Phylodynamics, a field that integrates population genetic models with epidemiological dynamics, provides a powerful framework for inferring R0 from viral genomic sequences. This framework combines three core components: phylogenetic trees that represent evolutionary relationships, molecular clocks that model the rate of evolutionary change, and population genetic models that describe how pathogen populations change over time. During the COVID-19 pandemic, these tools were extensively applied to characterize the spread and evolution of SARS-CoV-2, demonstrating their vital role in modern public health responses [11] [12]. Phylodynamic inference allows researchers to reconstruct past population size changes, which can be directly linked to the effective reproductive number (Re) of an pathogen, providing insights into transmission dynamics that complement traditional epidemiological data.
Core Conceptual Components
Phylogenetic Trees
A phylogenetic tree is a graphical representation of the evolutionary relationships between different biological entities, such as genes or species, based on their similarities and differences. In the context of phylodynamics, these trees typically depict the evolutionary history of pathogen samples.
The key features of a phylogenetic tree include [13]:
- External Nodes (Tips): Represent the observed genes or organisms being compared (e.g., viral sequences from different patients).
- Internal Nodes: Represent inferred ancestral entities (e.g., common ancestors of the sampled sequences).
- Branches: Connect nodes and represent evolutionary lineages; their lengths indicate the degree of genetic difference or the amount of evolutionary time.
- Root: The most recent common ancestor of all entities in the tree, providing directionality to evolution.
It is crucial to distinguish between gene trees and species trees. A gene tree represents the evolutionary history of a particular gene, while a species tree represents the evolutionary history of the species themselves. These may differ due to processes like incomplete lineage sorting or horizontal gene transfer, which is particularly relevant for rapidly evolving pathogens [13]. For phylodynamic inference, time-scaled phylogenetic trees, where branch lengths are proportional to time, are essential for estimating epidemiological parameters like R0.
Molecular Clocks
The molecular clock is a technique that uses the mutation rate of biomolecules to deduce the time in prehistory when two or more life forms diverged. The concept was first proposed by Zuckerkandl and Pauling in 1962, who noticed that the number of amino acid differences in hemoglobin between different lineages changes roughly linearly with time [14].
The molecular clock hypothesis initially proposed that the rate of evolutionary change of any specified protein was approximately constant over time and across different lineages. This concept was later supported by Motoo Kimura's neutral theory of molecular evolution, which predicted a clock-like rate of molecular change under the assumption that most mutations are neutral and their fixation in populations is driven primarily by genetic drift [14].
Table: Molecular Clock Calibration Methods
| Method | Description | Applications | Key Considerations |
|---|---|---|---|
| Node Calibration | Uses fossil evidence or known historical events to constrain the age of nodes in the tree. | Dating deep evolutionary events (e.g., host switching events). | Requires careful selection of maximum and minimum bounds for node ages. |
| Tip Calibration | Treats fossils as taxa and places them on tips using combined molecular and morphological data. | Analyzing pathogens with known sample dates (e.g., SARS-CoV-2). | Allows simultaneous estimation of tree topology and divergence times. |
| Expansion Calibration | Uses documented population expansions to calibrate rates based on coalescent theory. | Intraspecific studies at shorter timescales. | Effective for recent evolutionary history within a single species. |
| Total Evidence Dating | Combines molecular, morphological, and temporal data in a single Bayesian analysis. | Comprehensive dating analyses with multiple data types. | Uses the fossilized birth-death model; computationally intensive. |
In practice, molecular clocks are not perfectly constant. Rates can vary due to factors including generation times, population sizes, species-specific differences (e.g., metabolism), changes in protein function, and variations in the intensity of natural selection [14]. To account for this, relaxed molecular clock models have been developed that allow evolutionary rates to vary across lineages, providing more accurate estimates of divergence times [14].
Population Genetic Models
Population genetic models form the mathematical foundation for understanding how pathogen populations evolve over time. These models describe how genetic variation is shaped by evolutionary forces including mutation, genetic drift, natural selection, and migration. In phylodynamics, the coalescent model is particularly important as it provides a framework for working backward in time to trace the ancestry of sampled sequences until they reach their most recent common ancestor.
The coalescent process is influenced by population size, with coalescence events occurring more rapidly in small populations. This relationship allows researchers to infer historical changes in effective population size (Ne) from phylogenetic trees. Since effective population size in pathogens is correlated with the number of infected individuals and transmission rates, these inferences can be directly related to R0, which represents the average number of secondary infections generated by a single infected individual in a fully susceptible population [12].
Application Notes: Phylodynamic Inference of R0
Workflow for R0 Estimation from Genomic Data
The following diagram illustrates the integrated workflow for estimating R0 using phylodynamic methods:
This workflow begins with the collection of viral genomic sequences, which are aligned to identify genetic differences. A phylogenetic tree is then reconstructed from the aligned sequences. The tree is scaled to time using molecular clock methods, allowing researchers to estimate the rate of evolution and place the evolutionary history on an actual timescale. By fitting coalescent models to the time-scaled tree, changes in effective population size over time can be inferred. Finally, these population dynamics are interpreted through epidemiological models to estimate R0 [11] [12].
Case Study: SARS-CoV-2 R0 Estimation in Bangladesh
A study of SARS-CoV-2 in Bangladesh provides a concrete example of phylodynamic inference in practice. Researchers analyzed 292 SARS-CoV-2 genomes from Bangladesh and estimated R0 using the exponential growth method, calculating a value of 1.173 as of July 2020 [12]. The genomic analysis revealed diverse genomic clades (L, O, S, G, GH), with GR being the predominant circulating clade (83.9%; 245/292). Mutation analysis identified 1634 mutations, with 94.6% being non-synonymous and 5.4% unique mutations [12].
Table: SARS-CoV-2 Mutation Analysis in Bangladeshi Strains [12]
| Genomic Region | Predominant Mutations | Mutation Frequency | Functional Implications |
|---|---|---|---|
| Spike (S) Protein | D614G | High | Associated with increased transmissibility |
| NSP2 Protein | I120F | Recurrent | Function in viral replication |
| Nucleocapsid Protein | R203K, G204R | Recurrent | Affects viral assembly |
| RdRp | P323L | Recurrent | Impacts RNA synthesis |
| NSP9 and NSP11 | No mutations recorded | 0 | Highly conserved regions |
The spatial distribution analysis showed that cases were initially clustered in Dhaka and surrounding districts in March 2020 but spread throughout the country over time. The study demonstrated how phylogenetic analysis combined with epidemiological data can track transmission dynamics and inform public health interventions [12].
Experimental Protocols
Protocol 1: Phylogenetic Tree Reconstruction for R0 Estimation
Objective: To reconstruct a time-scaled phylogenetic tree from viral genomic sequences for subsequent R0 estimation.
Materials and Reagents:
- Viral RNA/DNA sequences from pathogen samples
- Sequence alignment software (MAFFT, Clustal Omega)
- Phylogenetic reconstruction software (BEAST, MrBayes, IQ-TREE)
- Computing resources for computationally intensive analyses
Procedure:
- Sequence Alignment
- Obtain viral genome sequences from public databases (GISAID, GenBank) or primary sequencing.
- Perform multiple sequence alignment using appropriate software (e.g., MAFFT) with default parameters.
- Visually inspect the alignment and trim low-quality regions or gaps.
Model Selection
- Use model testing software (e.g., ModelTest-NG, jModelTest2) to identify the best-fitting nucleotide substitution model.
- Select the model with the lowest Bayesian Information Criterion (BIC) or Akaike Information Criterion (AIC) score.
Tree Reconstruction
- For maximum likelihood trees, use software such as IQ-TREE with the selected substitution model.
- Assess branch support with 1000 ultrafast bootstrap replicates.
- For Bayesian inference, use BEAST2 with appropriate clock models and priors.
Molecular Dating
- Implement a molecular clock model (strict or relaxed) in BEAST2.
- Calibrate the clock using known sample dates (tip dating) or external node constraints.
- Run the MCMC analysis for an adequate number of generations (typically 10-100 million), assessing convergence using effective sample size (ESS > 200).
Tree Annotation and Visualization
- Use TreeAnnotator to generate a maximum clade credibility tree from the posterior tree distribution.
- Visualize the time-scaled tree using FigTree or IcyTree.
Troubleshooting Tips:
- If ESS values remain low despite long runs, simplify the model or increase chain length.
- If alignment issues arise with recombinant regions, consider removing or partitioning these regions.
Protocol 2: Molecular Clock Calibration for Epidemic Dating
Objective: To calibrate a molecular clock for accurate dating of evolutionary events in pathogen evolution.
Materials and Reagents:
- Time-stamped viral sequence data
- Bayesian evolutionary analysis software (BEAST2)
- Appropriate clock and tree priors
- High-performance computing resources
Procedure:
- Data Preparation
- Compile sequence data with accurate collection dates.
- Create an XML input file using BEAUti (BEAST2 utility).
Clock Model Selection
- Test both strict and relaxed clock models (e.g., uncorrelated lognormal).
- Compare models using marginal likelihood estimation (e.g., path sampling, stepping stone sampling).
Calibration Approach
- For node calibration: Assign prior distributions to specific nodes based on external information (e.g., first recorded case).
- For tip calibration: Include sampling dates directly in the analysis.
- Use appropriate prior distributions (e.g., lognormal, normal) that reflect uncertainty in calibration points.
MCMC Analysis
- Run multiple independent MCMC chains to assess convergence.
- Monitor ESS values for all parameters, ensuring ESS > 200 for key parameters.
- Combine log files from multiple runs using LogCombiner.
Validation
- Compare estimated node ages with known epidemiological information.
- Perform posterior predictive simulations to assess model adequacy.
Troubleshooting Tips:
- If date-randomization tests indicate insufficient temporal signal, consider expanding the sampling timeframe or using a different genomic region.
- If computational time is prohibitive, consider subsampling sequences or using approximate methods.
Protocol 3: Coalescent-Based Estimation of Effective Population Size
Objective: To estimate historical changes in effective population size from a time-scaled phylogenetic tree.
Materials and Reagents:
- Time-scaled phylogenetic tree (from Protocol 1)
- Coalescent analysis software (BEAST2, skygrowth, phylodyn)
- R or Python for statistical analysis and visualization
Procedure:
- Model Specification
- Select an appropriate population size model (e.g., Bayesian Skyline, Skygrid, Gaussian Markov random field).
- Specify priors for population size parameters.
MCMC Analysis
- Run analysis in BEAST2 with the chosen coalescent model.
- Ensure adequate sampling of the posterior distribution (ESS > 200 for population size parameters).
Population Size Trajectory Reconstruction
- Extract the posterior distribution of effective population size through time.
- Calculate mean and 95% highest posterior density intervals.
Conversion to Epidemiological Parameters
- Relate effective population size (Ne) to the number of infected individuals (N) using the formula: N = Ne × μ × g, where μ is mutation rate per generation and g is generation time.
- Estimate R0 from the exponential growth rate of the epidemic using the formula: R0 = 1 + r × g, where r is the exponential growth rate and g is the generation time.
Troubleshooting Tips:
- If population size estimates are unstable, consider simplifying the model or increasing sequence data.
- If generation time is uncertain, perform sensitivity analyses with different values.
The Scientist's Toolkit: Research Reagent Solutions
Table: Essential Research Reagents and Tools for Phylodynamic R0 Estimation
| Reagent/Tool | Function | Example Applications | Key Features |
|---|---|---|---|
| Viral Genomic Sequences | Primary data for phylogenetic reconstruction | SARS-CoV-2 surveillance, influenza monitoring | Temporal and spatial sampling crucial for accurate inference |
| Sequence Alignment Tools (MAFFT, Clustal Omega) | Align multiple sequences for comparison | Identifying genetic variation across samples | Handles large datasets with different optimization algorithms |
| Molecular Clock Software (BEAST2) | Bayesian evolutionary analysis with molecular dating | Estimating divergence times, evolutionary rates | Flexible clock models, integration with epidemiological models |
| Coalescent Analysis Packages (skygrowth, phylodyn) | Infer population dynamics from genetic data | Reconstruction of historical population sizes | Various demographic models, efficient computation |
| Epidemiological Data (case counts, transmission chains) | Ground-truthing for genetic inferences | Validating phylodynamic estimates of R0 | Provides independent assessment of model accuracy |
Integration and Interpretation
The integration of phylogenetic trees, molecular clocks, and population genetic models enables a powerful approach to estimating R0 from genomic data. The following diagram illustrates the logical relationships between these components and their output for public health decision-making:
Successful application of these methods requires careful consideration of limitations, particularly sampling bias where unequal representation of cases across time, space, or populations can skew results [11]. Additionally, the molecular clock assumption of constant evolutionary rates may be violated in practice, necessitating the use of relaxed clock models [14]. Interpretation should also account for the distinction between effective population size (Ne) derived from genetic data and the actual number of infected individuals, as the relationship between these parameters depends on various biological and epidemiological factors.
During the COVID-19 pandemic, phylodynamic tools provided critical insights for public health response, including tracking variant emergence, understanding spatial spread, and evaluating intervention effectiveness [11]. Continuous genomic surveillance coupled with phylodynamic analysis remains essential for monitoring transmission dynamics and detecting new variants, ultimately supporting global efforts to control infectious disease threats.
The precise estimation of the basic reproduction number (R0) is fundamental to understanding and controlling infectious disease outbreaks. Phylodynamic inference has emerged as a powerful approach that integrates epidemiological dynamics with pathogen genomic data to reconstruct transmission chains and estimate key parameters such as R0. This methodology leverages the natural genetic variation that accumulates in pathogen populations as they spread through a host population. The core premise is that the evolutionary dynamics of pathogens, captured through genomic sequencing, contain a readable record of their transmission history [15].
The relationship between genetic variation and transmission dynamics is not merely correlative but causal. The rate at which mutations accumulate, the size of the transmission bottleneck (the number of pathogens founding a new infection), and the selection pressures acting on the pathogen collectively determine the extent and pattern of observable genetic diversity. This diversity, when interpreted through appropriate models, enables researchers to infer whether cases belong to the same transmission chain, identify direct transmission pairs, and quantify the number of secondary infections generated by an index case—the definitive measure of R0 [16] [17]. This Application Note details the protocols and analytical frameworks for leveraging pathogen genetic variation to infer transmission dynamics and estimate R0, with a focus on practical implementation for researchers and public health professionals.
Theoretical Foundation: From Genetic Variation to Transmission Parameters
Core Concepts Linking Genomic Data to Epidemiology
- Transmission Divergence: This is defined as the number of mutations separating whole-genome sequences sampled from a known transmission pair (infector and infectee). It is a fundamental metric determining the informational value of genomic data for outbreak reconstruction. Pathogens with high mean transmission divergence (e.g., many RNA viruses) are more amenable to detailed transmission tree inference from genetic data alone, whereas those with low divergence provide less resolution [17].
- Transmission Bottleneck: The number of pathogens transmitted from a donor to a recipient host is a critical determinant of how much of the donor's within-host pathogen diversity is passed on. A tight bottleneck restricts diversity and can make transmission links appear more monoclonal, whereas a wider bottleneck allows for the transfer of a more diverse population, including shared within-host variants [16] [18].
- Within-Host Variants: Also called intra-host single nucleotide variants (iSNVs), these are mutations present in a subset of the pathogen population within a single host. The sharing of these low-frequency variants between hosts provides strong evidence for direct transmission, especially when the same variants are not observed in other, epidemiologically unlinked cases [16] [18].
- Effective Reproductive Number (Rt): Unlike the basic R0, which assumes a fully susceptible population, the time-varying effective reproductive number (Rt) represents the average number of secondary cases generated by an infected individual at time t. Phylodynamic methods can estimate Rt through time from genomic data, providing a dynamic view of an outbreak's trajectory [19].
Quantitative Benchmarks for Pathogen Transmission
The table below summarizes key parameters, including estimated R0 values and transmission divergence, for a selection of major pathogens. These values highlight the diversity of transmission dynamics and the variable utility of genomic data across different pathogens.
Table 1: Key Epidemiological and Genomic Parameters for Selected Pathogens
| Pathogen | Reported R0 Range | Mean Transmission Divergence (Mutations/Pair) | Informativeness of Genomic Data for Transmission Inference |
|---|---|---|---|
| Ebola Virus | 1.44 - 9.38 (pooled mean: 1.95) [20] | Low to Moderate [17] | Moderate to High [16] [17] |
| Influenza A (H1N1) | ~1.2 - 1.6 [21] | Moderate [17] | High [16] [17] |
| SARS-CoV-2 | ~3 (ancestral strain) | Moderate [15] | High [15] |
| Mycobacterium tuberculosis | ~1.2 (in simulated outbreaks) [19] | Very Low [17] | Low [17] |
| Streptococcus pneumoniae | Not Well Quantified | Very Low [17] | Very Low [17] |
| Shigella sonnei | Not Well Quantified | Very Low [17] | Very Low [17] |
The following diagram illustrates the conceptual workflow linking pathogen genetic variation to the phylodynamic inference of transmission parameters like R0.
Application Notes & Experimental Protocols
This section provides detailed methodologies for generating and analyzing the genomic data required for phylodynamic inference of R0.
Protocol 1: Deep Sequencing for Transmission Pair Identification
Objective: To identify direct transmission pairs by detecting shared low-frequency, within-host single nucleotide variants (iSNVs) between pathogen samples.
Background: Consensus-level whole-genome sequencing can often be insufficient to resolve transmission chains, especially in fast-moving outbreaks. Deep sequencing (high-coverage sequencing of a mixed pathogen population) allows for the detection of iSNVs. The presence of the same iSNV in two hosts, particularly at a similar allelic frequency, is a strong indicator of a direct transmission link [16] [18].
Materials & Reagents:
- High-Fidelity DNA/RNA Extraction Kits: For unbiased extraction of total pathogen nucleic acid.
- PCR Reagents: For target enrichment (if required).
- Next-Generation Sequencing Platform: Such as Illumina NovaSeq or MiSeq, capable of producing high coverage (>100x).
- Bioinformatics Pipelines: For quality control (e.g., FastQC), read alignment (e.g., BWA, Bowtie2), and variant calling (e.g., LoFreq, VarScan2).
Procedure:
- Sample Collection: Collect pathogen samples (e.g., nasopharyngeal swabs, stool, blood) from suspected cases in an outbreak, ensuring detailed epidemiological metadata is recorded.
- Nucleic Acid Extraction: Extract total nucleic acid using methods that minimize bias and preserve the representation of minor variants.
- Library Preparation & Sequencing: Prepare sequencing libraries using kits designed to retain complexity. Sequence to a high depth of coverage (recommended >500x) to confidently identify low-frequency variants.
- Variant Calling: Map sequencing reads to a reference genome. Call iSNVs using a specialized variant caller that is sensitive to low-frequency mutations. A typical threshold is to consider variants with a frequency between 2% and 95% to avoid sequencing errors and fixed mutations, respectively [18].
- Identify Shared Variants: For each pair of samples, identify iSNVs that are present in both. The strength of evidence for a transmission link increases with the number of shared iSNVs and the similarity of their allelic frequencies.
Analysis & Interpretation:
- Construct a weighted variant network where nodes represent hosts and edges are weighted by the number of shared iSNVs. The host with the highest weight is the most likely source for a given case [16].
- In scenarios with small transmission bottlenecks, shared variants may be rare, but those that are identified are highly accurate. A hybrid approach that combines shared variant data with phylogenetic distance from consensus sequences can improve resolution [16].
Protocol 2: Simulating Outbreaks for Method Validation
Objective: To simulate realistic infectious disease outbreaks with known transmission trees and pathogen evolution, enabling the validation of phylodynamic inference methods.
Background: Computational simulation frameworks allow for the testing of inference methods under controlled conditions with known "ground truth" transmission parameters. This is crucial for validating new analytical approaches and for understanding the limitations of genomic data under different epidemiological scenarios (e.g., varying R0, bottleneck size, and mutation rates) [16] [15] [17].
Materials & Reagents:
- Computational Resource: A high-performance computing cluster or workstation.
- Simulation Software: Frameworks such as
Opqua[15],Seedy[16], orTransPhylo[19].
Procedure:
- Parameterize the Simulation: Define key parameters based on the pathogen of interest:
- Epidemiological Parameters: R0, generation time distribution, population size.
- Evolutionary Parameters: Mutation rate, genome length, recombination rate.
- Transmission Parameters: Bottleneck size.
- Simulate Outbreak and Evolution: Run the stochastic simulation to generate a complete outbreak with a known transmission tree and corresponding pathogen genomes for each host.
- Sample Genomes: Mimic real-world surveillance by sub-sampling a proportion of the infected hosts for "sequencing."
- Apply Inference Method: Run your phylodynamic inference method (e.g., outbreaker, phybreak, or a custom model) on the simulated genomic and epidemiological data.
- Validate Performance: Compare the inferred transmission tree and R0 estimates to the known, simulated truth. Common metrics include:
Protocol 3: Naive Bayes Integration for R0 Estimation
Objective: To estimate the relative probability of direct transmission between all case-pairs and subsequently calculate the effective reproductive number (Rt) when genetic and contact data are only available for a subset of cases.
Background: This machine learning approach integrates diverse data types (genetic, clinical, demographic, spatial) to infer transmission probabilities. It is particularly useful in resource-limited settings where deep genomic data or exhaustive contact tracing is not available for all cases [19].
Materials & Reagents:
- Case Data: For all cases, collect individual-level data (e.g., location, symptom onset date, clinical type, demographics).
- Training Set Data: For a subset of cases, obtain rich data from contact investigations and/or whole-genome sequencing.
- Statistical Software: R or Python with machine learning libraries.
Procedure:
- Create a Case-Pair Dataset: Transform the individual-level dataset into a dataset of ordered case-pairs (i, j), where case i was observed before case j.
- Calculate Pair-Level Covariates: Convert individual-level covariates into pair-level "distance" measures (e.g., same town yes/no, difference in symptom onset).
- Build a Training Set: Use the subset of case-pairs with WGS/contact data to define probable transmission events (e.g., pairs with a genetic distance below a threshold are considered linked,
L_ij = 1). - Train Naive Bayes Model: Use the training set to calculate:
- The prior probability of a link,
P(L=1). - The conditional probability of each covariate value given the link status,
P(Z_k=z_k | L=l), for all covariates.
- The prior probability of a link,
- Predict Transmission Probabilities: For all case-pairs (including those not in the training set), apply the naive Bayes formula to estimate the probability of direct transmission,
p(i→j)[19]. - Estimate Reproductive Number: Scale the probabilities so that for each case j, the sum of probabilities over all potential infectors i equals 1. Then, for each case i, calculate its effective reproductive number as
R_i = Σ_m p(i→m)^s, where the sum is over all cases m that could have been infected by i. The averageR_ifor cases at a given time givesR_t[19].
The Scientist's Toolkit: Research Reagent Solutions
Table 2: Essential Materials and Tools for Phylodynamic Studies of Transmission
| Item Name | Function/Application | Specification Notes |
|---|---|---|
| Illumina DNA Prep Kit | Library preparation for whole-genome sequencing. | Ensures high complexity libraries for accurate variant calling. |
| LoFreq Variant Caller | Sensitive detection of low-frequency iSNVs from deep sequencing data. | Critical for identifying shared within-host variants for transmission pair linking [18]. |
| Opqua Simulation Framework | Flexible simulation of pathogen epidemiology and genomic evolution. | Allows modeling of selection and complex evolutionary dynamics; Python-based [15]. |
| Seedy R Package | Simulation of within-host evolution and transmission. | Explicitly models mixed pathogen populations and sampling over time [16]. |
| Outbreaker2 R Package | Inferring transmission trees from genomic and epidemiological data. | Implements a Bayesian framework for outbreak reconstruction [17]. |
| ABC (Approximate Bayesian Computation) Tools | Calibrating model parameters when likelihoods are intractable. | Used for simulator-based inference of R0 from complex models [21]. |
| High-Fidelity Polymerase | PCR amplification for target enrichment before sequencing. | Minimizes introduction of errors that could be mistaken for true iSNVs. |
Concluding Remarks
The integration of pathogen genetic variation into dynamic models has fundamentally transformed our ability to quantify transmission intensity and reconstruct outbreak spread. The protocols outlined herein—ranging from wet-lab sequencing to advanced computational inference—provide a roadmap for researchers to accurately estimate R0 and other critical parameters. As the field evolves, the key challenges will involve standardizing these methods across diverse pathogens, improving computational efficiency for large-scale outbreaks, and seamlessly integrating genomic data with other traditional epidemiological data streams. The continued refinement of these phylodynamic tools is essential for preparing a robust public health response to future emerging infectious disease threats.
Phylodynamics combines evolutionary biology and epidemiology to infer population dynamics of pathogens from genetic sequence data [4]. A primary objective in public health is estimating the basic reproduction number (R0), defined as the average number of secondary infections caused by a single infected individual in a fully susceptible population [8] [4]. Two foundational classes of models dominate this field: the coalescent and the birth-death-sampling frameworks [4]. The coalescent originated in population genetics as a model for how sampled lineages merge (coalesce) into common ancestors backward in time [4]. In contrast, the birth-death-sampling model is a forward-time process that describes population dynamics through transmission (birth), recovery/death (death), and data collection (sampling) events [22] [4]. Both models serve as tree priors in Bayesian phylogenetic software like BEAST2, linking epidemiological parameters to the probability of observing a given phylogenetic tree [23] [24] [4]. This protocol outlines their application for estimating R0, a critical parameter for designing and evaluating public health interventions such as vaccination campaigns [8].
Theoretical Foundations
The Coalescent Framework
The coalescent models the genealogy of sampled individuals backward in time [4]. Its rate is governed by the effective population size (Ne(t)), which, in an epidemiological context, is often proportional to the number of infected individuals (I(t)) [4]. For an exponentially growing pathogen population, the growth rate (r) can be related to R0 using the Lotka-Euler equation, provided the generation time distribution (w(τ)) is known [25]:
Specific analytical solutions exist for assumed generation time distributions. For a gamma-distributed generation time with mean (m) and standard deviation (s), where shape (a = m²/s²) and rate (b = m/s²), the relationship is [25]:
This framework is particularly powerful for reconstructing past population dynamics from genetic data and is a standard tool in demographic inference [22].
The Birth-Death-Sampling Framework
The birth-death-sampling model is a forward-time process defined by several parameters [4]. Each infected individual has a constant rate of transmitting the infection (λ), a rate of removal (δ) due to recovery or death, and a rate of being sampled (ψ). Upon sampling, an individual may be removed from the infectious pool with a probability (r) [24] [4]. In its simplest form, this model assumes a constant supply of susceptible hosts, leading to exponential growth in the number of infected individuals [4]. Within this framework, the basic reproduction number is calculated as [24] [4]:
The model can be extended to structured populations (multi-type birth-death model) to quantify migration rates between subpopulations, which is crucial for understanding spatial spread [23] [26].
Relationship to Compartmental Epidemiological Models
Both frameworks can be linked to Susceptible-Infected-Recovered (SIR) models [8] [4]. In the SIR model, the transmission rate (β) and removal rate (γ) define R0 as R0 = βS0/γ, where S0 is the initial number of susceptible individuals [24]. The Coalescent SIR and Birth-Death SIR (BDSIR) models integrate these epidemiological dynamics directly into the phylogenetic tree prior, allowing for joint inference of the phylogenetic tree and epidemiological parameters [24] [4].
Table 1: Core Parameters in Foundational Phylodynamic Models
| Model | Key Parameters | R0 Formula | Primary Application Context |
|---|---|---|---|
| Coalescent (Exponential Growth) | Growth rate (r), generation time distribution (w(τ)) | R0 = 1 / ∫ w(τ)e^(-rτ)dτ | Early epidemic phase, historical population dynamics |
| Birth-Death-Sampling (Constant Rate) | Transmission rate (λ), removal rate (δ), sampling rate (ψ) | R0 = λ / δ | Outbreak investigation, serially sampled data |
| Coalescent SIR | R0, recovery rate (γ), initial susceptibles (S0) | R0 = βS0/γ (β derived) | Epidemic dynamics with susceptible depletion |
| Multi-Type Birth-Death | Type-specific λ, δ, ψ, and migration rates (m) | R0 = λ / δ (per type) | Structured/spatial populations, migration dynamics |
Experimental Protocols and Workflows
Protocol 1: Estimating R0 using the Coalescent Exponential Growth Model
Purpose: To estimate the basic reproduction number (R0) from pathogen genetic sequences sampled at a single or multiple time points, assuming exponential growth during the early phase of an epidemic.
Materials and Reagents:
- Genetic Sequences: Pathogen nucleotide sequences (e.g., whole genome or specific genes) in FASTA format.
- Sequence Data: Sampling dates for each sequence must be accurately known and specified in the ISO 8601 standard (YYYY-MM-DD).
- Software: BEAST2 (version 2.7.0 or higher) with the following installed packages: SA, tree-annotator, and Tracer [24].
- Computing Resources: A computer cluster or high-performance computing node is recommended for datasets exceeding 500 sequences to ensure tractable computation times.
Procedure:
- Data Preparation:
- Align sequences using a multiple sequence alignment tool (e.g., MAFFT, MUSCLE).
- Create a
data.xmlfile containing the aligned sequences and their sampling dates.
- Model Specification in BEAST2 XML:
- Site and Clock Model: Select a nucleotide substitution model (e.g., HKY, GTR) and a strict or relaxed molecular clock model.
- Tree Prior: Specify the Coalescent: Exponential Growth model.
- Priors: Set a prior distribution for the growth rate (r), often a Laplace Distribution(μ=0, scale=100). Set a prior for the generation time distribution parameters (e.g., a Log Normal distribution for the mean and standard deviation if they are being estimated).
- MCMC Execution:
- Configure the Markov Chain Monte Carlo (MCMC) chain length (typically 10-100 million steps, depending on dataset size and model complexity).
- Run BEAST2 with the configured XML file.
- Post-Processing and Analysis:
- Use
tree-annotatorto generate a maximum clade credibility tree from the posterior tree distribution. - Analyze the MCMC output in
Tracerto assess effective sample sizes (ESS > 200) for all parameters and examine the posterior distribution of the growth rate (r). - Calculate R0 by applying the Lotka-Euler equation to the posterior samples of
rand the assumed generation time distribution, either externally or within BEAST2 using theR0package.
- Use
Troubleshooting Tips:
- Poor MCMC Mixing: Adjust operator weights and tuning parameters in the BEAST2 XML to improve sampling efficiency.
- Low ESS for Tree Height: Increase the chain length or consider using a tree transformation operator.
Protocol 2: Estimating R0 using the Birth-Death-Sampling Model
Purpose: To estimate R0 and other epidemiological parameters from genetically sequenced pathogens, explicitly modeling the sampling process through time.
Materials and Reagents:
- Genetic Sequences: Pathogen nucleotide sequences in FASTA format with precise sampling dates.
- Software: BEAST2 (version 2.7.0 or higher) with the
bdmmpackage installed for structured analyses [23]. - Prior Knowledge: Preliminary estimates of the removal rate (δ = 1 / duration of infectiousness) can improve model identifiability [22].
Procedure:
- Data Preparation: Identical to Protocol 1.
- Model Specification in BEAST2 XML:
- Site and Clock Model: As in Protocol 1.
- Tree Prior: Specify the Birth-Death Serial Sampling model.
- Parameter Priors:
- Reproductive Number (R0): Set a prior with a lower bound of 1.0 (e.g., Log Normal). An R0 < 1 implies a non-sustained outbreak.
- Death Rate (δ): This is the removal rate (recovery/death). If data is available, a Gamma prior can be used.
- Sampling Proportion (s): This is the probability an infected individual is sampled. A Beta or Uniform(0,1) prior is typical.
- MCMC Execution and Analysis:
- Configure and run the MCMC analysis as in Protocol 1.
- Use Tracer to verify convergence and examine posterior distributions for R0, δ, and the sampling proportion.
Troubleshooting Tips:
- Biased R0 Estimates: Misspecification of the sampling process can lead to large biases [22] [27]. Ensure the chosen sampling model (e.g., rate-based vs. event-based) reflects the true data collection process.
- Numerical Instability with Large Datasets: For datasets with >250 sequences, use the updated
bdmmpackage which includes algorithmic improvements to prevent numerical underflow [23].
Protocol 3: Multi-Type Birth-Death Analysis for Structured Populations
Purpose: To infer migration rates and type-specific R0 values in a structured population (e.g., by geography or host trait).
Materials and Reagents:
- Annotated Genetic Sequences: Sequences in FASTA format with sampling dates and type/trait labels (e.g., country of origin).
- Software: BEAST2 with the
bdmmpackage (version 2.0 or higher recommended for improved stability with large datasets) [23].
Procedure:
- Data Preparation: Prepare sequence data and a trait file mapping each sequence to its type (e.g., location).
- Model Specification:
- In BEAST2, select the Multi-Type Birth-Death model within the
bdmmpackage. - Define the number of types (e.g., discrete geographic locations).
- Specify priors for the type-specific reproductive numbers (R0i), death rates (δi), and the migration rate matrix (m_ij).
- In BEAST2, select the Multi-Type Birth-Death model within the
- MCMC Execution and Analysis:
- Run a long MCMC chain, as structured models have high parameter dimensionality. Monitor the ESS for all migration rates and type-specific R0 values.
- The output will provide posterior distributions for migration rates between populations and the reproductive number within each population.
Applications and Limitations:
- Epidemic Outbreaks: The multi-type birth-death model excels at accurately estimating migration rates during outbreaks with varying population sizes [26].
- Endemic Scenarios: For endemic diseases with stable population sizes, the structured coalescent can provide more precise estimates, though with comparable accuracy to the birth-death model [26].
Table 2: Key Research Reagent Solutions for Phylodynamic R0 Inference
| Reagent/Software Tool | Function/Purpose | Application Context |
|---|---|---|
| BEAST2 Software Package [23] [24] [4] | Bayesian evolutionary analysis sampling trees; primary platform for coalescent and birth-death model inference. | All phylodynamic analyses, integration of sequence evolution with population dynamics. |
| bdmm Package for BEAST2 [23] [26] | Enables phylodynamic inference under the multi-type birth-death model. | Analysis of structured populations (e.g., geographic spread, different host types). |
| Coalescent SIR Model [24] | Tree prior linking phylogenetic tree probability to SIR model dynamics. | Inferring R0 and other SIR parameters (S0, gamma) directly from genetic data. |
| MASTER Simulator [22] | Simulates genealogies under population genetic models, including birth-death processes. | Method validation and simulation-based study design. |
| Tracer Diagnostic Tool | Analyzes MCMC output from BEAST2, assesses convergence (ESS), and summarizes parameter estimates. | Essential post-processing step for all analyses to ensure results are reliable. |
Data Interpretation and Model Selection
Comparative Model Performance
Choosing between coalescent and birth-death models requires an understanding of their strengths, weaknesses, and performance under different scenarios [26].
Table 3: Quantitative Comparison of Coalescent and Birth-Death Model Performance
| Scenario | Model | Accuracy | Precision | Key Findings from Simulation Studies |
|---|---|---|---|---|
| Epidemic Outbreak (Varying Pop. Size) | Structured Coalescent (Constant Size) | Low | Moderate | Inaccurate migration rates; not recommended for outbreaks [26]. |
| Epidemic Outbreak (Varying Pop. Size) | Multi-Type Birth-Death | High | Moderate | Superior accuracy for migration rates; accounts for population dynamics [26]. |
| Endemic Disease (Stable Pop. Size) | Structured Coalescent | High | High | Comparable accuracy, higher precision for migration rates [26]. |
| Endemic Disease (Stable Pop. Size) | Multi-Type Birth-Death | High | Moderate | Comparable accuracy, less precise than coalescent [26]. |
| Homochronous Sampling (Single Time Point) | Coalescent Exponential Growth | High | High | Results are virtually indistinguishable from birth-death model [22] [27]. |
| Serially Sampled Data | Birth-Death-Sampling | Variable | High | Susceptible to bias if sampling process is misspecified [22] [27]. |
Guidelines for Model Selection
- For Early Epidemic Phase with Simple Sampling: If analyzing the exponential growth phase of an outbreak and the proportion of cases sequenced is relatively constant, the Coalescent Exponential Growth model is a robust and computationally efficient choice [4].
- For Complex Sampling Schemes: If sampling is known to have occurred at varying rates over time (e.g., an initial push followed by sporadic sampling), the Birth-Death-Sampling model is more appropriate, provided the sampling process can be accurately modeled [22].
- For Estimating Spatial Spread: To infer migration rates between regions, the Multi-Type Birth-Death model is generally preferred, especially during outbreaks, as it directly accounts for the exponential growth dynamics [26].
- When Sampling Process is Unknown: If the sampling process is complex or poorly understood, the coalescent framework, which does not require an explicit sampling model, may be more robust to misspecification [22] [27].
From Theory to Practice: Methodological Approaches for R0 Estimation Across Pathogens
Bayesian Inference and MCMC in Phylodynamic Workflows
Bayesian phylodynamics combines phylogenetic reconstruction with epidemiological models to infer the dynamics of pathogen populations from genetic sequence data [28] [29]. This integration provides a powerful framework for estimating key epidemiological parameters, particularly the reproduction number (R₀), which represents the average number of secondary infections generated by a single infected individual in a susceptible population [28] [30]. The Bayesian approach naturally accommodates uncertainty in phylogenetic trees and model parameters, making it particularly valuable for analyzing rapidly evolving pathogens where genetic data provides crucial temporal signals [31] [29].
The core of Bayesian phylodynamics lies in using molecular sequence data coupled with sampling times to reconstruct time-scaled phylogenetic trees that represent the evolutionary history of pathogen samples [28] [31]. These trees then serve as the foundation for inferring population dynamics through models that describe how lineages coalesce through time, with the birth-death model and coalescent model being the most commonly employed tree-generative processes [32] [28]. Through Markov Chain Monte Carlo (MCMC) sampling, researchers can approximate the posterior distribution of R₀ while integrating over uncertainty in trees, evolutionary parameters, and other model components [28] [30].
Theoretical Foundations
Key Phylodynamic Models
Table 1: Fundamental Models in Bayesian Phylodynamic Inference
| Model Type | Key Components | Epidemiological Application | Data Requirements |
|---|---|---|---|
| Birth-Death Sampling Model | Birth rate (λ), death rate (μ), sampling rate (ψ) | Inferring R₀ from sequentially sampled data; epidemic growth dynamics | Genetic sequences with sampling dates [28] [31] |
| Coalescent-based Models | Effective population size (Ne), growth rate | Historical population dynamics; demographic inference | Genetic sequences from a population at one or more time points [32] [29] |
| Structured Models | Migration rates, subpopulation sizes | Spatial spread, transmission between risk groups | Genetic sequences with associated metadata (location, host) [29] |
| Seedbank Coalescent | Active/dormant transition rates, relative population sizes | Pathogens with latent stages (e.g., M. tuberculosis) | Time-stamped genetic sequences with potential for long branches [33] |
The Bayesian Framework
In Bayesian phylodynamics, the posterior distribution of parameters given genetic sequence data D is proportional to:
P(Φ, τ | D) ∝ P(D | τ, Φ) P(τ | Φ) P(Φ)
Where Φ represents the model parameters (including R₀), τ is the time-scaled phylogeny, P(D | τ, Φ) is the phylogenetic likelihood of the sequences given the tree and evolutionary model, P(τ | Φ) is the tree prior that encodes the population dynamic process, and P(Φ) is the joint prior distribution on the model parameters [28] [29]. The tree prior P(τ | Φ) is typically derived from epidemiological models such as the birth-death process, which directly relates to R₀ through the ratio of birth to death rates [28].
The computation of this posterior distribution relies heavily on MCMC algorithms, which generate samples from the target distribution through a random walk in parameter space [31]. For phylodynamic models, this involves designing efficient transition kernels that propose changes to the phylogenetic tree, model parameters, and evolutionary model components while maintaining computational feasibility [31] [34].
Software and Implementation
BEAST Ecosystem
The BEAST (Bayesian Evolutionary Analysis Sampling Trees) software platform serves as the primary computational workhorse for Bayesian phylodynamic inference [31] [34]. The recently introduced BEAST X represents a significant advancement, incorporating state-of-science models and novel computational algorithms that notably accelerate inference [34].
Key innovations in BEAST X include:
- Hamiltonian Monte Carlo (HMC) transition kernels that use gradient information to more efficiently traverse high-dimensional parameter spaces, particularly for branch-specific parameters [34]
- Enhanced molecular clock models including time-dependent evolutionary rate models, continuous random-effects clock models, and shrinkage-based local clock models that better capture rate heterogeneity [34]
- Advanced substitution models such as Markov-modulated models (MMMs) that allow the substitution process to change across branches and sites, and random-effects substitution models that extend standard continuous-time Markov chain models [34]
- Scalable preorder tree traversal algorithms that enable linear-time evaluation of high-dimensional gradients for branch-specific parameters [34]
Table 2: Software Tools for Bayesian Phylodynamic Inference
| Software/Tool | Primary Function | Key Features | Implementation |
|---|---|---|---|
| BEAST X | Comprehensive Bayesian evolutionary analysis | Flexible clock models, phylogeography, birth-death models, HMC sampling | Cross-platform, open-source [34] |
| GABI (GESTALT Analysis using Bayesian Inference) | Single-cell lineage tracing | Implements GESTALT mutation model in BEAST 2, birth-death process for cell dynamics | BEAST 2 package [32] |
| SeedbankTree | Inference for populations with dormancy | Strong seedbank coalescent, joint estimation of genealogy and dormancy parameters | BEAST 2 package [33] |
| EpiSky | R₀ inference from epidemiological and genetic data | Particle MCMC methods, combines prevalence data and dated phylogenies | R package [30] |
Research Reagent Solutions
Table 3: Essential Computational Tools for Bayesian Phylodynamics
| Research Reagent | Function/Purpose | Example Applications |
|---|---|---|
| BEAST 2/BEAST X | Core inference platform for Bayesian evolutionary analysis | Phylogenetic reconstruction, divergence time estimation, phylodynamics [32] [34] |
| Birth-Death Model | Tree prior modeling speciation/sampling and extinction | Estimating R₀ from epidemic data, reconstructing transmission dynamics [28] |
| Molecular Clock Models | Relating genetic changes to evolutionary time | Estimating evolutionary rates, calibrating phylogenetic trees in time [29] [34] |
| MCMC Samplers | Approximating posterior distributions of parameters | All Bayesian phylogenetic and phylodynamic analyses [31] [34] |
| Substitution Models | Modeling sequence evolution over phylogenetic trees | Calculating phylogenetic likelihood, accounting for site heterogeneity [34] |
| Coalescent Models | Modeling ancestral relationships in populations | Inferring demographic history, effective population size [32] [33] |
Experimental Protocols
Core Protocol: Estimating R₀ from Genetic Sequence Data
This protocol outlines the procedure for estimating the reproduction number R₀ from time-stamped genetic sequence data using birth-death models in BEAST.
Materials and Software Requirements
- BEAST X software package [34]
- Sequence alignment in FASTA or NEXUS format with sampling dates
- BEAGLE library (optional, for hardware acceleration)
Procedure
Data Preparation
- Compile genetic sequences with associated sampling dates
- Perform multiple sequence alignment using tools such as MAFFT or MUSCLE
- Verify and format sampling dates in appropriate format (e.g., decimal years)
Model Specification
- Select appropriate substitution model (e.g., HKY, GTR) with gamma-distributed rate heterogeneity [34]
- Choose molecular clock model (strict, relaxed, or time-dependent) based on prior knowledge of rate variation [34]
- Specify birth-death tree prior with serial sampling to model epidemic dynamics [28]
- Set prior distributions for all model parameters, including R₀
MCMC Configuration
- Configure chain length appropriate to dataset size and model complexity
- Set up logging parameters for trees and parameter samples
- Enable appropriate transition kernels for efficient sampling
Analysis Execution
- Run MCMC simulation until convergence is achieved
- Monitor effective sample sizes (ESS) for all parameters (target ESS > 200)
- Assess convergence using Tracer software or similar tools
Post-processing and Interpretation
- Combine and summarize posterior tree distributions using TreeAnnotator
- Visualize posterior distributions of R₀ and other parameters
- Generate maximum clade credibility tree for visualization
- Perform posterior predictive checks to assess model adequacy
Troubleshooting Notes
- If ESS values remain low despite long runs, consider adjusting transition kernel parameters or using HMC samplers where available [34]
- If date and sequence data provide conflicting signals, use methods to quantify their relative contributions [28]
- For large datasets, utilize BEAGLE library and consider using online inference approaches [31]
Specialized Protocol: Online Phylodynamic Inference
This protocol describes the online inference framework for updating analyses as new sequence data become available, significantly reducing computational time compared to de novo analysis [31].
Procedure
Initial Analysis
- Run standard Bayesian phylodynamic analysis on available dataset until convergence
- Save the posterior state file upon completion
Incorporating New Sequences
- Upon availability of new sequences, interrupt subsequent analysis
- Extract a representative tree from the posterior distribution
- Insert new sequences into the tree using genetic distance measures
Parameter Imputation
- Impute values for new parameters necessitated by increased dimensionality
- Maintain values for existing parameters unaffected by new data
Resumed Analysis
- Restart MCMC analysis using the augmented tree as starting point
- Utilize previously tuned transition kernels for efficient sampling
- Continue sampling until convergence to updated posterior distribution
Validation Applications This approach has been validated using data from the West African Ebola virus epidemic, demonstrating substantial reduction in time required to obtain updated posterior estimates at different time points of the outbreak [31].
Data Integration and Visualization
Workflow Diagram
Figure 1: Bayesian Phylodynamic Workflow for R₀ Inference. This diagram illustrates the sequential process from data preparation through to epidemiological inference, highlighting the iterative nature of MCMC convergence assessment.
Data Contribution Assessment
The relative contributions of sequence data and sampling dates to R₀ estimation can be quantified using the Wasserstein metric approach [28]. This method involves four separate analyses:
- Complete data analysis using both sequences and dates
- Date-only analysis retaining sampling times but integrating over tree topology
- Sequence-only analysis keeping sequence data while estimating sampling dates
- Marginal prior analysis with both data sources removed
The Wasserstein distances between the posterior distributions from each partial analysis and the complete data analysis are then calculated as:
Wₐ = ∫₀¹|Fₐ⁻¹(u) - F𝒻⁻¹(u)|du
Where Fₐ and F𝒻 are the cumulative distribution functions for the parameter of interest under the partial and complete data analyses, respectively [28]. This approach enables researchers to classify analyses as date-driven or sequence-driven and quantify the disagreement between signals from different data sources.
Advanced Applications
Specialized Modeling Scenarios
Seedbank Phylodynamics For pathogens with dormant stages (e.g., Mycobacterium tuberculosis), the standard coalescent models are inadequate. The seedbank coalescent implemented in the SeedbankTree package explicitly models active and dormant populations, where only active lineages can coalesce while dormant lineages cannot until reactivation [33]. This fundamentally changes the genealogical structure and requires specialized inference approaches.
Single-Cell Lineage Tracing The GABI package extends phylodynamic inference to single-cell lineage tracing data from CRISPR-based recording systems [32]. This approach enables reconstruction of cell lineage trees from evolving genetic barcodes and quantification of underlying processes like cell division, differentiation, and apoptosis through birth-death process modeling.
Approximate Bayesian Methods For real-time applications where computational speed is critical, approximate Bayesian methods provide alternatives to full MCMC sampling [35]. These include:
- Approximate Bayesian Computation (ABC)
- Bayesian Synthetic Likelihood (BSL)
- Integrated Nested Laplace Approximation (INLA)
- Variational Inference (VI)
These methods balance inferential accuracy with scalability, making them suitable for rapid assessment during ongoing outbreaks [35].
Validation and Interpretation
Model Assessment Techniques
Posterior Predictive Checks Simulate datasets from the posterior predictive distribution and compare them to observed data to assess model adequacy. Discrepancies indicate model misspecification.
Bayesian Model Comparison Calculate marginal likelihoods using methods such as path sampling or stepping-stone sampling to compare different model formulations.
Sensitivity Analysis Assess the influence of prior choices by running analyses with alternative prior distributions and comparing posterior estimates.
Interpretation Guidelines
- Tree Topology: Star-like trees often indicate population expansion, while balanced trees suggest stable populations [29]
- Branch Lengths: Short internal branches relative to external branches may indicate rapid exponential growth [29]
- Parameter Estimates: Consider credible intervals rather than point estimates, and correlate with epidemiological context
- Data Influence: Use methods to determine whether sequence data or sampling dates are driving inferences [28]
The field of Bayesian phylodynamics continues to evolve rapidly, with ongoing developments in modeling frameworks, computational approaches, and applications to public health challenges. The protocols outlined here provide a foundation for implementing these methods in reproduction number estimation and related epidemiological inferences.
Phylodynamics, which combines evolutionary, demographic, and epidemiological concepts, provides a powerful framework for estimating the basic reproduction number (R0) directly from pathogen genetic sequence data [8] [36]. The basic reproduction number (R0) is defined as the average number of secondary infections caused by a single infected individual in a fully susceptible population, serving as a crucial indicator of a pathogen's transmissibility and a population's risk of an major outbreak [37]. Unlike the time-varying reproduction number (R), R0 represents the intrinsic transmissibility at the start of an epidemic before control measures are implemented or immunity develops [37].
The integration of phylogenetic analysis with traditional epidemiological models has created powerful tools for understanding the geospatial and temporal dynamics of pathogens at the population level [8]. During the COVID-19 pandemic, phylodynamic approaches proved essential for tracking SARS-CoV-2 genetic changes, identifying emerging variants, and informing public health strategy [36]. These methods allow researchers to infer epidemiological parameters such as R0, transmission patterns, and population size changes from viral genome sequences collected over time [8] [24].
BEAST2: Bayesian Evolutionary Analysis Sampling Trees
BEAST2 is a free software package for Bayesian evolutionary analysis of molecular sequences using Markov Chain Monte Carlo (MCMC) methods, strictly oriented toward inference using rooted, time-measured phylogenetic trees [38]. For R0 estimation, BEAST2 implements specific phylodynamic models that connect pathogen genetic diversity with epidemiological dynamics through mathematical models [24] [39]. The software can incorporate serially sampled genetic data with sampling dates to estimate the timescale of evolutionary trees and evolutionary rates by connecting temporal information in sampling times to genetic similarities in sequences [8].
Key capabilities of BEAST2 for R0 estimation include:
- Implementation of both deterministic and stochastic epidemic models
- Estimation of R0 and other epidemiological parameters directly from genetic data
- Handling of large genomic datasets with complex evolutionary models
- Flexible model specification through BEAUti or direct XML configuration
Nextstrain: Real-Time Phylogenomic Visualization
Nextstrain is an open-source platform for real-time tracking of pathogen evolution, with Auspice as its interactive visualization application [40]. The platform is designed to be highly interactive, versatile, and usable as a communication platform to quickly disseminate results to the wider community [40]. While BEAST2 focuses on statistical inference of parameters, Nextstrain specializes in the visualization and interpretation of phylogenetic results in an epidemiological context.
Nextstrain's capabilities include:
- Interactive visualization of phylogenetic relationships
- Mapping of putative transmissions on geographic maps
- Visualization of genetic variability across genomes
- Real-time narrative building for outbreak communication
Phylodynamic Models for R0 Estimation in BEAST2
Coalescent SIR Model
The coalescent SIR model is an epidemic model that assumes three population compartments: Susceptible (S), Infected (I), and Removed (R) [24]. This model, available through BEAST2's phylodynamics package, allows estimation of several key parameters from genetic sequence data [24] [39].
The model estimates the following parameters:
- R0: Basic reproduction number
- beta: Transmission rate
- gamma: Removal rate
- S0: Initial number of susceptibles
- z0: Time of origin
These parameters are functionally related through the equation: R0 = beta × S0 / gamma [24]. This relationship means researchers can estimate either R0 or beta directly and calculate the other using this formula.
BEAST2 implements both deterministic and stochastic versions of the coalescent SIR model. The deterministic model solves a set of ordinary differential equations (ODEs) for S, I, and R compartments, while the stochastic model simulates trajectories of S, I, and R through a jump process [24]. The deterministic approach is significantly faster (approximately 3× faster according to documentation) and is recommended for large R0 values (>1.5) and large S0, while the stochastic model may be more appropriate for smaller R0 values or when the stochastic nature of transmission is particularly important to capture [24].
Birth-Death SIR Model
An alternative to the coalescent approach is the Birth-Death SIR (BDSIR) model, also available in the BEAST2 phylodynamics package [39]. Under this epidemiological framework, a "birth" event corresponds to disease transmission, while a "death" event represents recovery or death of an infected individual [8]. The birth-death SIR model uses a constant birth-death rate to model epidemic spread, similar to how speciation and extinction are modeled in evolutionary biology [8].
Comparative studies suggest the coalescent SIR model can provide smaller confidence intervals for parameter estimates compared to birth-death SIR approaches, potentially offering more precise estimates of R0 from similar data [24].
Table 1: Key Parameters in BEAST2 Phylodynamic Models for R0 Estimation
| Parameter | Description | Interpretation in Epidemiology | Typical Prior Ranges |
|---|---|---|---|
| R0 | Basic reproduction number | Average secondary cases per infected individual; >1 indicates sustained transmission | >1 (often 1.5-4 for SARS-CoV-2) |
| beta | Transmission rate | Rate at which susceptible individuals become infected | Dependent on population size |
| gamma | Removal rate | Inverse of average infectious period (1/infectious period) | Based on clinical observations |
| S0 | Initial susceptible population | Number susceptible at start of epidemic | Often fixed to known population |
| origin (z0) | Time of epidemic origin | When epidemic began | Must predate root of tree |
Experimental Protocol for R0 Estimation
The following workflow diagram illustrates the complete experimental protocol for R0 estimation using BEAST2 and results visualization with Nextstrain:
Diagram 1: R0 Estimation Workflow
Data Preparation and XML Configuration
Sequence Data and Metadata Requirements: For accurate R0 estimation, datasets should include:
- Pathogen genetic sequences (whole genome or specific genes)
- Precise collection dates for each sequence (serial sampling)
- Geographic location data for phylogeographic analysis
- Any relevant host or clinical metadata
The data must be aligned and formatted appropriately (typically FASTA format for sequences). Sampling dates are specified in the sequence headers or in a separate trait file [24].
XML Configuration for Coalescent SIR Model: Configuring BEAST2 for coalescent SIR analysis involves several key components in the XML file [24]:
State Definition: Set initial values for parameters including:
- Origin time (z0): Must be older than the root of the tree
- S0: Initial susceptible population (estimate of population size)
- R0: Basic reproduction number (must be >1 for epidemic)
- Gamma: Removal rate
Tree Prior Specification: Incorporate the coalescent SIR model as a tree prior:
Priors and Operators: Define appropriate prior distributions and MCMC operators for efficient parameter exploration. For R0, a log-normal or exponential prior is often appropriate with bounds ensuring R0>1. For the origin time, a uniform prior with reasonable upper bound is typically used [24].
Loggers: Configure parameter loggers to record MCMC samples for posterior analysis, including R0, S0, gamma, and origin time.
Model Execution and Diagnostics
Running the Analysis: Execute the BEAST2 analysis with the configured XML file. For large datasets, consider using:
- BEAGLE library to accelerate computation
- Multiple parallel MCMC chains to assess convergence
- Appropriate chain lengths to ensure effective sample sizes (ESS) >200 for all parameters
MCMC Diagnostics: After running BEAST2, critical diagnostic steps include:
- Check ESS values for all parameters using Tracer
- Assess MCMC chain convergence and mixing
- Verify that prior distributions are not overly influencing posterior estimates
- Ensure that the origin time (z0) is indeed older than the tree root
Results Visualization and Interpretation
Visualizing Parameter Estimates in R: The BEAST2 output (.log file) contains posterior samples of model parameters that can be analyzed and visualized in R [38]:
Visualizing Time-Stamped Phylogenies: The posterior trees (.trees file) can be summarized and visualized using Maximum Clade Credibility (MCC) trees in R with ggtree [38]:
Interactive Visualization with Nextstrain: For sharing and communicating results, Nextstrain provides interactive visualization capabilities [40]:
- Annotate trees with geographic and temporal metadata
- Create interactive narratives explaining transmission dynamics
- Visualize spatial spread alongside phylogenetic relationships
- Share results through web-based interfaces
Table 2: Troubleshooting Common Issues in BEAST2 R0 Estimation
| Problem | Potential Causes | Solutions |
|---|---|---|
| Poor MCMC mixing | Improper operators, insufficient chain length | Adjust operator weights, increase chain length, use parameter transformations |
| Low ESS values | Inefficient sampling, model misspecification | Run longer chains, simplify model, check parameter priors |
| R0 estimates at boundary | Prior too restrictive, insufficient data | Widen prior distributions, increase sequence data |
| Origin time too recent | Improper prior, data doesn't fit model | Adjust origin prior, check sequence dates |
| Unrealistically high R0 | Model misspecification, poor clock model | Validate clock model, add appropriate covariates |
The Scientist's Toolkit
Table 3: Essential Research Reagents and Computational Tools for Phylodynamic R0 Estimation
| Tool/Reagent | Type | Primary Function | Application in R0 Research |
|---|---|---|---|
| BEAST2 | Software Platform | Bayesian evolutionary analysis | Core inference engine for phylodynamic parameters |
| phylodynamics package | BEAST2 Package | Epidemic model implementation | Provides Coalescent SIR and Birth-Death SIR models |
| Nextstrain/Auspice | Visualization Platform | Interactive phylogenomic visualization | Communication of spatiotemporal transmission dynamics |
| BEAUti | Configuration Tool | Graphical XML configuration | Simplifies model specification for BEAST2 analyses |
| Tracer | Diagnostic Tool | MCMC output analysis | Assesses convergence and mixing of parameter estimates |
| ggtree R package | R Package | Phylogenetic tree visualization | Creates publication-quality figures of time-scaled trees |
| TreeAnnotator | Summary Tool | MCC tree generation | Summarizes posterior tree distribution for visualization |
| COVARIANCE & BDOU | BEAST2 Packages | Advanced model features | Enables more complex clock models and population structures |
Case Study: SARS-CoV-2 R0 Estimation During COVID-19 Pandemic
The COVID-19 pandemic provided a significant real-world application for phylodynamic R0 estimation using BEAST2 and Nextstrain. Multiple studies demonstrated the practical utility of these approaches for public health decision-making.
Early Pandemic Investigation: Phylodynamic analyses of early SARS-CoV-2 sequences estimated the origin of the outbreak to Wuhan, China between November and December 2019 (95% CI: November 21-December 20, 2019) [8]. Estimates of R0 from these analyses ranged between 2.15-2.5, consistent with independent epidemiological estimates [8] [36]. These analyses used coalescent and birth-death models in BEAST2 to simultaneously estimate evolutionary and epidemiological parameters from genetic data.
Assessing Intervention Effectiveness: Phylodynamic methods tracked how R0 changed in response to interventions. In Australia, a birth-death skyline approach estimated a reduction in Rt from 1.63 to 0.48 following travel restrictions and social distancing implemented on March 27, 2020 [36]. Similarly, analysis of a New Zealand transmission cluster showed Rt falling from 7.0 to 0.2 during March 2020, demonstrating the impact of targeted interventions [36].
Global Spread Analysis: Nextstrain visualizations were instrumental in communicating the patterns of global spread, showing how earlier SARS-CoV-2 lineages were highly cosmopolitan while later lineages became more continent-specific, reflecting the impact of international travel restrictions [36]. These visualizations helped public health officials and policymakers understand the effectiveness of various containment measures.
The integration of BEAST2 for parameter estimation and Nextstrain for visualization created a powerful framework for real-time analysis during the pandemic, enabling researchers to estimate key parameters like R0 while effectively communicating findings to diverse audiences.
The basic reproduction number, R₀, is a cornerstone metric in epidemiology, indicating the average number of secondary infections produced by a single infected individual in a fully susceptible population [41]. Accurate estimation of R₀ is critical for predicting epidemic trajectories, evaluating the potential severity of an outbreak, and designing effective control strategies. This case study delves into the phylodynamic inference of R₀ for two major respiratory pathogens: SARS-CoV-2 and Influenza. Phylodynamics integrates epidemiological dynamics with pathogen genetic sequences to infer key transmission parameters, offering a powerful tool for reconstructing outbreak dynamics, especially when traditional surveillance data are incomplete or unreliable [4]. This approach is framed within a broader thesis on advancing phylodynamic inference methodologies for more robust and timely R₀ estimation.
The core distinction between the Basic Reproduction Number (R₀) and the Effective Reproduction Number (Rₜ) is fundamental. R₀ describes the intrinsic transmissibility of a pathogen at the start of an outbreak, absent any interventions or pre-existing immunity. In contrast, Rₜ reflects the time-varying reproduction number as an epidemic progresses, influenced by population immunity, interventions, and changing behaviors [41]. An R₀ greater than 1 indicates a potential for sustained epidemic growth, while an Rₜ sustained below 1 signals that an outbreak is under control.
This document provides a structured comparison of R₀ for SARS-CoV-2 and Influenza, details experimental protocols for its estimation, and explores the integration of spatiotemporal data to enhance the accuracy and robustness of these estimates.
Quantitative Comparison of R₀ and Key Parameters
Table 1 summarizes the estimated R₀ ranges and key epidemiological parameters for SARS-CoV-2 (including major variants) and Influenza, contextualized with other notable pathogens for comparison. The estimates for SARS-CoV-2 illustrate its rapid evolution and increasing transmissibility.
Table 1: Comparative R₀ Estimates and Epidemiological Parameters for SARS-CoV-2, Influenza, and Other Pathogens
| Virus / Strain | Estimated R₀ Range | Key Epidemiological Parameters | Comparative Context |
|---|---|---|---|
| SARS-CoV-2 (Wuhan) | 2.2 – 2.6 [41] | Mean Serial Interval: ~6.6 days [42] | More transmissible than Influenza (R₀ ~1.2-1.6) [41] |
| SARS-CoV-2 BA.2 | ~12 [41] | Similar transmissibility to Chickenpox (R₀ 10-12) [41] | |
| SARS-CoV-2 BA.2.12.1 | 16 – 22 [41] | Rivals or exceeds Measles (R₀ 16-18) [41] | |
| Influenza (Seasonal) | 1.2 – 1.6 [41] | Symptomatic Cases (US, 2010-2024): 9M – 40M annually [43] | |
| SARS (2003) | ~4 [41] | ||
| MERS | <1 [41] | ||
| Measles | 16 – 18 [41] | Benchmark for high transmissibility |
The public health burden of these viruses is substantial. As of late 2025, COVID-19 infections were growing or likely growing in 19 U.S. states, while influenza infections were growing or likely growing in 42 states, demonstrating their ongoing and significant transmission [44]. Vaccination plays a crucial role in mitigating this burden. For influenza, modeling studies estimate that vaccination with 40% effectiveness can avert between 32.9% and 41.5% of the influenza case burden, providing direct protection to vaccinated individuals and indirect benefits to the unvaccinated [43].
Methodological Framework for R₀ Estimation
Estimating the reproduction number presents several challenges. The methods are sensitive to assumptions about the generation interval (the time between infection of an infector and an infectee), and estimates can be biased by shifts in testing capacity, reporting practices, and clinical severity [44] [45]. Furthermore, delays between infection and case observation can cause temporal inaccuracy in Rₜ estimates, making it difficult to pinpoint exactly when transmission changes occur [45].
Foundational Estimation Methods
Several empirical methods are commonly used for estimating Rₜ, which can be leveraged to infer R₀ during the early exponential phase of an outbreak.
- Cori et al. (EpiEstim): This method estimates the instantaneous reproductive number and is recommended for near real-time estimation [45]. It uses data from before time t and an empirically determined distribution of the generation interval. The estimator is formulated as: Rₜ = Iₜ / Σ (Iₜ₋ₛ × wₛ), where Iₜ is the number of infections on day t, and wₛ is the generation interval distribution [45].
- Wallinga and Teunis: This method calculates the case reproductive number, which is more suited for retrospective analyses of how individuals infected at different time points contributed to spread. It often requires data from after time t to produce robust estimates [45].
- Bettencourt and Ribeiro: This approach is generally advised against, as it can produce biased estimates if its underlying structural assumptions (e.g., an exponential generation interval) are not met [45].
Phylodynamic Inference
Phylodynamics connects pathogen evolution to epidemiology. The core premise is that the phylogenetic tree of pathogen samples, reconstructed from their genome sequences, contains information about the population dynamics of the infected host population [4]. Two foundational models are used as tree priors in Bayesian phylogenetic inference software like BEAST:
- Coalescent Model: A backwards-in-time model that describes the ancestry of sampled sequences. The rate at which lineages coalesce (find a common ancestor) is inversely related to the effective population size (Nₑ(t)), which, under certain assumptions, can be linked to the number of infected individuals I(t) and thus used to infer Rₜ [4].
- Birth-Death Model: A forward-in-time model that explicitly models transmission (birth), and removal (death, which includes recovery, death, or sampling). This model can directly parameterize the reproductive number and sampling rates, providing a more natural framework for epidemic data [4].
The following workflow diagram illustrates the integrated process of phylodynamic inference for estimating R₀.
Advanced Protocol: Integrating Spatiotemporal Data
Leveraging the spatial structure of incidence data can significantly improve the accuracy and robustness of reproduction number estimates, especially when dealing with noisy or incomplete data, as was common during the COVID-19 pandemic [42]. The following protocol outlines a joint estimation procedure for the reproduction number and the underlying spatial connectivity structure.
Objective: To jointly estimate the spatiotemporal reproduction number (R_{c,t}) and the inter-territory connectivity structure from infection count time series across multiple territories (e.g., countries, states).
Materials and Data:
- Infection Count Time Series: Daily or weekly confirmed case counts for each territory under study, over a defined time period.
- Serial Interval Distribution: A discretized probability distribution for the time between primary and secondary infections. For COVID-19, this is often modeled as a Gamma distribution with a mean of 6.6 days and a standard deviation of 3.5 days, truncated at 25 days [42].
- Spatial Unit Metadata: Geographic or demographic information for the territories to define an initial, simplistic connectivity graph (e.g., an unweighted graph based on shared borders).
Procedure:
- Model Specification: Assume a scaled Poisson model for the infection counts in territory c at time t, conditional on past counts and the reproduction number R{c,t} [42]: *Z{c,t} / γc | Z{c,1}, ..., Z{c,t-1}; R{c,t} ~ Poisson( (R{c,t} × Φ^{Z}{c,t}) / γc )*. Here, Φ^{Z}{c,t} = Σ{s=1}^{τ} ϕ(s) Z{c,t-s} is the total infectiousness from past cases, ϕ(s) is the serial interval, and γ_c is a territory-specific scale parameter modulating count variance.
Define Variational Estimator: Formulate an optimization problem that minimizes a cost function with three key components:
- Data Fidelity Term: A scaled Kullback-Leibler divergence that measures the fit between the model and the observed data according to the scaled Poisson likelihood.
- Temporal Regularization: An L1-norm penalty on the second derivative of R_{c,t} over time to enforce a piecewise linear and realistic temporal behavior.
- Spatial Regularization: A graph-based penalty, such as a graph total variation term, to enforce smoothness of R_{c,t} across connected territories.
Joint Estimation via Alternating Optimization: Implement an iterative algorithm to solve the problem.
- Step 1 (R-estimation): Hold the graph Laplacian (L) fixed and solve for the spatiotemporal field R_{c,t}.
- Step 2 (Graph Learning): Hold R_{c,t} fixed and estimate the graph Laplacian (L) from the reproduction number profiles, promoting connectivity structures that explain the similarity in epidemic dynamics across territories.
- Iterate until convergence.
The schematic below illustrates the conceptual relationship between the different estimation methods and their optimal use cases.
The Scientist's Toolkit: Research Reagents & Computational Solutions
Table 2 provides a non-exhaustive list of key software tools and packages essential for implementing the R₀ estimation methods discussed in this case study.
Table 2: Key Research Tools for Reproduction Number Estimation and Phylodynamic Analysis
| Tool / Package Name | Primary Function | Application Context |
|---|---|---|
| EpiEstim (R) | Implements the Cori et al. method for real-time Rₜ estimation. | Statistical estimation of the instantaneous reproduction number from case incidence data and the serial interval [45]. |
| EpiNow2 (R) | A Bayesian framework for estimating Rt, accounting for delays and reporting effects. | Used by the U.S. CDC for its official Rt estimates based on emergency department data [44]. |
| BEAST2 | Bayesian evolutionary analysis by sampling trees. A software platform for phylogenetic and phylodynamic analysis. | Infers time-scaled phylogenies and epidemiological parameters (like R₀) using coalescent or birth-death models with genomic data [4]. |
| FRED (Framework for Reconstructing Epidemiologic Dynamics) | An agent-based modeling platform. | Simulates disease spread in synthetic populations to estimate burden and model the impact of interventions; produces Rt as an output of simulations [43]. |
| Graph-Based Regularization Algorithms | Custom algorithms for joint estimation of Rt and spatial connectivity. | Advanced research tool for enhancing estimation accuracy by leveraging spatial structure in incidence data across multiple territories [42]. |
Escherichia coli sequence type 131 (ST131) has emerged as a globally significant extraintestinal pathogenic E. coli (ExPEC) clone, representing a "stealth pandemic" responsible for a substantial proportion of urinary tract infections and bacteremia cases worldwide [46]. Unlike viral pandemics with rapid, visible spread, ST131 dissemination occurs unnoticed due to asymptomatic gut colonization and the opportunistic nature of subsequent infections, making its detection and quantification challenging through conventional surveillance [21]. The application of phylodynamic inference methods, which integrate phylogenetic analysis with epidemiological models, has proven essential for understanding the transmission dynamics and calculating the reproduction number (R₀) of this clinically important bacterial clone [8].
The ST131 lineage is phylogenetically structured into several major clades (A, B, and C, with clade C further divided into subclades C1 and C2), each exhibiting distinct epidemiological and resistance profiles [47] [48]. Recent research has revealed that specific ST131 sublineages carrying papGII pathogenicity islands demonstrate convergence of virulence and antimicrobial resistance (AMR), representing an increasingly prevalent threat due to their association with invasive infections and extensive drug resistance [48]. This case study examines how phylodynamic approaches have uncovered the transmission dynamics of ST131 clones, providing a framework for analyzing hidden bacterial pandemics.
Quantitative Epidemiology of E. coli ST131 Clones
Reproduction Number (R₀) Estimates
The basic reproduction number (R₀) serves as a fundamental metric for comparing transmission dynamics across pathogens. Recent research utilizing compartmental models fitted to genomic surveillance data has provided the first quantitative estimates of R₀ for major ST131 clades [21].
Table 1: Basic Reproduction Number (R₀) Estimates for ST131 Clades and Other Pathogens
| Pathogen / ST131 Clade | R₀ Value | Epidemiological Context |
|---|---|---|
| ST131 Clade A | 1.47 | Markedly higher transmission efficiency in underlying population [21] |
| ST131 Clade C1 | 1.18 | Lower transmissibility, potentially aided by antibiotic selection [21] |
| ST131 Clade C2 | 1.13 | Lowest transmissibility among major ST131 clades [21] |
| Pandemic Influenza Viruses | ~1.47 | Comparable to ST131-A transmission potential [21] |
| SARS-CoV-2 (early pandemic) | 2.15 (95% CI: 1.79-2.75) | Higher transmissibility than ST131 clones [8] |
These R₀ estimates reveal that ST131-A exhibits transmission potential comparable to pandemic influenza viruses, suggesting similar inherent dissemination capacity in susceptible populations [21]. The significantly lower transmissibility of ST131-C1 and ST131-C2 indicates that factors beyond pure transmission efficiency, particularly antibiotic selection pressure and spread through healthcare facilities, have likely contributed substantially to their global success [21].
Prevalence and Clinical Impact
ST131 has achieved remarkable global penetration, with significant geographic variation in prevalence and clade distribution:
- In Wales, ST131 accounts for approximately 26% of E. coli bloodstream infections, with clade C/H30 predominating (71.8% of ST131 isolates) [47]
- Among veterans in the United States, ST131 accounts for more than one-quarter of all E. coli isolates nationally, with dramatically higher representation among resistant strains (78% of fluoroquinolone-resistant E. coli and 64% of ESBL-producing E. coli) [46]
- The prevalence of papGII+ ST131 isolates among human clinical isolates has increased dramatically since 2005, now accounting for approximately half of recent E. coli bloodstream isolates [48]
Table 2: Global Distribution of ST131 Clades and Associated Resistance Markers
| Clade | Primary Serotype | Key Resistance Features | Prevalence Trends |
|---|---|---|---|
| Clade A | O16:H5 | Variable ESBL genes; lower resistance prevalence | ~15.5% of Welsh bacteremia isolates [47] |
| Clade B | O25b:H4 | Lower fluoroquinolone resistance | ~12.0% of Welsh bacteremia isolates [47] |
| Clade C1 | O25b:H4 | QRDR mutations; blaCTX-M-14/27 | Subset of predominant clade C [48] |
| Clade C2 | O25b:H4 | QRDR mutations; chromosomally integrated blaCTX-M-15 | ~72.5% of Welsh bacteremia isolates [47] |
The convergence of virulence and antimicrobial resistance is particularly pronounced in papGII+ ST131 sublineages, which carry significantly more AMR genes than papGII-negative isolates (average 8.7 vs. 6.3 ARGs) [48]. This combination of enhanced virulence and resistance likely explains the increasing prevalence of these sublineages in severe infections.
Experimental Protocols for Phylodynamic Inference of R₀
Hybrid Compartmental Model for Bacterial Transmission
The quantification of R₀ for ST131 requires specialized methodological approaches that account for the unique aspects of bacterial transmission compared to viral pathogens:
Data Requirements and Sources:
- Systematic genomic surveillance of clinical isolates (e.g., bloodstream infection isolates across a defined population and time period) [21]
- Asymptomatic colonization data from representative population sampling (e.g., shotgun metagenomics from birth cohorts) [21]
- Demographic statistics and infection incidence rates from national surveillance systems [21]
- Clade-specific odds ratios comparing frequency of asymptomatic colonization to bloodstream infection from temporally and geographically matched populations [21]
Model Specification:
- Develop a compartmental SIR-like colonization model (Susceptible-Colonized-Recovered) for the host population at the national level [21]
- Incorporate an observation model that links colonization prevalence with observed annual bloodstream infection incidence [21]
- Account for clade-specific differences in invasion potential (probability of causing bloodstream infection following colonization) [21]
Parameter Inference using Approximate Bayesian Computation (ABC):
- Implement simulation-based inference methods to overcome intractable likelihood functions [21]
- Calibrate model parameters through forward simulation of the asymptomatic spread and comparison with observed infection data [21]
- Generate posterior distributions for R₀ and other transmission parameters for each ST131 clade [21]
Figure 1: Phylodynamic Inference Workflow for ST131 R₀ Estimation
Phylogenetic Cluster-Based Method for Transmission Heterogeneity
Recent advances enable estimation of transmission parameters directly from the size distribution of clusters of identical sequences, providing a complementary approach to full phylodynamic modeling [49]:
Cluster Definition and Identification:
- Identify clusters of identical sequences from whole-genome sequencing data of clinical isolates [49]
- Define cluster size as the number of infections with identical consensus genome sequences [49]
- Account for sampling fraction (proportion of infections sequenced) in the population [49]
Statistical Framework:
- Model the number of secondary cases with identical genomes as following a negative binomial distribution with mean p×R and dispersion parameter k [49]
- The probability p represents the likelihood that an infectee has the same consensus genome as their infector [49]
- Implement maximum likelihood estimation to infer R and k from the cluster size distribution [49]
Interpretation Considerations:
- The method produces unbiased estimates when R < 1/p, where p is the probability of identical transmission [49]
- Below this threshold, increasing the number of clusters improves estimation precision [49]
- This approach is particularly valuable for acute infections with narrow transmission bottlenecks [49]
The Scientist's Toolkit: Essential Research Reagents and Materials
Table 3: Key Research Reagents and Materials for ST131 Phylodynamic Studies
| Reagent/Material | Specific Example | Application and Function |
|---|---|---|
| ST131 Clade Detection PCR | O16-clade-specific PCR [50]; O25b rfb variant detection [51] | Rapid clade assignment and screening of isolate collections |
| MLST Typing Reagents | Achtman MLST scheme (adk, fumC, gyrB, icd, mdh, purA, recA) [50] | Standardized sequence typing and international comparison |
| Virulence Gene Detection | Multiplex PCR for papGII, hly, iro, iuc, ybt [51] [48] | Assessment of virulence potential and pathoadaptive characteristics |
| Antibiotic Susceptibility Testing | CLSI-compliant discs for FQ, 3GC, aminoglycosides [51] [52] | Phenotypic resistance profiling and correlation with genotypic markers |
| Biofilm Assay Materials | Crystal violet, Congo red agar, microtiter plates [52] | Quantification of biofilm formation as virulence factor |
| Whole Genome Sequencing | Illumina platforms for draft genomes; long-read for reference [47] [48] | Comprehensive genomic characterization and phylogenetic analysis |
| Phylodynamic Software | BEAST for Bayesian evolutionary analysis [8] [9] | Integration of temporal and genetic data for parameter estimation |
| ABC Inference Tools | Custom algorithms for simulator-based inference [21] | Parameter estimation for models with intractable likelihoods |
Signaling Pathways and Virulence Mechanisms in ST131
The epidemiological success of ST131 is underpinned by specific genetic elements that enhance both transmission and pathogenic potential:
Figure 2: ST131 Virulence and Resistance Mechanisms Driving Transmission
The papGII pathogenicity island encodes P fimbriae that facilitate attachment to kidney epithelium, triggering inflammation and tissue damage that promotes bloodstream invasion [48]. This specific virulence mechanism is significantly associated with increased antimicrobial resistance genes, creating a convergence of virulence and resistance that likely drives the expansion of papGII+ sublineages [48].
Additionally, biofilm formation capabilities enhance both colonization persistence and protection from antibiotics, while siderophore systems (aerobactin and yersiniabactin) enable efficient iron acquisition in the nutrient-limited extraintestinal environment [48] [52]. These factors collectively contribute to the enhanced transmission (R₀ > 1) observed in successful ST131 clades.
Discussion and Research Implications
The phylodynamic inference of R₀ for ST131 clones represents a significant methodological advancement in bacterial epidemiology, providing a quantitative framework for understanding the spread of opportunistic pathogens that traditional surveillance methods cannot capture. The finding that ST131-A exhibits transmission potential comparable to pandemic influenza underscores the considerable dissemination capacity of this bacterial clone, while the differential success of various ST131 clades highlights the complex interplay between inherent transmissibility, antibiotic selection pressure, and healthcare-associated spread [21].
Several important research implications emerge from these findings:
- Enhanced Genomic Surveillance: The demonstrated value of genomic epidemiology for detecting localized transmission clusters and tracking clade-specific prevalence supports the expansion of systematic sequencing programs for bacterial pathogens [47]
- Antibiotic Stewardship: The role of antibiotic selection in facilitating the spread of lower-transmissibility but higher-resistance clones (e.g., ST131-C2) underscores the importance of prudent antimicrobial use [21]
- Vaccine Development: Identification of conserved virulence factors across successful ST131 clades, particularly papGII, provides potential targets for intervention strategies [48]
- Methodological Transfer: The phylodynamic approaches pioneered for ST131 can be extended to other bacterial pathogens causing hidden pandemics, expanding our understanding of microbial spread beyond acute viral infections [21]
Future research directions should focus on integrating genomic data with detailed epidemiological metadata to better understand the specific transmission networks (e.g., healthcare facilities, long-term care facilities, community settings) driving ST131 dissemination [46]. Additionally, experimental studies examining the mechanistic basis for differential transmissibility between clades could identify novel targets for interrupting transmission. As phylodynamic methods continue to evolve, their application to bacterial pathogens will undoubtedly yield further insights into the hidden pandemics affecting human health.
Application Note: Phylodynamic Inference of R0 in Ebola Virus Disease Outbreaks
Ebola virus disease (EVD) represents a significant global health threat characterized by high pathogenicity and transmissibility, with the potential for superspreading events within clusters. The basic reproduction number (R0) serves as a crucial epidemiological metric for quantifying transmission potential during outbreaks. Phylodynamic methods have emerged as powerful tools for estimating R0 from viral genome sequences, providing independent estimates that complement traditional surveillance data. These approaches are particularly valuable when surveillance systems are overwhelmed and case reporting is incomplete [53]. During the 2013-2016 West African Ebola epidemic, phylodynamics provided critical insights into transmission dynamics and the effectiveness of intervention strategies, demonstrating how pathogen genomes can inform specific outbreak control questions [54].
Quantitative R0 Estimates for Ebola Virus Disease
Table 1: Pooled mean Ebola R0 estimates across affected countries from systematic review and meta-analysis
| Country | Pooled Mean R0 | 95% Confidence Interval | Reported R0 Range |
|---|---|---|---|
| Nigeria | 9.38 | 4.16 – 14.59 | 1.2 – 10.0 |
| DR Congo | 3.31 | 2.30 – 4.32 | 1.2 – 5.2 |
| Uganda | 2.0 | 1.25 – 2.76 | 1.34 – 2.7 |
| Liberia | 1.83 | 1.61 – 2.05 | 1.13 – 5 |
| Sierra Leone | 1.73 | 1.47 – 2.0 | 1.14 – 8.33 |
| Guinea | 1.44 | 1.29 – 1.60 | 1.1 – 7 |
| Overall Pooled Mean | 1.95 | 1.74 – 2.15 | 1.1 – 10.0 |
A systematic review and meta-analysis of 53 studies from six African countries provided 97 Ebola mean R0 estimates, revealing substantial heterogeneity across outbreaks. The overall pooled mean Ebola R0 was 1.95 (95% CI 1.74–2.15), with high heterogeneity (I² = 99.99%) and evidence of small-study effects [20].
Table 2: Phylodynamic R0 estimates from the 2014 Sierra Leone outbreak using different models
| Model Type | Mean Latent Period | R0 Estimate | 95% HPD Interval | Key Findings |
|---|---|---|---|---|
| SEIR Model | 5.3 days | 2.40 | 1.54-3.87 | Evidence for superspreading |
| SEIR Model | 12.7 days | 3.81 | 2.47-6.3 | Extreme variance in transmissions |
| Birth-Death Model | Not specified | 1.26 | 1.04-1.54 | Reflects effective reproduction number (Re) |
Analysis of 78 whole EBOV genomes from Sierra Leone in 2014 revealed that R0 estimates are sensitive to the unknown latent period, which cannot be reliably estimated from genetic data alone. The studies found significant evidence for superspreading and extreme variance in the number of transmissions per infected individual during the early epidemic in Sierra Leone [53] [55].
Experimental Protocol: Phylodynamic R0 Estimation for Ebola Virus
Sample Collection and Sequencing
Protocol: Viral genome sequencing from clinical specimens during acute outbreak response
- Sample Acquisition: Collect whole blood from suspected Ebola cases with appropriate ethical approvals and biosafety precautions (BSL-4 containment). Sample from distinct patients across multiple time points and geographic locations [53].
- RNA Extraction: Perform viral RNA extraction using commercial kits (e.g., QIAamp Viral RNA Mini Kit) following manufacturer protocols.
- Library Preparation and Sequencing: Utilize reverse transcription-PCR for cDNA generation, followed by whole-genome sequencing using either:
- Sequence Assembly: Generate consensus sequences using appropriate bioinformatics pipelines (e.g., ARTIC amplicon pipeline for amplicon-based sequencing) [57].
Phylogenetic and Phylodynamic Analysis
Protocol: Bayesian evolutionary analysis for phylodynamic inference
- Sequence Alignment: Perform multiple sequence alignment of generated genomes with appropriate reference sequences using MAFFT or MUSCLE.
- Evolutionary Model Selection: Identify best-fitting nucleotide substitution model using ModelTest or bModelTest [56].
- Molecular Clock Calibration: Apply strict or relaxed molecular clock models based on sampling date information. For Ebola, substitution rates range between ~1.0 × 10⁻³ and ~2.0 × 10⁻³ substitutions/site/year [57].
- Tree Prior Selection: Implement appropriate tree priors for epidemic growth:
- Parameter Estimation: Run Markov Chain Monte Carlo (MCMC) analysis in BEAST2 for at least 100 million generations, sampling every 10,000 steps [53] [55].
- Convergence Assessment: Check effective sample sizes (ESS > 200) for all parameters in Tracer software.
- R0 Calculation: Extract R0 estimates from birth-death model parameters, calculating as R0 = (r/ρ) + 1, where r is the growth rate and ρ is the rate of becoming non-infectious [55].
Methodological Considerations for Ebola Phylodynamics
Several methodological factors significantly impact R0 estimates in Ebola outbreaks. The assumed duration of the latent period substantially influences results, with estimates ranging from R0=2.40 (95% HPD:1.54-3.87) with a 5.3-day latent period to R0=3.81 (95% HPD:2.47-6.3) with a 12.7-day latent period [53]. Phylodynamic analyses of sequences collected from patients receiving care typically reflect the effective reproduction number (Re) rather than the true R0, as they account for public health control measures already in place [55]. Recent outbreaks have shown higher substitution rates than recorded for earlier outbreaks, which must be considered in molecular clock calibrations [55].
Diagram 1: Phylodynamic R0 estimation workflow for Ebola virus outbreaks
Application Note: Phylodynamic Approaches for HIV Transmission Dynamics
HIV phylogenetics has become an essential tool for understanding transmission dynamics in concentrated and generalized epidemics. By analyzing viral genome sequences, researchers can reconstruct transmission networks, identify factors associated with transmission, and evaluate the impact of prevention interventions. Deep-sequence phylogenetic analysis provides particularly high resolution for inferring transmission linkages and directions, offering insights that complement traditional epidemiological approaches [58]. These methods have proven valuable in universal test-and-treat trials to quantify the contribution of geographic, demographic, and intervention factors to ongoing HIV transmission.
Quantitative Findings from HIV Transmission Studies
Table 3: HIV deep-sequence phylogenetics findings from the Ya Tsie trial in Botswana
| Transmission Characteristic | Finding | Implications for Control |
|---|---|---|
| Geographic Pattern | Most transmissions occurred within same or neighboring communities | Supports localized, targeted prevention strategies |
| Age Mixing | Transmissions primarily occurred between similarly aged partners | Contrasts with hypothesis that age-disparate relationships drive transmission in this setting |
| Gender Contribution | Men and women contributed similarly to HIV spread | Indicates need for gender-balanced prevention approaches |
| Intervention Impact | Greater transmission flow into intervention from control communities (30% vs 3% post-baseline) | Compatible with benefit from treatment-as-prevention in intervention communities |
| Trial Context | 5,114 participants sequenced across 30 communities | Largest phylogenetics study in Botswana, providing robust evidence |
The Ya Tsie trial demonstrated how deep-sequence phylogenetics can evaluate intervention effectiveness, revealing that population mobility patterns are fundamental to HIV transmission dynamics and to the impact of HIV control strategies [58].
Experimental Protocol: Deep-Sequence Phylogenetics for HIV Transmission Patterns
Sample Collection and Viral Sequencing
Protocol: Deep sequencing for high-resolution transmission inference
- Sample Acquisition: Collect peripheral blood mononuclear cells (PBMCs) or plasma from HIV-positive participants with appropriate ethical approvals and informed consent.
- Nucleic Acid Extraction: Perform RNA/DNA extraction using commercial kits, with attention to maintaining viral load integrity.
- PCR Amplification: Implement single-genome amplification (SGA) or near-full-length genome amplification to minimize resampling and recombination artifacts [56].
- Next-Generation Sequencing: Utilize deep-sequencing platforms (Illumina, PacBio) to generate thousands of sequences per sample, enabling detection of minor variants and transmission linkages [58].
- Variant Calling: Implement specialized data cleaning and analysis pipelines to distinguish true viral diversity from technical errors common in NGS technologies [56].
Phylogenetic Analysis for Transmission Clustering
Protocol: Identification and characterization of transmission networks
- Sequence Alignment and Quality Control: Perform multiple sequence alignment of HIV genomes with appropriate reference sequences (HXB2). Implement quality control metrics for read depth and coverage.
- Transmission Cluster Definition: Establish criteria for defining transmission clusters, typically based on genetic distance thresholds (e.g., <1.5% genetic distance) and statistical support (e.g., bootstrap values >90%) [56].
- Phylogenetic Tree Reconstruction: Construct phylogenetic trees using maximum likelihood (RAxML, IQ-TREE) or Bayesian methods (BEAST) appropriate for large datasets [56] [58].
- Discrete Trait Analysis: Implement phylogeographic and demographic discrete trait analysis to infer transmission patterns between subgroups (e.g., communities, age groups, trial arms) [58].
- Statistical Integration: Employ generalized linear models to quantify associations between transmission risk and factors such as geographic proximity, age, gender, and randomized intervention [58].
Methodological Considerations for HIV Phylodynamics
HIV phylodynamic studies present unique methodological considerations. The extent of intra-host HIV evolutionary processes affects phylogenetic inference, with evidence suggesting preferential transmission of certain viral variants in heterosexual transmission [56]. Multiplicity of infection varies by transmission route, with higher multiplicity observed in men who have sex with men (MSM) and injection drug users (IDU) compared to heterosexual transmission [56]. Sequencing methodology significantly impacts results, with bulk Sanger sequencing potentially missing multiple infections, while single-genome amplification and next-generation sequencing provide more detailed depiction of intra-host HIV diversity [56]. Interpretation of cluster support values differs between Bayesian posterior probabilities and maximum likelihood bootstrap values, requiring careful consideration when defining transmission clusters [56].
Diagram 2: HIV deep-sequence phylogenetics workflow for transmission studies
Table 4: Key research reagent solutions for phylodynamic studies of viral outbreaks
| Category | Item | Specification/Example | Application Function |
|---|---|---|---|
| Sample Collection & Processing | Viral RNA Extraction Kit | QIAamp Viral RNA Mini Kit | Nucleic acid purification from clinical specimens |
| BSL-4 Containment Facility | Maximum biocontainment | Safe handling of Ebola virus specimens | |
| Molecular Biology Reagents | Reverse Transcriptase | SuperScript IV | cDNA synthesis from viral RNA |
| PCR Amplification Master Mix | ARTIC Network primers | Target amplification for sequencing | |
| DNA Library Prep Kit | Illumina Nextera XT | NGS library preparation | |
| Sequencing Platforms | Next-Generation Sequencer | Illumina MiSeq/Novaseq | High-throughput viral genome sequencing |
| Sanger Sequencer | ABI 3730xl | Traditional sequencing for smaller datasets | |
| Bioinformatics Software | Phylogenetic Analysis | BEAST2, IQ-TREE | Evolutionary analysis and tree building |
| Sequence Analysis | MAFFT, MUSCLE | Multiple sequence alignment | |
| NGS Data Processing | ARTIC amplicon pipeline | Consensus sequence generation from reads | |
| Evolutionary Models | Nucleotide Substitution Model | GTR, HKY | Modeling sequence evolution patterns |
| Molecular Clock Model | Strict vs. Relaxed clock | Incorporating evolutionary rates | |
| Tree Prior | Coalescent, Birth-Death | Modeling population dynamics |
Comparative Analysis and Future Directions
Phylodynamic approaches for Ebola and HIV, while methodologically similar, address distinct epidemiological questions due to differing outbreak contexts. Ebola applications typically focus on rapid R0 estimation during acute outbreaks to inform immediate control measures, while HIV applications more often investigate chronic transmission patterns to evaluate long-term prevention strategies. Both fields benefit from continued methodological refinements, particularly in integrating genomic data with traditional epidemiological information to improve precision of estimates.
Future directions in the field include real-time genomic surveillance systems for rapid outbreak response, integration of mobility and contact network data to enhance spatial transmission models, and development of standardized protocols for defining transmission clusters. As demonstrated during the COVID-19 pandemic, the infrastructure built for HIV and Ebola phylodynamics can be rapidly adapted for emerging pathogens, highlighting the broader value of these methodological approaches for global public health preparedness.
Navigating Pitfalls: Core Challenges and Optimization Strategies in Phylodynamic Inference
Accurate estimation of the basic reproduction number (𝑅0) is fundamental to understanding infectious disease dynamics and informing public health interventions. Phylodynamic methods, which infer epidemiological parameters from pathogen genetic sequences, have become a cornerstone of this effort [59] [3]. However, a core challenge in this field is that genetic sequence data are often not collected in a statistically representative manner. Spatial and temporal non-random sampling can significantly distort phylodynamic inferences, including estimates of 𝑅0, by misrepresenting the true structure and dynamics of the pathogen population [60] [61]. This application note details the sources and impacts of such sampling biases and provides validated protocols to detect, quantify, and correct for them within the context of 𝑅0 research, ensuring more robust epidemiological inferences.
Background
The Phylodynamic Framework for Inferring 𝑅0
Phylodynamics synthesizes evolutionary biology, immunodynamics, and epidemiology to understand how infectious diseases spread and evolve [3] [29]. A key application is the estimation of the effective reproduction number over time, which is derived from estimates of the pathogen's effective population size (𝑁𝑒) trajectory [60] [3]. The link between genetic diversity and epidemic growth allows researchers to infer the reproduction number from pathogen phylogenies [29]. For instance, a rapidly expanding epidemic, characterized by an 𝑅0 > 1, typically produces a "star-like" phylogeny with long external branches relative to internal branches [29].
The Critical Challenge of Sampling Bias
The reliability of these inferences is heavily contingent on the assumption that the sampled genetic sequences are a representative subset of the circulating pathogen population. Violations of this assumption are common and consequential:
- Spatial Sampling Bias: Occurs when sampling efforts are concentrated in specific geographic areas, such as urban centers or near research institutions. This can create apparent "sinks" in phylogeographic models, where overrepresented areas show artificially high rates of inferred migration [60].
- Temporal Sampling Bias: Arises when sequences are sampled unevenly over the course of an epidemic, such as intense sampling during peak outbreak periods and sparse sampling during troughs [60]. Many phylodynamic models assume a constant probability of sampling through time, and violation of this assumption can lead to biased estimates of 𝑅0 and population size trajectories [60].
Table 1: Types and Impacts of Sampling Bias on Phylodynamic Inference
| Bias Type | Common Causes | Primary Impact on Phylodynamics | Effect on 𝑅0 Estimation |
|---|---|---|---|
| Spatial | Uneven geographic distribution of surveillance; focused sampling in outbreak hotspots | Misrepresentation of migration routes and population structure; false "sink" signals [60] | Biased estimates due to incorrect assumptions about host population structure and connectivity [61]. |
| Temporal | Increased sampling during epidemic peaks; limited surveillance during inter-epidemic periods | Distortion of inferred effective population size (𝑁𝑒) trajectories; false bottleneck or expansion signals [60] | Inaccurate reconstruction of epidemic growth rates, directly impacting 𝑅0 calculations [60]. |
| Preferential | Sampling focused on epidemiologically linked cases (e.g., contact tracing) | Non-random sampling of closely related pathogen variants, distorting the inferred phylogeny [61] | Can lead to overestimation or underestimation of 𝑅0 by altering the perceived rate of coalescence events. |
The following diagram illustrates how these sampling biases distort the underlying data and subsequent phylodynamic inference of 𝑅0.
Application Notes: Quantifying and Correcting for Bias
Quantifying the Impact of Heterogeneous Transmission
A significant challenge is that real-world transmission often involves substantial individual heterogeneity, such as super-spreading events. Standard phylodynamic models that assume homogeneous mixing can produce biased inferences when this heterogeneity is present but unaccounted for [61]. Simulation studies have shown that in the presence of super-spreaders, estimates of the epidemic starting date and duration can be substantially overestimated, which would directly impact estimates of the initial reproduction number [61].
Table 2: Inferential Methods for R₀ and Heterogeneity
| Method | Core Principle | Data Requirements | Application to Stuttering Chains |
|---|---|---|---|
| Exponential Growth (EG) | Relates epidemic growth rate (r) to 𝑅0 using the generation time distribution [62] | Case incidence time series; serial interval distribution | Less powerful for early epidemic stages; sensitive to generation time assumptions [62]. |
| Maximum Likelihood (ML) | Finds 𝑅0 that maximizes the likelihood of the observed incidence, given a Poisson offspring distribution [62] | Case incidence time series; serial interval distribution | Assumptions (e.g., no imported cases) are often violated, impacting estimates [62]. |
| Bayesian Time-Dependent | Estimates a time-varying reproduction number using Bayesian inference, with the posterior from one day serving as the prior for the next [62] | Case incidence time series; serial interval distribution | Generally shows less bias and MSE than EG and ML methods; adapts to changing dynamics [62]. |
| Chain Size Distribution (ML) | Uses a negative binomial offspring distribution to infer both 𝑅0 and the dispersion parameter (k) from the distribution of transmission chain sizes [63] | Sizes of observed stuttering transmission chains | Allows estimation of transmission heterogeneity (superspreading) without detailed contact tracing [63]. |
Protocols for Bias Mitigation
The following protocols provide a structured approach to evaluating and confronting sampling bias in phylodynamic studies.
Protocol 1: Assessing Bias via Simulation-Based Validation
This protocol uses simulated data to quantify potential bias in a specific study system.
- Define a Known Truth: Develop a realistic, spatially explicit disease transmission simulation that incorporates known population structure and heterogeneous contact patterns (e.g., a livestock movement network or human meta-population model) [61].
- Incorporate Evolution: Integrate a genetic sequence evolution model (e.g, a substitution model like HKY or GTR) to simulate pathogen genetic data alongside epidemic spread [61].
- Apply Non-Random Sampling: Design and implement biased sampling schemes that mimic real-world surveillance limitations, such as oversampling from specific geographic demes or time periods [60] [61].
- Perform Phylodynamic Inference: Reconstruct the population dynamics (e.g., using BEAST2 with a Birth-Death Skyline or Coalescent Skyline model) from the biased simulated genetic data [61].
- Quantify Bias: Compare the phylodynamically inferred parameters (e.g., 𝑅0, TMRCA, 𝑁𝑒 trajectory) against the known values from the simulation. This quantifies the direction and magnitude of bias introduced by the sampling scheme [61].
Protocol 2: A Model-Based Correction Framework
This protocol outlines steps to formally account for bias within the statistical model.
- Formulate a Sampling Model: Develop a mathematical model that explicitly describes the probability of a case being sampled. This model should incorporate known biases, such as:
- Spatial: Varying sampling probabilities per geographic region.
- Temporal: A time-varying sampling rate function.
- Preferential: A sampling probability dependent on traits like hospital admission [60].
- Integrate into Phylodynamic Inference: Incorporate the sampling model as an informed prior within a Bayesian phylodynamic framework (e.g., in BEAST2 or PhyDyn) [60]. This tells the inference engine what the sampling process looked like, allowing it to separate sampling effects from true epidemiological signals.
- Infer with the Structured Model: Perform the phylodynamic analysis using the combined transmission and sampling model. For instance, use a structured coalescent model like
PhyDynto account for host population structure and heterogeneities [61]. - Validate with Subsampling: If computational constraints require analyzing a subset of data, employ a strategic subsampling strategy. Compare results from subsets stratified by time and location to results from the full dataset to check for robustness and consistency of 𝑅0 estimates [61].
The workflow for implementing these corrective protocols is summarized below.
The Scientist's Toolkit
Table 3: Essential Research Reagents and Computational Tools
| Tool/Reagent | Category | Function in Bias-Aware Phylodynamics |
|---|---|---|
| BEAST2 / BEAST1 | Software Package | A core Bayesian evolutionary analysis platform for phylodynamic inference; allows integration of complex demographic and clock models [60] [61]. |
| PhyDyn Package (BEAST2) | Software Plugin | Implements structured coalescent models to account for population structure and host heterogeneity (e.g., super-spreaders) during inference [61]. |
| Negative Binomial Offspring Distribution | Statistical Model | Models the number of secondary cases, allowing for individual variation in infectiousness (superspreading) via dispersion parameter ( k ) [63]. |
| Ensemble Adjustment Kalman Filter (EAKF) | Data Assimilation Algorithm | A statistical filter used in model-inference frameworks to iteratively assimilate surveillance data and adjust model parameters, improving real-time 𝑅0 estimation [64]. |
| MenACWY Vaccine | Biological Reagent | An example of a control measure whose introduction can alter epidemic periodicity, requiring updated sampling frameworks and models for accurate 𝑅0 estimation post-intervention [64]. |
| Morlet Wavelet Function | Analytical Tool | Used in spectral analysis (wavelet time series analysis) to identify and characterize shifts in disease seasonality, informing temporal sampling designs [64]. |
Concluding Remarks
Confronting spatial and temporal sampling bias is not merely a statistical exercise but a necessary step for generating reliable phylodynamic estimates of 𝑅0. The protocols and tools outlined herein provide a pathway for researchers to move from simply identifying bias to actively correcting for it within their inference models. As the field progresses, the development and adoption of more complex models that explicitly incorporate the sampling process, along with the strategic use of simulation-based validation, will be critical for ensuring that phylodynamics continues to provide robust insights to guide public health action.
Robust estimation of the basic reproduction number (R₀) is a critical objective in infectious disease epidemiology, directly informing the scale and targets of public health interventions. Phylodynamic inference has emerged as a powerful approach for estimating R₀ from pathogen genetic sequence data, providing insights into transmission dynamics that complement traditional surveillance. However, the accuracy of these estimates is fundamentally threatened by model misspecification and inductive bias, which occur when simplified mathematical representations fail to capture the complexity of real-world epidemiological processes.
These issues are particularly problematic in phylodynamics because complex, multi-dimensional epidemiological processes are often approximated by simpler models to make inference computationally feasible. When the assumed model differs significantly from the true data-generating process, parameter estimates—including R₀—can become substantially biased, potentially leading to misguided public health decisions. This article examines the sources and consequences of model misspecification in phylodynamic R₀ estimation and provides experimental protocols for validating model robustness in research settings.
The Misspecification Challenge in Phylodynamics
Model misspecification in phylodynamics arises when key assumptions in the inference model do not align with the true biological or epidemiological reality. Common forms of misspecification include:
- Oversimplified population structure: Assuming homogeneous mixing when transmission is actually structured by geography, risk behavior, or age
- Incorrect generation intervals: Assuming exponentially distributed generation intervals when they actually follow different distributions
- Ignoring asymptomatic transmission: Using models that only account for symptomatic infection
- Oversimplified sampling processes: Assuming random sampling when surveillance is actually biased toward certain subgroups
A recent study demonstrated that assuming an exponentially distributed generation interval when the true distribution has lower variance leads to biased-low R estimates with inappropriately narrow confidence intervals [65]. Similarly, research on HIV transmission dynamics has shown that using simplistic epidemiological models for inference while data is generated from complex, structured epidemics can introduce inductive bias, though some parameters like migration rates may remain estimable with sufficient sample sizes [66] [67].
Table 1: Common Forms of Model Misspecification in Phylodynamic R₀ Estimation
| Misspecification Type | Common Assumption | Epidemiological Reality | Impact on R₀ Estimates |
|---|---|---|---|
| Population Structure | Homogeneous mixing | Structured mixing (e.g., by age, geography, risk) | Variable bias depending on structure |
| Generation Interval | Exponential distribution | Gamma or other distributions with lower variance | Underestimation [65] |
| Infection Stages | Single infectious compartment | Multiple stages (exposed, asymptomatic, symptomatic) | Variable direction of bias [68] |
| Sampling Process | Uniform sampling | Biased surveillance (e.g., clinical cases only) | Overestimation or underestimation |
Quantitative Evidence of Misspecification Effects
Case Study: Comparative Performance of R₀ Estimators
A comprehensive simulation study compared six R₀ estimation methods under both well-specified and misspecified conditions [68] [69]. When data was generated from three different epidemiological models (SIR, SEIR, and SEAIR), all estimators showed sensitivity to model structure, with no single method performing optimally across all scenarios. The SEAIR model, which includes both asymptomatic and symptomatic infectious compartments, proved particularly challenging for estimators based on simpler model structures.
Table 2: R₀ Estimation Performance Across Model Structures [68] [69]
| Data Generation Model | True R₀ | Estimation Framework | Mean Estimated R₀ | Bias |
|---|---|---|---|---|
| SIR | 1.67 | SIR-based estimators | 1.63 | -0.04 |
| SIR | 1.67 | SEIR-based estimators | 1.59 | -0.08 |
| SEIR | 1.67 | SIR-based estimators | 1.52 | -0.15 |
| SEAIR | 2.22 | SIR-based estimators | 1.91 | -0.31 |
| SEAIR | 2.22 | SEIR-based estimators | 2.05 | -0.17 |
Impact on Bacterial Pathogen R₀ Estimation
The challenges of model misspecification extend beyond viral pathogens. Research on Escherichia coli ST131 clades demonstrated markedly different R₀ estimates across closely related bacterial clones when using appropriate structured models [21]. The ST131-A clade showed significantly higher transmission potential (R₀ = 1.47) compared to ST131-C1 (R₀ = 1.18) and ST131-C2 (R₀ = 1.13), highlighting the importance of model specification even for opportunistic bacterial pathogens.
For emerging viral pathogens, a meta-analysis of Ebola virus disease R₀ estimates found substantial variation across studies (pooled mean R₀ = 1.95, 95% CI: 1.74-2.15), with country-specific estimates ranging from 1.44 in Guinea to 9.38 in Nigeria [20]. This heterogeneity reflects both true epidemiological differences and potential methodological variations, including model specification choices.
Experimental Protocol for Misspecification Testing
Simulation-Based Model Validation Framework
This protocol provides a systematic approach for evaluating the robustness of phylodynamic inference methods to model misspecification, with specific application to R₀ estimation.
Figure 1: Workflow for simulation-based validation of phylodynamic methods against model misspecification.
Complex Model Simulation
Define a complex, structured epidemiological model that reflects known biological reality:
- For HIV, implement a model with 120 compartments structured by infection stage, age, diagnosis status, and risk group [66]
- For respiratory pathogens, implement a SEAIR model with exposed, asymptomatic, and symptomatic compartments [68]
- Parameterize the model using literature values (e.g., from Table 1)
Simulate epidemic trajectories using stochastic implementations:
- Use agent-based modeling frameworks implemented in C++ or specialized packages [68]
- Run 1000 simulations for each parameter combination to account for stochastic variation
- Record both incidence trajectories and complete transmission trees
Simulate sequence evolution and sampling:
- Generate phylogenetic trees under the structured coalescent using the epidemic trajectory
- Simulate genetic sequence evolution along these trees using appropriate substitution models
- Apply realistic sampling schemes (e.g., preferential sampling of symptomatic cases)
Inference Under Misspecified Models
Apply simplified phylodynamic models to the simulated data:
Estimate key parameters under each model specification:
- Focus on R₀ as the primary parameter of interest
- Estimate additional parameters (e.g., migration rates, sampling proportions) as relevant
- Use multiple inference methods (Bayesian, maximum likelihood, approximate methods)
Quantify bias and uncertainty calibration:
- Calculate absolute bias: |R₀estimated - R₀true|
- Compute coverage probabilities of 95% credible/confidence intervals
- Assess root mean square error (RMSE) across simulations
Computational Tools for Robust Phylodynamics
Software Solutions for Complex Model Inference
Recent computational advances have improved the feasibility of fitting complex models to large datasets. The BEAST 2 package bdmm (multi-type birth-death model) has undergone significant algorithmic improvements that now allow analysis of datasets with hundreds of genetic sequences, while maintaining numerical stability and computational efficiency [70]. This enables more realistic model specifications with reduced need for simplification.
The phydynR package provides tools for phylodynamic inference using structured population models, allowing incorporation of complex ordinary differential equation (ODE)-based dynamics into coalescent frameworks [66]. This approach accommodates nonlinear dynamics and time-varying population sizes and migration rates, reducing one major source of misspecification.
Table 3: Research Reagent Solutions for Robust Phylodynamic Inference
| Tool/Resource | Type | Function | Application Context |
|---|---|---|---|
| BEAST2/bdmm | Software package | Multi-type birth-death inference | Structured population analysis [70] |
| phydynR | R package | Structured coalescent modeling | Complex population dynamics [66] |
| Agent-based simulators | Custom code | Complex data generation | Method validation [68] |
| ABC frameworks | Statistical method | Simulation-based inference | Intractable likelihood models [21] |
Experimental Protocol for Computational Validation
Assessing Model Performance with Complex Data
This protocol evaluates the performance of phylodynamic methods when applied to data simulated from complex, structured epidemiological models.
Figure 2: Computational validation framework for phylodynamic method performance assessment.
Generate complex validation datasets:
- Simulate epidemics using structured models with known parameter values
- For HIV, use models with stratification by risk group, infection stage, and diagnosis status [66]
- Generate phylogenetic trees and sequence data using the multi-type birth-death process
- Create datasets of varying sizes (n=100, 500, 1000 sequences) to assess sample size effects
Perform phylodynamic inference:
- Apply both simplified and structured models to each dataset
- Use Bayesian inference with appropriate priors and MCMC sampling
- Run analyses in triplicate to assess convergence and stability
Quantify performance metrics:
- Compute absolute and relative bias for R₀ and other key parameters
- Assess credible interval coverage (should contain true value ~95% of time)
- Calculate highest posterior density (HPD) widths to precision assessment
Mitigation Strategies for Inductive Bias
Protocol for Model Selection and Averaging
Rather than relying on a single model specification, researchers can employ formal model selection or averaging approaches to account for uncertainty in the true data-generating process.
Implement multiple candidate models representing different structural assumptions:
- SIR, SEIR, and SEAIR models for acute infections [68]
- Models with and without explicit population structure
- Models with different generation interval distributions
Compute model weights using appropriate criteria:
- Use Bayes factors for nested models
- Apply AIC/BIC for likelihood-based methods
- Use pseudo-marginal likelihoods for complex Bayesian models
Generate model-averaged estimates:
- Compute weighted averages of R₀ estimates across models
- Propagate uncertainty through model weights
- Validate using simulation studies with known true models
Data Quality Enhancement Protocols
Model misspecification effects can be mitigated by improving data quality and resolution:
Optimize sampling protocols:
- Ensure representative sampling across population subgroups
- Collect detailed metadata (symptom onset, exposure history, demographics)
- Sequence with sufficient temporal resolution relative to substitution rate [71]
Address date rounding issues:
- Maintain exact sampling dates where possible to avoid inference bias [71]
- When date rounding is necessary for privacy, use random uniform translation within the uncertainty window rather than midpoint assignment
- Assess potential bias using sensitivity analyses when rounded dates must be used
Model misspecification and inductive bias present significant challenges for robust phylodynamic inference of R₀, particularly as methods are applied to increasingly complex epidemiological scenarios. Through systematic simulation studies and computational validation, researchers can quantify and mitigate these biases, leading to more reliable public health inferences. The protocols outlined here provide a framework for assessing model robustness, while recent computational advances make fitting appropriately complex models increasingly feasible. As phylodynamics continues to inform infectious disease policy, explicit attention to model specification will remain essential for generating accurate, actionable estimates of transmission dynamics.
Phylodynamic inference has become a cornerstone technique for estimating the reproduction number (R0) of pathogens, crucial for characterizing outbreak dynamics and informing public health interventions. Traditional phylodynamic models often rely on phylogenetic trees reconstructed from whole-genome sequences under the assumption of primarily clonal descent. However, empirical evidence now overwhelmingly demonstrates that recombination is a pervasive force in viral and bacterial genome evolution. When unaccounted for, recombination can systematically bias phylogenetic tree topology and branch lengths, leading to inaccurate estimates of R0 and misleading inferences about population dynamics [72] [73]. This protocol provides methodologies to identify recombination and model its effects, thereby refining the accuracy of phylodynamic estimates in the context of R0 research.
Quantitative Impacts of Recombination on Phylogenetic Inference
The following table summarizes the key quantitative effects of recombination on phylogenetic tree statistics, as established by simulation studies and genomic analyses. These biases directly impact the parameters used in phylodynamic models.
Table 1: Documented Effects of Recombination on Phylogenetic Tree Statistics
| Phylogenetic Metric | Effect of Recombination | Impact on Phylodynamic Inference | Supporting Evidence |
|---|---|---|---|
| Terminal Branch Lengths | Increases length [72] | Can mimic signals of rapid expansion, potentially inflating R0 estimates. | Simulation studies [72] |
| Time to Most Recent Common Ancestor (TMRCA) | Decreases inferred value [72] | May suggest a more recent origin for an outbreak than is true, compressing the inferred timescale. | Simulation studies [72] |
| Total Tree Length | Increases total length [72] | Affects the overall measure of genetic diversity, a key input for population size estimation. | Simulation studies [72] |
| Substitution Rate Heterogeneity | Overestimation of heterogeneity; loss of molecular clock [72] | Violates the assumption of a constant molecular clock, leading to erroneous evolutionary rate estimates and distorted timescales. | Simulation studies [72] |
| Core Genome Tree Topology | Can be inaccurate even with high bootstrap support [74] | An incorrect underlying tree topology will propagate errors into any subsequent R0 estimation. | Empirical and simulation studies on prokaryotes [74] |
| Phylogenetic Signal | Phylogeny can change thousands of times along the genome [73] | A single tree is a poor representation of evolutionary history, making a single R0 estimate an oversimplification. | Empirical analysis of E. coli and other bacterial species [73] |
Experimental Protocols for Detecting and Accounting for Recombination
Protocol: Assessing the Robustness of Core Genome Phylogenies
This protocol uses simulations to evaluate whether recombination levels in a dataset are likely to have biased a core genome phylogeny, a common starting point for phylodynamic analyses [74].
1. Research Reagent Solutions
| Item | Function in Protocol |
|---|---|
| Core Genome Alignment (FASTA) | The input sequence data from which the initial phylogeny is built. |
| Reference Phylogeny | A maximum likelihood tree inferred from the core genome alignment using standard software (e.g., IQ-TREE, RAxML). |
| CoreSimul Software | A tool to simulate the evolution of a core genome along a given phylogeny with customizable recombination rates [74]. |
| Phylogenetic Inference Software (e.g., IQ-TREE) | Used to reconstruct trees from the simulated alignments. |
| Tree Comparison Tool (e.g., Robison-Foulds distance) | Quantifies topological differences between the reference tree and trees from simulated data. |
2. Workflow Diagram
3. Step-by-Step Procedure
- Step 1: Initial Phylogeny Construction. Generate a reference maximum likelihood phylogeny from your core genome alignment using your preferred software. This tree represents the "signal" without simulated recombination.
- Step 2: Parameter Estimation. Use the empirical core genome alignment and the reference tree to estimate simulation parameters for CoreSimul, including GC-content, transition/transversion ratio, and branch-specific substitution rates [74].
- Step 3: Simulation with Recombination. Run CoreSimul using the reference tree and a range of recombination rates (e.g., ρ/m from 0 to 10). Each simulation will generate a new core genome alignment that has evolved with the specified level of recombination [74].
- Step 4: Tree Reconstruction. For each simulated alignment generated in Step 3, reconstruct a new phylogenetic tree using the same method and parameters as in Step 1.
- Step 5: Topology Comparison. Calculate the Robinson-Foulds distance between the reference tree and each tree inferred from the recombined simulations. A significant increase in distance with increasing ρ/m indicates that the core phylogeny is not robust to the empirically present recombination.
Protocol: Bayesian Phylodynamic Inference with the Strong Seedbank Coalescent
For organisms exhibiting dormancy (e.g., Mycobacterium tuberculosis), which alters genealogical and evolutionary dynamics, this protocol outlines inference using a specialized coalescent model [33].
1. Research Reagent Solutions
| Item | Function in Protocol |
|---|---|
| Molecular Sequence Data | Multi-sequence alignment (e.g., of M. tuberculosis strains). |
| BEAST 2 Software Platform | A versatile software package for Bayesian evolutionary analysis. |
| SeedbankTree Package | A BEAST 2 package that implements the strong seedbank coalescent prior [33]. |
| Model Selection Tool (e.g., path sampling) | Used to compare the fit of the seedbank coalescent to standard models like the Kingman coalescent. |
2. Workflow Diagram
3. Step-by-Step Procedure
- Step 1: Model Setup. In BEAST 2, load your sequence alignment. Specify a suitable site model (e.g., GTR+Γ) and a clock model (e.g., relaxed clock). Crucially, select the "Strong Seedbank Coalescent" from the SeedbankTree package as the tree prior [33].
- Step 2: Parameter Priors. Define priors for the seedbank-specific parameters: the dormant lineage activation rate (
c) and the relative seedbank size (K). Use log-normal or gamma distributions for these continuous parameters if empirical estimates are unavailable. - Step 3: MCMC Execution. Configure the Markov Chain Monte Carlo (MCMC) settings (chain length, logging frequency) and run the analysis. The MCMC sampler will jointly infer the latent genealogy, seedbank parameters, and evolutionary parameters directly from the sequence data [33].
- Step 4: Diagnostic Checks. Analyze the log file in Tracer to ensure all parameters have reached convergence and have sufficient effective sample sizes (ESS > 200).
- Step 5: Phylodynamic Inference. Use the posterior distribution of trees and population parameters to estimate R0. The seedbank model provides a more accurate estimate of population size and growth rates by accounting for the delayed coalescence caused by dormancy, which directly feeds into R0 calculation.
The Scientist's Toolkit: Key Analytical Reagents
Table 2: Essential Computational Tools for Accounting for Recombination and Selection
| Tool Category | Specific Tool / reagent | Function | Application Note |
|---|---|---|---|
| Recombination Detection | RDP5 | Detects and characterizes recombination events in sequence alignments. | Use to scan datasets prior to analysis to quantify the level of recombination. |
| Phylogenetic Simulation | CoreSimul | Simulates genome evolution with customizable recombination rates on a given tree [74]. | Essential for Protocol 3.1 to test the robustness of core phylogenies. |
| Coalescent Modeling | SeedbankTree (BEAST 2) | Provides a Bayesian framework for inference under the strong seedbank coalescent [33]. | Critical for Protocol 3.2 when analyzing pathogens with dormant states (e.g., M. tuberculosis). |
| Tree Comparison | TreeDist (R) | Calculates Robinson-Foulds and other phylogenetic tree distances. | Used to quantify topological differences in simulation-based robustness tests. |
| Population Genetics Analysis | LDhat | Estimates population recombination rate ρ from sequence data. | Provides an independent empirical estimate of the recombination rate parameter. |
Within phylodynamic inference of the reproduction number (R₀), a fundamental challenge is disentangling the specific contributions of genetic sequence data and sampling date data to the estimated epidemiological parameters. The core premise of phylodynamic methods is that the evolutionary history reconstructed from genetic sequences, when calibrated with sampling times, contains a temporal signal that informs estimates of population dynamics, including R₀ [23]. The concept of a "measurably evolving population" is central, where genetic sequences accumulate enough measurable mutations over the sampling period to provide this signal [75]. However, current dogma suggests that populations meeting this criterion are suitable for molecular clock calibration via sampling times, though the precise definitions and implications remain unclear [75]. This protocol provides a detailed framework for quantifying the individual and combined contributions of these two data components, thereby assessing the robustness of R₀ estimates and informing optimal sampling strategy design.
Quantitative Data Comparison
The table below summarizes the core metrics and parameters involved in designing and analyzing experiments to isolate the data signal.
Table 1: Key Quantitative Metrics for Signal Isolation Analysis
| Metric / Parameter | Description | Role in Isolating Sequence vs. Sampling Signal |
|---|---|---|
| Temporal Signal Strength | The degree to which genetic data correlates with sampling time, often measured by root-to-tip regression or date-randomization tests. | A weak signal suggests sampling dates contribute little information, forcing the model to rely heavily on prior assumptions. |
| Effective Sample Size (ESS) | A measure of the efficiency of MCMC sampling for a given parameter; low ESS indicates poor convergence. | Low ESS for R₀ in date-randomized analyses can indicate an over-reliance on the (now incorrect) sampling date signal. |
| Coefficient of Variation (CoV) | The ratio of the standard deviation to the mean for posterior parameter estimates. | A higher CoV in analyses with masked sequence data highlights the sequence data's role in providing a precise estimate. |
| Bayes Factor | A metric for comparing the evidence for two competing models. | Used to compare the model fit of analyses using the true sampling dates versus models with randomized or perturbed dates. |
| Prior-Posterior Contrast | The difference between the distribution of a parameter before (prior) and after (posterior) analyzing the data. | A large shift indicates the data (sequence and/or sampling dates) is highly informative; a small shift suggests the prior is dominating. |
| Sampling Window Width | The total time period over which genetic sequences were collected. | A wider window generally strengthens the temporal signal from sampling dates, reducing prior dominance on R₀ estimates [75]. |
Application Notes & Experimental Protocols
Protocol: Assessing Temporal Signal and Prior Sensitivity
This protocol is designed to evaluate the relative contribution of sampling date data to the phylodynamic inference of R₀.
1. Primary Phylodynamic Analysis
- Inputs: Aligned genetic sequence data and associated sampling dates.
- Software: BEAST2 with an appropriate birth-death model (e.g.,
bdmmfor structured populations) and a molecular clock model [23]. - Method:
- Configure the model with informed, yet conservative, priors for R₀ and the molecular clock rate.
- Run an MCMC simulation for a sufficient number of steps (e.g., 100 million) to ensure convergence (ESS > 200 for all key parameters).
- Log the posterior estimate for R₀, its 95% Highest Posterior Density (HPD) interval, and the strength of the temporal signal.
2. Date Randomization Test
- Objective: To isolate the impact of sampling date data by breaking the legitimate link between sequences and their collection times.
- Method:
- Randomly shuffle the sampling dates among the sequences, preserving the overall distribution of dates but destroying any true temporal signal.
- Re-run the phylodynamic analysis from Step 1 using this randomized dataset.
- Repeat this process a minimum of 10 times.
- Interpretation: If the posterior R₀ estimates from the randomized analyses are significantly different from and typically less precise than the primary analysis, it confirms a strong reliance on the correct sampling date signal. If estimates are similar, the model is likely dominated by the priors, indicating a weak temporal signal [75].
3. Prior Sensitivity Analysis
- Objective: To determine if the data (both sequence and dates) is sufficiently informative or if the prior is overly influential.
- Method:
- Re-run the primary analysis (Step 1) using an alternative, broader prior for R₀ (e.g., a uniform distribution over a much larger range).
- Compare the posterior estimates of R₀ from the primary and alternative-prior analyses.
- Interpretation: A significant change in the posterior indicates high prior sensitivity, suggesting the data itself (sequence and sampling dates combined) is not strongly informative for R₀, a situation common with narrow sampling windows [75].
Protocol: Isolating the Impact of Sequence Data
This protocol assesses the contribution of the genetic sequence data itself, independent of the temporal signal.
1. Sequence Data Masking Experiment
- Objective: To quantify the information content of the sequence data for R₀ estimation.
- Method:
- Perform a phylodynamic analysis using only the sampling dates and a tree topology fixed to a star phylogeny (which contains no internal node structure or branch length information).
- Alternatively, analyze a dataset where the sequence characters are heavily degraded or randomized, while preserving the number of sequences and their sampling dates.
- Interpretation: The resulting wide HPD intervals for R₀ will demonstrate the loss of precision when sequence data is uninformative, highlighting its critical role in defining the phylogenetic tree's structure and branch lengths, which are essential for estimating population growth rates and R₀.
2. Subsampling Analysis by Genetic Diversity
- Objective: To test how the amount of genetic diversity in the sequences affects R₀ estimation.
- Method:
- Create multiple subsets of the full dataset by selecting sequences that represent different levels of genetic diversity (e.g., high-diversity clades vs. low-diversity clades).
- Perform the primary phylodynamic analysis on each subset.
- Interpretation: Compare the R₀ estimates across subsets. Greater consistency and precision in high-diversity subsets would underscore the role of sequence variation in providing a robust signal for R₀.
Mandatory Visualizations
Workflow for Isolating Data Signals
Impact of Sampling Window on Signal
The Scientist's Toolkit
Table 2: Essential Research Reagent Solutions for Phylodynamic Signal Isolation
| Item | Function / Application in Protocol |
|---|---|
| BEAST2 Software Package | A core software platform for Bayesian evolutionary and phylodynamic analysis. It is used to perform all MCMC-based inferences of R₀, tree topology, and other parameters [23]. |
| bdmm Package | A BEAST2 package implementing the multi-type birth-death model. It is essential for analyzing structured populations (e.g., by geography), allowing for more realistic modeling of R₀ and migration rates [23]. |
| Root-to-Tip Regression Tool (e.g., TempEst) | A tool for initial, rapid assessment of temporal signal in a dataset before undertaking full Bayesian analysis. It regresses genetic divergence against sampling time. |
| Date Randomization Script | A custom script (e.g., in R or Python) to automatically randomize the sampling dates associated with sequences for the date randomization test, ensuring a statistically sound workflow. |
| Markov Chain Monte Carlo (MCMC) Algorithm | The computational algorithm at the heart of BEAST2. It samples from the posterior distribution of parameters (like R₀) and trees, given the sequence data, sampling dates, and model priors [23]. |
| Bayesian Birth-Death Model | The phylodynamic model used to infer population growth rates, reproductive numbers (R₀), and sampling probabilities directly from the serially sampled phylogenetic tree [23]. |
| Molecular Clock Model | A model that describes the rate at which genetic mutations accumulate over time. It is the crucial component that links the genetic sequence data (evolutionary change) to the sampling date data (calendar time) [75]. |
Addressing Computational Complexity and Scalability in Large Datasets
In the field of phylodynamics, the inference of the basic reproduction number (R₀) is fundamental to understanding and predicting pathogen spread. However, the increasing availability of large-scale genomic datasets presents significant challenges in computational complexity and scalability. Computational complexity measures the resources required to solve computational problems, while scalability refers to a system's capability to handle growing amounts of work or its potential to accommodate growth [76]. For researchers, scientists, and drug development professionals, efficiently managing these aspects is critical for accurate and timely R₀ estimation, which informs public health interventions and therapeutic development.
This document provides detailed application notes and protocols to address computational bottlenecks in phylodynamic analyses, with specific focus on R₀ inference from large genomic datasets. We frame these solutions within the context of a broader thesis on phylodynamic inference, emphasizing practical implementation and reproducibility.
Computational Challenges in Phylodynamic R₀ Inference
Phylodynamic inference integrates phylogenetic analysis with epidemiological models to estimate key parameters like R₀ directly from genetic sequence data [8]. The birth-death SIR model used in phylodynamics treats viral transmission as a birth event and recovery/death as a death event, allowing estimation of R₀ (the number of secondary cases caused by an infectious individual in a fully susceptible population) and the critical vaccination threshold (the proportion of the population that must have immunity to eliminate the epidemic) [8]. However, several computational challenges arise:
- Storage and Access: Large genomic datasets require substantial storage capacity, often exceeding traditional solutions [77]
- Computational Resources: Analyzing massive volumes of data necessitates powerful computational resources, frequently requiring distributed computing frameworks [77]
- Algorithmic Complexity: Bayesian phylodynamic inference using Markov Chain Monte Carlo (MCMC) sampling is computationally intensive, especially with large datasets [8] [33]
- Reproducibility: Stochastic algorithms in bioinformatics tools can produce divergent outcomes even with identical datasets and parameters [78]
Table 1: Key Computational Challenges in Phylodynamic R₀ Inference
| Challenge Type | Specific Issue | Impact on R₀ Inference |
|---|---|---|
| Data Management | Storage and access of large genomic datasets | Limits dataset size and comprehensiveness for R₀ estimation |
| Processing Power | Computational demands of evolutionary analysis | Increases time-to-results for urgent public health decisions |
| Algorithmic Complexity | MCMC convergence in Bayesian phylodynamics | Affects accuracy and reliability of R₀ estimates |
| Reproducibility | Stochastic variations in bioinformatics tools | Challenges validation of R₀ estimates across studies |
Scalability Solutions for Phylodynamic Analysis
Data Management and Processing Strategies
Effective handling of large genomic datasets is foundational to scalable phylodynamic analysis. The following strategies have proven effective:
- Data Sharding: Partition large datasets into smaller, manageable chunks called shards [77]. Range-based sharding partitions data based on a specific key (e.g., sampling date or geographic region), while hashed sharding applies a hash function to a record's key for more even distribution across shards [77]
- Batch Processing: Divide datasets into smaller batches and train models incrementally on each batch [77]. This mitigates overfitting risks and makes training more efficient
- Feature Selection and Dimensionality Reduction: Reduce dataset size and complexity while preserving essential information [77]. Techniques like Principal Component Analysis (PCA) transform data into lower-dimensional spaces, improving computational efficiency
- Data Sampling: Select representative data subsets to reduce computational requirements while maintaining statistical power for R₀ estimation [77]. For imbalanced datasets, techniques like SMOTE can generate synthetic samples
Computational Infrastructure and Distributed Processing
For phylodynamic analyses involving large datasets, specialized computational approaches are essential:
- Distributed Computing: Frameworks like Apache Hadoop and Apache Spark distribute data and computation across multiple nodes, enabling parallel processing and significantly faster analysis [77]
- Cloud Computing: Leverage on-demand, scalable computing resources to manage variable workloads effectively [77] [76]
- Model Simplification: In certain scenarios, simpler models (e.g., linear models, decision trees) may be preferable to complex models with substantial computational demands, especially for preliminary R₀ estimates [77]
Figure 1: Scalability workflow for phylodynamic R₀ inference, showing data flow from raw genomic data through processing to R₀ estimation.
Application Notes: Protocols for R₀ Inference
Protocol 1: Bayesian Phylodynamic Inference with BEAST2
This protocol details the methodology for estimating R₀ using Bayesian phylodynamic inference with the BEAST2 software platform, incorporating scalability optimizations.
Materials and Equipment
Table 2: Research Reagent Solutions for Phylodynamic R₀ Inference
| Item | Function | Example Tools/Implementations |
|---|---|---|
| Sequence Data | Raw input for phylogenetic analysis | SARS-CoV-2 sequences from GISAID |
| Alignment Tool | Multiple sequence alignment | MAFFT, Clustal Omega |
| Phylodynamic Software | Bayesian evolutionary analysis | BEAST2 with Birth-Death SIR model |
| Visualization Package | Results interpretation and visualization | Tracer, IcyTree |
| High-Performance Computing | Handling computational complexity | Cloud platforms, HPC clusters |
Step-by-Step Procedure
Data Preparation
- Obtain genomic sequences in FASTA format with accurate sampling dates
- Perform multiple sequence alignment using MAFFT or Clustal Omega
- For large datasets (>10,000 sequences), apply data sampling techniques to select representative subsets [77]
XML Configuration Generation
- Define nucleotide substitution model (e.g., GTR, HKY)
- Specify molecular clock model (strict or relaxed)
- Select Birth-Death SIR model for epidemiological inference [8]
- Set chain length appropriate for dataset size (typically 10⁷-10⁹ steps for large datasets)
Computational Execution
- Execute BEAST2 using distributed computing resources
- For extremely large datasets, utilize BEAGLE library to accelerate computation
- Implement checkpointing to allow restarting of long-running analyses
Post-processing and Analysis
- Use Tracer to assess MCMC convergence (ESS > 200)
- Annotate maximum clade credibility tree using TreeAnnotator
- Extract R₀ estimates and other epidemiological parameters from the posterior distribution
Scalability Considerations
- Implement data sharding by geographic region or time period for very large datasets [77]
- Use cloud computing resources with scalable architecture to manage computational demands [77]
- Consider model simplification for exploratory analyses [77]
Protocol 2: Reproducible Phylodynamic Analysis
Reproducibility is essential for validating R₀ estimates across studies. This protocol establishes a framework for reproducible phylodynamic analysis.
Materials and Equipment
- Version control system (Git)
- Workflow management tool (Nextflow, Snakemake)
- Containerization platform (Docker, Singularity)
Step-by-Step Procedure
Version Control Implementation
- Initialize Git repository for all analysis code and configuration files
- Create descriptive commit messages documenting each analytical step
- Use branches for testing new methods or parameters
Workflow Specification
- Define analysis workflow using Nextflow or Snakemake
- Include all steps from raw data processing to R₀ estimation
- Parameterize workflows to allow easy modification of key settings
Environment Containerization
- Create Docker container with all necessary software and dependencies
- Pin software versions to ensure consistent behavior
- Document all environment specifications
Random Seed Management
- Record random seeds for all stochastic processes [79]
- Ensure seeds are properly passed to all analytical components
Comprehensive Documentation
- Maintain detailed README with setup and execution instructions
- Document all parameter choices and their justifications
- Record computational environment specifications
Figure 2: Reproducibility framework for phylodynamic analysis, ensuring consistent R₀ estimation.
Reproducibility Verification
- Execute workflow on multiple systems to verify consistent results
- Compare R₀ estimates across runs with different random seeds
- Validate against gold standard datasets where available
Advanced Scalability Techniques
Seedbank Coalescent Modeling for Pathogen Dormancy
For pathogens with dormant states (e.g., Mycobacterium tuberculosis), standard coalescent models may not adequately capture population dynamics. The seedbank coalescent model provides a more appropriate framework for R₀ estimation in such cases [33].
- Weak Seedbank Model: Appropriate for dormancy induced by scheduled seasonality; statistically equivalent to Kingman coalescent with scaled mutation rate [33]
- Strong Seedbank Model: Applicable when individuals stochastically switch between active and dormant states; only active lineages can coalesce while dormant lineages cannot [33]
- Implementation: The SeedbankTree package within BEAST2 implements these models, enabling more accurate R₀ estimation for pathogens with dormancy characteristics [33]
Online Learning for Real-time R₀ Estimation
For surveillance applications requiring real-time R₀ estimation, online learning (incremental learning) provides a scalable approach:
- Process one data point at a time, updating model parameters immediately after processing each instance [77]
- Particularly useful when datasets are too large to fit into memory or when data arrives in continuous streams [77]
- Allows models to adapt to changing data distributions and patterns in real time [77]
Addressing computational complexity and scalability is essential for robust phylodynamic inference of R₀ from large genomic datasets. The protocols and application notes presented here provide researchers with practical methodologies to overcome these challenges while maintaining scientific rigor and reproducibility. As genomic sequencing continues to expand, these scalable approaches will become increasingly critical for accurate estimation of epidemiological parameters to inform public health decision-making and therapeutic development.
Validation and Impact: Comparing Phylodynamic R0 with Epidemiological Data and Public Health Outcomes
Accurate estimation of the reproduction number (R0) is fundamental for understanding infectious disease transmission dynamics and informing public health interventions. In recent years, phylodynamic inference has emerged as a powerful approach to estimate R0 from pathogen genomic data, operating alongside well-established traditional epidemiological methods. While traditional methods typically rely on case count data and the generation time distribution, phylodynamic methods leverage evolutionary information contained in pathogen genomes to reconstruct population size changes through time [80] [36]. This application note explores the cross-validation framework for these complementary approaches, providing researchers with protocols to assess agreement and leverage combined strengths for more robust R0 estimation. The validation of phylodynamic estimates against traditional methods is particularly crucial as genomic data becomes increasingly integral to public health decision-making [81].
Background and Significance
The basic reproduction number (R0) represents the average number of secondary infections generated by a single infectious individual in a fully susceptible population [6]. It serves as a fundamental threshold parameter—values greater than 1 indicate potential epidemic spread, while values below 1 suggest outbreak decline. The effective reproduction number (Rt) measures real-time transmission under current conditions, incorporating population immunity and intervention effects [82] [6].
Phylodynamic methods exploit the relationship between effective population size and epidemiological dynamics through coalescent theory, where coalescent events occur more frequently when the effective population size is small [80]. These methods can estimate epidemiological parameters directly from genetic data by modeling transmission as a birth-death-sampling process [81]. In contrast, traditional methods employ statistical approaches applied to case incidence data, often incorporating the generation time distribution to relate observed growth rates to reproduction numbers [82] [83]. The convergence of these distinct methodologies offers unprecedented opportunities for validation and improved accuracy in reproduction number estimation.
Comparative Methodological Frameworks
Phylodynamic Estimation Methods
Phylodynamic inference utilizes several model frameworks to reconstruct demographic history from genetic data:
- Non-parametric demographic models: These include the skygrid model (piecewise constant effective population size), skygrowth model (growth rate-based), and skysigma model (second-order differences), all employing Gaussian Markov chains with precision parameter τ to control smoothness [80].
- Birth-death-sampling models: These forward-time models estimate the effective reproductive number (Re) directly using transmission rate (λ), recovery rate (μ), and sampling rate (ψ) parameters, where Re = λ/(μ + ψ) [81].
- Coalescent-based likelihood: The probability of the genealogy given the demographic function is computed, incorporating the number of extant lineages through time and their coalescence rates [80].
A critical consideration in phylodynamic inference is model identifiability, as not all parameters can be simultaneously estimated from genetic data alone. Sensitivity analyses and simulation studies are essential for validation [81].
Traditional Estimation Methods
Traditional R0 estimation employs several established approaches:
- Exponential growth rate method: Derives R0 from the initial growth rate of cases using the Euler-Lotka equation, requiring assumptions about the generation time distribution [82] [83].
- Time-dependent reproduction numbers: Computes instantaneous reproduction numbers by averaging transmission networks, often using Wallinga-Teunis or Cori et al. methods [83].
- Gamma-distributed generation time: Incorporates the full generation time distribution rather than just the mean, demonstrating greater robustness across scenarios [82].
- Attack rate and final size methods: Utilizes the proportion of infected individuals to estimate transmission potential [83].
Table 1: Comparison of Traditional R0 Estimation Methods
| Method | Key Inputs | Key Assumptions | Advantages | Limitations |
|---|---|---|---|---|
| Exponential Growth | Case growth rate, mean generation time | Stable generation time, exponential growth phase | Simple calculation | Sensitive to generation time variance [82] |
| Time-Dependent (TD) | Line list data, serial interval | Complete case ascertainment | Captures temporal changes | Computationally intensive [83] |
| Gamma Generation Time | Case counts, full generation time distribution | Known generation time distribution | More robust to distribution shape | Requires detailed distribution parameters [82] |
| Attack Rate (AR) | Final epidemic size, initial susceptible proportion | Homogeneous mixing, closed population | Simple for complete outbreaks | Only for completed outbreaks [83] |
Performance Comparison of Traditional Methods
Comparative studies provide insights into the relative performance of traditional R0 estimation methods:
Table 2: Performance Comparison of R0 Estimation Methods for Influenza (Canada, 2009)
| Method | R0 Estimate (95% CI) | Mean Squared Error (MSE) | Vaccination Coverage Required |
|---|---|---|---|
| Time-Dependent | 1.71 (1.12, 2.03) | Minimum | ~41.5% |
| Exponential Growth | 1.46 (1.41, 1.52) | Intermediate | ~31.5% |
| Gamma Generation Time | 1.49 (1.00, 1.97) | Intermediate | ~32.9% |
| Maximum Likelihood | 1.42 (1.27, 1.57) | Low | ~29.6% |
| Attack Rate | 1.116 (1.1163, 1.1165) | High | ~10.4% |
| Final Size | 1.00 (0.91, 1.09) | High | ~0% |
The time-dependent method demonstrated superior performance with minimum MSE, making it particularly valuable for public health applications requiring accurate vaccination coverage estimates [83].
Cross-Validation Protocols
Framework for Method Comparison
Cross-validation between phylodynamic and traditional R0 estimates requires systematic protocols to account for different data sources and modeling assumptions. The following workflow outlines a comprehensive approach:
Protocol 1: Precision Parameter Selection in Phylodynamics
Purpose: Optimize the precision parameter τ in non-parametric phylodynamic models to balance fit and smoothness.
Procedure:
- Implement k-fold cross-validation: Partition genealogical data into k subsets [80]
- Iterative optimization: For each candidate τ value:
- Fit demographic model to k-1 training subsets
- Compute out-of-sample prediction error on withheld subset
- Calculate coalescent likelihood using: [ L(\mathcal{G}|Ne(t)) = \exp\left(-\int{-\infty}^{\infty} \mathbf{1}{[A(t)\geq 2]} \frac{A(t)(A(t)-1)}{2Ne(t)} dt\right) \prod{i=1}^{n-1} \frac{1}{Ne(c_i)} ] where A(t) represents extant lineages at time t [80]
- Parameter selection: Choose τ that minimizes aggregate prediction error across all folds
- Validation: Compare resulting R0 estimates with traditional methods (Table 2)
Protocol 2: Temporal Trend Alignment Analysis
Purpose: Assess concordance between phylodynamic and traditional reproduction number estimates over time.
Procedure:
- Calculate time-series estimates:
- Synchronize time scales: Align phylogenetic and epidemiological time axes
- Statistical correlation analysis:
- Compute cross-correlation at various lags
- Calculate concordance correlation coefficient (CCC)
- Perform linear regression with coefficient of determination (R²)
- Interpretation criteria:
- Strong agreement: CCC > 0.8, R² > 0.75
- Moderate agreement: CCC 0.5-0.8, R² 0.5-0.75
- Weak agreement: CCC < 0.5, R² < 0.5
Protocol 3: Uncertainty Quantification and Comparison
Purpose: Evaluate consistency between uncertainty intervals of phylodynamic and traditional R0 estimates.
Procedure:
- Extract uncertainty measures:
- Calculate overlap metrics:
- Interval overlap proportion
- Hausdorff distance between intervals
- Probability of agreement using Bayesian model comparison
- Assess bias and precision:
- Mean difference between point estimates
- Ratio of interval widths
- Coverage probabilities
Case Study Applications
COVID-19 Intervention Impact Assessment
During the early COVID-19 pandemic, phylodynamic methods successfully estimated the impact of non-pharmaceutical interventions (NPIs) in England. By incorporating intervention timing within skysigma models with covariate effects, researchers quantified how the first national lockdown reduced the effective reproduction number [80]. Parallel analysis using traditional time-dependent methods applied to case count data provided validation, with both approaches showing consistent patterns of Re decline following intervention implementation.
A study in Australia used birth-death skyline models to demonstrate a reduction in Rt from 1.63 to 0.48 following travel restrictions and social distancing implementation on March 27, 2020 [36]. This closely matched estimates derived from case-based methods, strengthening confidence in the intervention effect size.
Superspreading Event Identification
Phylodynamic approaches can identify superspreading events that may distort traditional R0 estimates. Case Study 1 from German SARS-CoV-2 research demonstrated how birth-death models applied to genomic data alone could identify the signature of a superspreading event at the origin of an outbreak—information that would otherwise require extensive contact tracing [81]. The identification of such events is crucial for cross-validation, as traditional methods may produce elevated R0 estimates during superspreading episodes that don't reflect general transmission dynamics.
The Scientist's Toolkit
Table 3: Essential Research Reagent Solutions for R0 Estimation Studies
| Tool/Category | Specific Examples | Function/Application | Key Considerations |
|---|---|---|---|
| Phylodynamic Software | BEAST2 [81], treedater [80] | Bayesian evolutionary analysis, demographic inference | Model specification, computational demands, prior sensitivity |
| Traditional R0 Packages | R0 package in R [83], EpiEstim | Statistical estimation from case data | Generation time specification, window size selection |
| Sequence Alignment | MAFFT, MUSCLE [84] | Multiple sequence alignment for phylogenetic analysis | Alignment method choice impacts downstream analyses |
| Model Selection Tools | path sampling, stepping-stone sampling [81] | Bayesian model comparison, marginal likelihood estimation | Computational intensity, convergence assessment |
| Generation Time Distributions | Gamma, normal, exponential [82] | Represent serial interval for traditional methods | Distribution choice affects R0 estimates significantly |
| Visualization Platforms | Microreact, Nextstrain | Integrative visualization of genetic and epidemiological data | Data integration, sharing, and communication |
Discussion and Future Directions
Cross-validation between phylodynamic and traditional R0 estimation methods represents a critical step toward robust epidemiological inference. The protocols outlined here provide a framework for assessing method agreement, with each approach offering complementary strengths: traditional methods benefit from established statistical foundations and direct ties to epidemiological theory [82] [83], while phylodynamic methods leverage independent genetic data, potentially capturing transmission dynamics unrecognized by surveillance systems [80] [81].
Future methodological development should focus on integrated models that jointly analyze genetic and epidemiological data within a unified framework, formally accounting for uncertainties in both data sources. Additionally, standardized benchmarking datasets with known transmission parameters would accelerate method validation and comparison. As genomic surveillance expands, cross-validation protocols will become increasingly essential for translating sequence data into reliable public health guidance.
Successful application of these protocols requires careful attention to model assumptions and data quality in both approaches. Phylodynamic inference depends on adequate temporal sampling and clock-like evolution [84], while traditional methods require accurate case ascertainment and generation time estimation [82]. Discrepancies between methods should prompt investigation of potential violations of these assumptions rather than immediate rejection of either approach. Through rigorous application of cross-validation frameworks, researchers can leverage the complementary strengths of both methodologies for more accurate reproduction number estimation and improved infectious disease control.
The Role of Phylodynamics in Validating Public Health Interventions
Phylodynamics, the study of the interplay between pathogen evolutionary dynamics and host population ecology, has emerged as a critical tool for validating public health interventions. By leveraging pathogen genetic sequence data, this approach provides a powerful framework for inferring key epidemiological parameters, most notably the reproduction number (R₀), and for quantitatively assessing the effectiveness of interventions such as travel restrictions, social distancing, and vaccination campaigns. This application note details how phylodynamic methods, grounded in molecular evolution models and statistical inference frameworks, enable researchers to reconstruct transmission dynamics, evaluate intervention efficacy, and guide evidence-based public health strategies. We provide specific protocols for implementing these analyses and demonstrate their critical role in infectious disease management.
In modern infectious disease epidemiology, phylodynamics has become an indispensable discipline for understanding pathogen spread and evaluating control measures. It forges a critical link between evolutionary biology and public health practice by leveraging pathogen genomic data to infer epidemiological parameters and population dynamics [59]. The core of this approach lies in using molecular sequence data to reconstruct the population history of pathogens, enabling estimation of the effective reproduction number (R₀), which represents the average number of secondary infections generated by a single infected individual in a fully susceptible population [8].
The value of phylodynamics was profoundly demonstrated during the COVID-19 pandemic, when scientists scrambled to collect and analyze SARS-CoV-2 genomic data to inform public health responses in real-time [85]. Open-source phylogenetic platforms for monitoring genomic epidemiology gained widespread adoption for their ability to illuminate spatiotemporal transmission patterns worldwide. These analyses move beyond descriptive family trees of pathogens to provide a quantitative framework for testing specific epidemiological hypotheses, such as the impact of environmental factors on dispersal dynamics or the effectiveness of travel restrictions [86].
This application note explores the theoretical foundations of phylodynamic inference of R₀, details practical protocols for implementation, and demonstrates how these methods validate public health interventions through specific case studies. The content is structured to provide researchers, scientists, and drug development professionals with both conceptual understanding and practical methodologies for applying these powerful analytical techniques.
Theoretical Foundations of Phylodynamic R₀ Inference
Integrating Evolutionary and Epidemiological Models
Phylodynamic inference operates at the intersection of evolutionary models and epidemiological dynamics. The foundational principle is that pathogen genetic diversity contains a historical record of epidemic progression that can be decoded using statistical models [59]. Two primary classes of models form the backbone of phylodynamic R₀ estimation:
Coalescent-based models: These approaches work backward in time, modeling how genetic lineages merge (coalesce) in ancestral populations. The distribution of coalescence times in a phylogeny provides information about changes in effective population size through time, which in epidemic terms reflects changes in the number of infected individuals [87]. The coalescent model is typically defined as a deterministic population process, where the branching process is determined at any given time by a deterministic effective population size function.
Birth-death models: These forward-time models explicitly represent transmission (birth) and removal/recovery (death) events. Birth-death models naturally incorporate epidemiological parameters, with R₀ calculated as R₀ = λ/δ, where λ represents the transmission rate and δ represents the rate at which individuals become non-infectious (through recovery, death, or isolation) [87]. These models account for stochastic population size change and explicitly utilize sampling times from sequence data.
From Genetic Sequences to Reproductive Numbers
The process of inferring R₀ from genetic sequences relies on several key analytical steps. First, a molecular clock model is applied to estimate the rate of evolutionary change and to calibrate the phylogenetic tree in time [8]. Next, epidemiological models are integrated, typically within a Bayesian statistical framework, to estimate the parameters governing transmission dynamics. The resulting estimates of growth rates (r) are then converted to R₀ values using formulas that depend on the generation time distribution of the infection [59].
Different phylodynamic models exhibit varying performance characteristics, particularly under challenging conditions such as emerging epidemics with low genetic diversity. Research has demonstrated that birth-death models generally outperform coalescent models when applied to datasets with limited sequence variation, as they explicitly exploit sampling times and can better account for stochastic population dynamics in outbreak scenarios [87].
Table 1: Comparison of Phylodynamic Models for R₀ Inference
| Model Type | Theoretical Basis | Key Parameters | Advantages | Limitations |
|---|---|---|---|---|
| Coalescent Exponential | Backward-in-time coalescent process | Effective population size through time, growth rate | Computational efficiency; simpler implementation | Deterministic population trajectory; less accurate with low diversity data |
| Birth-Death | Forward-in-time transmission process | Transmission rate (λ), become non-infectious rate (δ), sampling proportion | Accounts for stochasticity; explicitly uses sampling times; better with early outbreak data | More complex parameterization; sensitive to sampling assumptions |
| Birth-Death Skyline | Extended birth-death process with time-varying parameters | Time-varying R₀, rate parameters | Captures temporal changes in transmission dynamics; more realistic for intervention assessment | Increased computational demand; requires sufficient temporal signal in data |
Phylodynamic Applications in Public Health Intervention
Validating Travel Restrictions and Mobility Controls
Phylogeographic applications of phylodynamics have provided robust methodologies for quantifying the effectiveness of travel restrictions during pandemics. By analyzing the spatial movement of viral lineages, researchers can enumerate introduction events and distinguish between imported cases and established local transmission chains [59].
During the COVID-19 pandemic, these approaches demonstrated that international travel restrictions significantly reduced cross-border transmission when implemented before extensive local establishment. For example, analyses revealed that following travel restrictions in South Africa on March 26, 2020, international introductions plummeted [59]. Similarly, phylodynamic studies showed that the focus of global dissemination shifted from China to Europe in early 2020, and that subsequent travel limitations slowed intercontinental spread [59].
These analyses also revealed limitations; in Brazil, phylodynamic reconstruction identified at least 104 international introductions during March and April 2020, with domestic transmission already well-established by early March, suggesting that international restrictions implemented thereafter had limited impact [59]. This demonstrates how phylodynamics can provide nuanced assessment of intervention timing and effectiveness.
Informing Variant-Specific Control Measures
The emergence of SARS-CoV-2 variants of concern highlighted another critical application of phylodynamics: tracking and characterizing novel variants with potentially enhanced transmissibility or immune evasion capabilities [85]. By analyzing the relative growth rates of different lineages, researchers can estimate variant-specific R₀ values and inform targeted public health responses.
Phylodynamic analyses revealed that the D614G mutation in the spike protein was associated with increased transmissibility, as lineages carrying this mutation demonstrated a selective advantage and rapidly became dominant globally [59]. Similarly, comparative analyses of different genotypes revealed distinct dispersal dynamics; the SW03 genotype was associated with significantly higher dispersal velocity compared to the dominant WN02 genotype [86].
Such variant-specific insights enable precision public health responses, where control measures can be tailored to the specific characteristics of circulating variants [85]. This represents a significant advancement from one-size-fits-all approaches to more targeted and efficient intervention strategies.
Monitoring Intervention Effectiveness Through Temporal R₀ Estimation
A particularly powerful application of phylodynamics is estimating how R₀ changes over time in response to interventions. Time-varying birth-death skyline models can reconstruct fluctuations in transmission rates coinciding with implementation or relaxation of control measures [88].
Research during the COVID-19 pandemic demonstrated that phylodynamic R₀ estimates showed general agreement with traditional epidemiological estimates while providing additional evolutionary context [88]. One study comparing North American influenza A(H1N1)pdm09 transmission potentials found no significant difference (p = 0.46) between birth-death model estimates and surveillance-based R₀ estimates, supporting the validity of phylodynamic approaches [88].
These methods can also identify the specific impact of environmental factors on transmission dynamics. For West Nile Virus, analyses identified that lineage dispersal velocity was significantly associated with temperature, with lineages dispersing faster in areas with higher temperatures [86]. Such insights help predict how climate or seasonal factors might modulate intervention effectiveness.
Experimental Protocols and Methodologies
Protocol 1: Bayesian Phylodynamic Inference of R₀ Using BEAST2
This protocol outlines the steps for estimating time-varying reproduction numbers from viral sequence data using birth-death skyline models in BEAST2.
Materials and Reagents
- Viral nucleotide sequences in FASTA format
- Sequence metadata (collection dates and locations)
- BEAST2 software package (v2.7.0 or higher)
- Appropriate computing resources (minimum 16GB RAM, multi-core processor)
Procedure
Sequence Alignment and Preparation
- Perform multiple sequence alignment using MAFFT or MUSCLE
- Curate metadata to ensure accurate collection dates
- Partition data if analyzing large datasets (>500 sequences)
Substitution Model Selection
- Test nucleotide substitution models (HKY, GTR) with site heterogeneity (Γ)
- Perform model selection using bModelTest or path sampling
- Select best-fitting model based on marginal likelihood comparison
Molecular Clock Calibration
- Test strict vs. relaxed (uncorrelated lognormal) molecular clocks
- Calibrate using known sampling dates (tip dating)
- Validate clock model using path sampling if necessary
Tree Prior Configuration
- Select Birth-Death Skyline model for time-varying R₀ estimation
- Set prior distributions: Gamma(1, 0.001) for clock rate, Exponential(1) for R₀
- Configure skyline intervals to match key intervention timepoints
MCMC Execution and Diagnostics
- Run Markov Chain Monte Carlo (MCMC) for adequate generations (typically 10⁷-10⁹)
- Monitor convergence using Tracer (ESS values >200 for all parameters)
- Perform multiple independent runs to verify reproducibility
Post-processing and Interpretation
- Combine log files from multiple runs using LogCombiner
- Generate maximum clade credibility tree using TreeAnnotator
- Extract R₀ estimates through time using R or Tracer
Protocol 2: Assessing Intervention Impact Using Phylogeographic Analysis
This protocol describes how to quantify the impact of travel restrictions or other spatial interventions using discrete phylogeographic methods.
Materials and Reagents
- Time-stamped viral sequences with location metadata
- Shapefiles or geographic data for regions of interest
- BEAST2 with Structured Birth-Death model package
- SPREAD3 or other phylogeographic visualization software
Procedure
Data Structuring and Discretization
- Assign sequences to discrete locations (countries, states, etc.)
- Balance sampling density across locations through subsampling if needed
- Create location-aware NEXUS file for BEAST2 analysis
Spatial Model Configuration
- Implement asymmetric location transition model
- Set up structured birth-dedeath model with location states
- Incorporate non-informative priors for migration rates
Spatio-temporal Analysis
- Run MCMC analysis with spatial parameters
- Reconstruct ancestral locations using Bayesian stochastic mapping
- Estimate migration rates between locations through time
Intervention Period Comparison
- Categorize results into pre-, during, and post-intervention periods
- Quantify migration rates between specific location pairs
- Calculate statistical support for changes using Bayes factors
Visualization and Interpretation
- Animate spatial spread using SPREAD3 or other tools
- Generate migration networks showing significant pathways
- Correlate migration rate changes with intervention timing
Visualization of Phylodynamic Analysis Workflows
R₀ Estimation Workflow
Intervention Validation Methodology
Table 2: Essential Computational Tools for Phylodynamic Inference
| Tool/Resource | Type | Primary Function | Application Context |
|---|---|---|---|
| BEAST2 | Software Package | Bayesian evolutionary analysis | Primary platform for phylodynamic inference; integrates multiple models |
| Tracer | Diagnostic Tool | MCMC output analysis | Assess convergence, summarize parameters, visualize distributions |
| TreeAnnotator | Utility Software | Tree set summarization | Generate maximum clade credibility trees from posterior sets |
| IQ-TREE | Software Package | Maximum likelihood phylogenetics | Rapid tree inference for initial exploratory analyses |
| Nextstrain | Visualization Platform | Real-time pathogen tracking | Interactive visualization of spatial and temporal spread |
| GISAID | Data Repository | Pathogen sequence database | Source for curated viral sequences with metadata |
Challenges and Future Directions
Despite its powerful applications, phylodynamic inference faces several methodological challenges that researchers must acknowledge. Sampling bias remains a critical concern, as uneven spatial or temporal sampling can dramatically skew parameter estimates [89]. Additionally, the low genetic diversity characteristic of emerging outbreaks can impede accurate parameter estimation, particularly for coalescent-based methods [87].
Evolutionary complexities such as selective pressure, recombination, and varying mutation rates further complicate inference [89]. These factors can violate model assumptions and lead to biased estimates if not properly accounted for in analytical frameworks.
Future methodological developments are addressing these limitations through several avenues:
- Integrated models that combine genomic and epidemiological surveillance data
- Structured coalescent approaches that better account for population heterogeneity
- Machine learning applications to improve scalability for massive datasets
- Seedbank models that incorporate dormant states, particularly relevant for pathogens like Mycobacterium tuberculosis [33]
As these methods mature, phylodynamics is expanding beyond infectious disease epidemiology into new domains including cancer evolution and cellular development, with frameworks like scPhyloX now enabling phylodynamic inference of stem cell differentiation and tumor evolution from single-cell lineage tracing data [90].
Phylodynamic approaches provide an powerful analytical framework for validating public health interventions through rigorous, data-driven assessment of their impact on pathogen transmission dynamics. By leveraging the informational content of pathogen genetic sequences, these methods enable estimation of fundamental epidemiological parameters like R₀ and facilitate direct testing of hypotheses regarding intervention effectiveness.
The protocols and applications detailed in this document provide researchers with practical methodologies for implementing these analyses, while the discussion of challenges and limitations offers crucial context for appropriate interpretation of results. As genomic surveillance continues to expand and methodological innovations address current limitations, phylodynamics is poised to play an increasingly central role in evidence-based public health decision-making, outbreak response, and pandemic preparedness planning.
The integration of phylodynamic inference into public health practice represents a paradigm shift toward more precise, molecularly-informed interventions that can be quantitatively validated and iteratively refined based on real-time genomic surveillance.
The basic reproduction number, R₀, is a foundational metric in infectious disease epidemiology, defined as the average number of secondary cases generated by a single infectious individual in a fully susceptible population. This parameter serves as a crucial indicator of transmission potential and plays a vital role in forecasting epidemic trajectories and designing control strategies. Within the broader context of phylodynamic inference research, understanding R₀ provides essential parameters for models that reconstruct pathogen population dynamics from genetic sequence data. Phylodynamic approaches leverage molecular epidemiology to infer transmission dynamics, with R₀ serving as a key quantitative benchmark for comparing pathogen spread across different ecological contexts and evolutionary timescales. Accurate R₀ estimation is therefore paramount for both public health intervention and evolutionary studies of pathogen emergence and spread.
The principal epidemiological interpretation of R₀ is straightforward: values greater than 1 indicate potential epidemic growth, while values less than 1 suggest outbreak decline. However, beneath this simple interpretation lies substantial complexity, as R₀ is not a fixed biological constant for a pathogen but rather emerges from the interaction of biological, sociobehavioral, and environmental factors that govern transmission [7]. This application note provides a comparative analysis of R₀ variation across pathogens and outbreak settings, details experimental protocols for estimation, and integrates these concepts within a phylodynamic research framework.
Quantitative Comparison of R₀ Across Pathogens
R₀ values demonstrate remarkable diversity across pathogen species and strains, reflecting differences in transmission mode, host adaptation, and evolutionary history. The table below summarizes documented R₀ values for major human pathogens, illustrating this variability.
Table 1: Comparative R₀ Values and Herd Immunity Thresholds for Viral Pathogens
| Pathogen | Transmission Mode | R₀ Range | Herd Immunity Threshold |
|---|---|---|---|
| Measles | Aerosol | 12-18 [6] [5] | 92-94% [5] |
| Chickenpox (Varicella) | Aerosol | 10-12 [5] | 90-92% [5] |
| Mumps | Respiratory droplets | 10-12 [5] | 90-92% [5] |
| COVID-19 (Omicron variant) | Respiratory droplets/aerosol | ~9.5 [5] | ~89% [5] |
| COVID-19 (ancestral strain) | Respiratory droplets/aerosol | 2.9 (2.4-3.4) [5] | 65% (58-71%) [5] |
| Rubella | Respiratory droplets | 6-7 [5] | 83-86% [5] |
| Polio | Fecal-oral route | 5-7 [5] | 80-86% [5] |
| Smallpox | Respiratory droplets | 3.5-6.0 [5] | 71-83% [5] |
| Ebola (2014 outbreak) | Body fluids | 1.8 (1.4-1.8) [5] | 44% (31-44%) [5] |
| Seasonal Influenza | Respiratory droplets | 1.3 (1.2-1.4) [5] | 23% (17-29%) [5] |
| MERS | Respiratory droplets | 0.5 (0.3-0.8) [5] | 0% (Naturally disappears) [5] |
For bacterial pathogens, R₀ estimation is more complex due to frequent asymptomatic colonization, but recent research has revealed significant transmission variation even between closely related clones. A 2025 study on pandemic Escherichia coli ST131 lineages demonstrated markedly different transmission potentials:
Table 2: R₀ Variation in Closely Related Bacterial Clones (E. coli ST131 Lineage)
| E. coli Clade | R₀ Estimate | Interpretation |
|---|---|---|
| ST131-A | 1.47 | Comparable to pandemic influenza viruses [21] |
| ST131-C1 | 1.18 | Dissemination aided by antibiotic selection and healthcare facilities [21] |
| ST131-C2 | 1.13 | Dissemination aided by antibiotic selection and healthcare facilities [21] |
This variation between closely related bacterial clones highlights how subtle genetic differences can significantly impact transmission dynamics, with important implications for the phylodynamic inference of selection pressures and strain emergence.
Factors Driving R₀ Variation
Biological and Environmental Determinants
R₀ variation arises from differences in three fundamental parameters, which can be conceptualized as: R₀ = Transmissibility × Contact Rate × Infectious Duration [91].
- Pathogen Transmissibility: The probability of infection per contact between a susceptible and infectious individual. This biological property varies significantly between pathogens based on mechanisms like viral shedding density and environmental stability [7].
- Contact Rate: The frequency of effective contacts between individuals in a population. This sociobehavioral factor is highly variable across populations with different densities, social structures, and cultural practices [7] [91].
- Duration of Infectiousness: The time period during which an infected individual can transmit the pathogen. This is influenced by host immune responses and pathogen evasion strategies, and can be affected by treatment interventions [7] [91].
Beyond biological and ecological factors, estimated R₀ values vary substantially due to methodological differences in their calculation. Different statistical approaches applied to the same outbreak data can yield meaningfully different R₀ estimates, as demonstrated in a comparative methods study on influenza data [83]:
Table 3: Method-Dependent R₀ Estimates from the Same Influenza Outbreak Data
| Estimation Method | R₀ Estimate (95% CI) |
|---|---|
| Attack Rate (AR) | 1.116 (1.1163, 1.1165) |
| Exponential Growth (EG) | 1.46 (1.41, 1.52) |
| Maximum Likelihood (ML) | 1.42 (1.27, 1.57) |
| Time-Dependent (TD) | 1.71 (1.12, 2.03) |
| Gamma-Distributed Generation Time | 1.49 (1.0, 1.97) |
| Final Size Equation | 1.00 (0.91, 1.09) |
This methodological variation is particularly pronounced in early outbreak stages, with many methods exhibiting systematic overestimation when applied to limited initial data [92]. The accuracy of these methods improves as outbreaks progress and more data becomes available, but this creates challenges for real-time response where early R₀ estimates often guide critical intervention decisions [92].
Experimental Protocols for R₀ Estimation
Protocol 1: Estimation from Incidence Data Using the R₀ Package
Purpose: To estimate reproduction numbers from epidemic incidence curves using standardized statistical methods.
Background: The R₀ package for R provides a unified implementation of five common estimation methods, allowing researchers to compare results across different approaches and identify consistent patterns [93].
Table 4: Research Reagent Solutions for R₀ Estimation
| Resource | Type | Application/Function |
|---|---|---|
| R software environment | Computational platform | Statistical computing and graphics [83] |
| R₀ package | R library | Implements multiple R₀ estimation methods [93] |
| Epidemic curve data | Surveillance data | Daily or weekly case incidence time series [93] |
| Generation time distribution | Epidemiological parameter | Discretized distribution of serial intervals [93] |
Procedure:
- Data Preparation: Import epidemic curve data as a vector of incidence counts or dates of onset. Ensure consistent time intervals (e.g., daily or weekly reporting).
- Generation Time Specification: Define the generation time distribution using
generation.time()with type "empirical," "gamma," "lognormal," or "weibull." For influenza, a gamma distribution with mean 2.6 days and standard deviation 1 day is often used [93]. - Method Selection: Choose appropriate estimation methods based on outbreak stage and data quality:
- Exponential Growth (EG): For early epidemic phase with clear exponential growth.
- Maximum Likelihood (ML): When the entire epidemic curve up to the peak is available.
- Time-Dependent (TD): For estimating time-varying reproduction numbers throughout the outbreak.
- Sequential Bayesian (SB): For real-time estimation with prior distributions.
- Sensitivity Analysis: Vary the time window for exponential growth period and generation time parameters to assess estimate stability.
- Validation: Compare results across multiple methods and calculate goodness-of-fit statistics (e.g., deviance R-squared) to identify optimal approaches.
Visualization of the experimental workflow:
Protocol 2: Phylodynamic Inference of R₀ from Molecular Data
Purpose: To estimate historical reproduction numbers and population dynamics from pathogen genetic sequence data using Bayesian phylodynamic methods.
Background: Phylodynamic inference connects evolutionary models with epidemiological dynamics, allowing reconstruction of past transmission patterns from genetic diversity. Recent advances enable incorporation of complex population structures, including seedbank effects (dormancy) observed in many bacterial pathogens and some viruses [33].
Procedure:
- Sequence Alignment: Curate and align pathogen genomic sequences with associated collection dates.
- Model Specification: Define evolutionary, clock, and demographic models in a Bayesian framework:
- Substitution Model: Select appropriate nucleotide substitution model (e.g., GTR) with gamma-distributed rate variation.
- Molecular Clock Model: Choose strict or relaxed clock based on temporal signal.
- Coalescent Model: For pathogens with dormancy, implement seedbank coalescent to account for lineages in dormant states [33].
- Parameterization: Set priors for key parameters including reproduction number (R₀), population size, and seedbank parameters (dormancy duration, reactivation rates).
- MCMC Sampling: Run Markov Chain Monte Carlo sampling to approximate joint posterior distribution of parameters.
- Convergence Assessment: Monitor effective sample sizes (>200) and trace plots to ensure parameter convergence.
- Posterior Analysis: Extract marginal posterior distributions for R₀ and population dynamics parameters, accounting for phylogenetic uncertainty.
Application Note: For pathogens like Mycobacterium tuberculosis with significant latent periods, the strong seedbank coalescent model provides more accurate inference of transmission dynamics compared to standard coalescent models, as it accounts for lineages that cannot coalesce during dormancy [33].
Visualization of the phylodynamic R₀ inference framework:
Advanced Research Applications
Integrating Epidemiological and Genomic Data
Modern R₀ research increasingly combines traditional epidemiological approaches with genomic surveillance. A pioneering study on E. coli ST131 lineages demonstrated how to overcome the challenge of estimating R₀ for bacteria with frequent asymptomatic colonization [21]. The researchers developed a hybrid model combining:
- A deterministic compartmental model for asymptomatic gut colonization
- A stochastic observation model linking colonization to bloodstream infections
- Genomic data to estimate clade-specific odds ratios of causing disease
- Simulation-based inference (Approximate Bayesian Computation) to calibrate model parameters
This approach enabled quantification of transmission differences between closely related bacterial clones that would be impossible using traditional methods alone, providing a template for studying other opportunistic pathogens with complex transmission dynamics.
Accounting for Superspreading and Heterogeneity
Traditional R₀ estimates represent population averages that may mask important individual-level variation in transmission. Superspreading events, where certain individuals infect disproportionately large numbers of secondary cases, represent a crucial limitation of the basic R₀ concept [6]. Network-based epidemiology models address this by incorporating contact heterogeneity through degree distributions, providing more realistic estimates of transmission potential in structured populations [5]. Future research should prioritize integrating these network approaches with phylodynamic methods to better capture the interplay between host contact structure and pathogen evolution.
Comparative analysis of R₀ across pathogens and outbreak settings reveals substantial variation driven by biological differences, ecological contexts, and methodological approaches. Rather than treating R₀ as a fixed biological constant, researchers should recognize it as an emergent property of complex systems that reflects the interaction between pathogens, hosts, environments, and measurement approaches. For phylodynamic inference research, this necessitates careful consideration of how well models capture key aspects of transmission dynamics, including population structure, host heterogeneity, and pathogen life history traits like dormancy. Standardized estimation protocols and transparent reporting of methodological assumptions are essential for generating comparable, reliable R₀ estimates that can effectively inform both public health interventions and evolutionary studies of pathogen spread.
The basic reproduction number, R₀, represents the average number of secondary infections generated by a single infectious individual in a fully susceptible population. It serves as a fundamental metric in infectious disease epidemiology, directly reflecting pathogen transmissibility and informing the intensity of control interventions required to curb transmission [49] [94]. Phylodynamics—the integration of phylogenetic analysis with mathematical epidemiology—has emerged as a powerful framework for estimating R₀ directly from pathogen genetic sequence data, providing a complementary approach to traditional epidemiological surveillance [8]. This approach leverages the fact that the structure of pathogen phylogenies contains imprints of past population dynamics, including transmission intensity and heterogeneity [34].
For emerging pathogens like SARS-CoV-2, phylodynamic analysis has enabled researchers to track the temporal and spatial dynamics of spread while estimating key epidemiological parameters. These estimates have proven critical for assessing the threat level of outbreaks, forecasting healthcare needs, and evaluating the potential impact of various intervention strategies [8]. The method has been successfully applied to diverse pathogens, from viral threats like Ebola and SARS-CoV-2 to bacterial pathogens such as extra-intestinal pathogenic Escherichia coli, demonstrating its broad utility across microbial taxa [34] [21].
Table 1: Key Epidemiological Parameters and Their Interpretation
| Parameter | Definition | Epidemiological Interpretation | Public Health Implication |
|---|---|---|---|
| R₀ | Average number of secondary cases from a primary case in fully susceptible population | R₀ > 1: Epidemic potentialR₀ < 1: Outburn decline | Determines intervention intensity needed to control spread |
| Dispersion Parameter (k) | Measure of individual variation in transmission | Lower k values indicate greater heterogeneity (superspreading) | Targeted interventions may be more effective |
| Herd Immunity Threshold | Proportion of population requiring immunity to stop transmission | Calculated as 1 - 1/R₀ | Determines vaccination coverage goals |
Quantitative Estimates of R₀ Across Pathogens
Systematic reviews and meta-analyses of R₀ for emerging pathogens provide crucial baseline parameters for modeling efforts and intervention planning. A comprehensive systematic review of COVID-19 R₀ estimates from early in the pandemic found a pooled mean value of 3.32 (95% CI: 2.81 to 3.82) across 23 studies, indicating substantially higher transmissibility than initial World Health Organization estimates of 1.4-2.5 [94]. This estimate suggests that controlling COVID-19 would require reducing transmission by approximately 68.7% (calculated as 1 - 1/R₀) through combined interventions [94].
Recent research demonstrates that R₀ can vary significantly even between closely related bacterial clones. For pandemic Escherichia coli ST131 lineages, the R₀ for the ST131-A clade was estimated at 1.47, comparable to pandemic influenza viruses, while the ST131-C1 and ST131-C2 clades showed significantly lower transmissibility (R₀ = 1.18 and 1.13, respectively) [21]. This variation suggests that factors beyond genetic relatedness, including antibiotic selection pressure and healthcare facility transmission networks, significantly influence transmission dynamics [21].
Table 2: Comparative R₀ Estimates Across Pathogens
| Pathogen | R₀ Estimate | Methodology | Source |
|---|---|---|---|
| SARS-CoV-2 (original strain) | 3.32 (95% CI: 2.81-3.82) | Systematic review & meta-analysis | [94] |
| Measles | ~15 | Historical epidemiological observation | [95] |
| E. coli ST131-A | 1.47 | Compartmental model with observation model | [21] |
| E. coli ST131-C1 | 1.18 | Compartmental model with observation model | [21] |
| E. coli ST131-C2 | 1.13 | Compartmental model with observation model | [21] |
Phylodynamic Methods for R₀ Estimation
Theoretical Framework
Phylodynamic inference of R₀ typically operates within the framework of birth-death models or coalescent theory applied to time-scaled phylogenetic trees. Under these models, a "birth" event corresponds to disease transmission, while a "death" event represents recovery or sampling [8]. The branching times and tree topology contain information about the rate of spread through a population, which can be extracted through statistical methods to estimate R₀ [8]. The method relies on the molecular clock hypothesis, which enables the translation of genetic distances into time scales, thereby connecting the temporal information in sampling dates with genetic similarities to estimate the timescale of transmission trees [8].
A significant advancement in phylodynamic methods involves estimating both the reproduction number (R) and the dispersion parameter (k) from clusters of identical pathogen sequences. This approach harnesses the size distribution of clusters of identical sequences, which are imprinted by the disease offspring distribution [49]. The number of offspring with identical genomes follows a negative binomial distribution with mean p·R and dispersion parameter k, where p represents the probability that an infectee has the same consensus genome as their infector [49]. This method enables estimation without building full phylogenetic trees, making it scalable to large genomic datasets.
Experimental Protocol: Estimating R₀ from Pathogen Genomic Data
Purpose: To estimate the basic reproduction number (R₀) and dispersion parameter (k) from pathogen genome sequences using phylodynamic methods.
Materials and Equipment:
- Pathogen consensus sequences with collection dates
- High-performance computing infrastructure
- Phylodynamic software packages (BEAST X, TreeTime, TempEst)
- Sequence alignment software (MAFFT, Clustal Omega)
Procedure:
- Data Curation and Alignment
- Collect pathogen consensus sequences with accurate collection dates
- Perform multiple sequence alignment using appropriate methods for the pathogen type
- Assess temporal signal in the data using TempEst to check for clock-likeness
- Phylogenetic Reconstruction
- Select appropriate substitution model (HKY, GTR, or codon models) using model testing
- Choose molecular clock model (strict, relaxed, or time-dependent) based on temporal signal analysis
- Run Bayesian phylogenetic inference using BEAST X with appropriate chain lengths for convergence
- Assess convergence using effective sample size (ESS > 200) and trace plots
- Parameter Estimation
- Specify birth-death model for tree prior to estimate reproductive number
- Incorporate susceptible population size if known
- Run MCMC sampling with appropriate operators and proposal distributions
- Validate model fit using posterior predictive simulations
- Alternative Method: Cluster-Based Inference
- Identify clusters of identical sequences within the dataset
- Record the size distribution of these clusters
- Apply maximum likelihood framework to estimate R and k from cluster size distribution
- Account for sequencing proportion and probability of identical transmission (p)
Troubleshooting Tips:
- If ESS values remain low, consider increasing chain length or adjusting operators
- If temporal signal is weak, consider using only recent samples or validating with external data
- For cluster-based methods, ensure adequate sample representation to avoid biased estimates
The Scientist's Toolkit: Essential Research Reagents and Software
Table 3: Research Reagent Solutions for Phylodynamic Analysis
| Tool/Reagent | Type | Primary Function | Application Context |
|---|---|---|---|
| BEAST X | Software Package | Bayesian phylogenetic inference with complex trait evolution | Gold-standard for phylodynamic analysis; integrates sequence evolution, demographics, and trait evolution [34] |
| TempEst | Software Tool | Investigate temporal signal and clocklikeness of phylogenies | Pre-analysis assessment of data quality for molecular clock dating [96] |
| TreeTime | Software Package | Ancestral sequence reconstruction and molecular-clock phylogenies | Fast inference of time-scaled trees and ancestral states [96] |
| Negative Binomial Model | Statistical Framework | Estimate transmission heterogeneity from cluster data | Quantify superspreading (dispersion parameter k) from case data or genetic clusters [49] |
| Birth-Death SIR Model | Mathematical Model | Estimate transmission parameters from phylogenetic trees | Infer R₀ from branching rates in time-scaled phylogenies [8] |
| Monovalent Antisera | Laboratory Reagent | Antigenic characterization of variants | Assess antigenic distance between variants for vaccine strain selection [97] |
From R₀ to Herd Immunity Thresholds and Vaccine Design
Calculating Herd Immunity Thresholds
The herd immunity threshold (HIT) represents the proportion of the population that must be immune to interrupt chain-of-transmission of an infectious disease. This critical threshold is mathematically derived from R₀ using the formula: HIT = 1 - 1/R₀ [95]. For pathogens with different R₀ values, this translates to dramatically different vaccination coverage targets. For measles, with an R₀ of approximately 15, the HIT reaches approximately 93%, while for the original SARS-CoV-2 strain with an R₀ of 3.32, the threshold would be approximately 70% [95] [94].
These calculations, however, rely on several simplifying assumptions, including homogeneous mixing within populations, perfect and lasting immunity, and no emergence of immune-evading variants [95]. In reality, population structure, waning immunity, and viral evolution complicate the achievement of herd immunity, particularly for pathogens like SARS-CoV-2 where new variants continue to emerge with altered transmissibility and antigenic properties [98] [95].
Application to Vaccine Design and Selection
Phylodynamics and R₀ estimation play crucial roles in vaccine design and selection, particularly for rapidly evolving pathogens. The World Health Organization's Technical Advisory Group on COVID-19 Vaccine Composition (TAG-CO-VAC) relies on genetic and antigenic evolution data to inform periodic updates to vaccine antigen compositions [97]. This process requires comprehensive data on the genetic evolution of SARS-CoV-2, antigenic characterization of variants using animal antisera, immunogenicity data from human sera, and vaccine effectiveness estimates against circulating variants [97].
For COVID-19 vaccines, the estimated R₀ directly influences vaccination coverage targets. Research indicates that achieving vaccine-derived herd immunity against the original SARS-CoV-2 strain would require vaccinating at least 60% of the population with highly effective vaccines [99]. However, the emergence of more transmissible variants increases the herd immunity threshold, necessitating higher vaccination coverage or updated vaccine formulations [98].
Experimental Protocol: Determining Vaccine Antigen Composition
Purpose: To inform updates to COVID-19 vaccine antigen composition based on viral evolution and population immunity.
Materials and Equipment:
- Viral isolates representing circulating variants
- Animal models for antisera generation
- Pre- and post-vaccination human sera
- Virus neutralization assay materials
- Pseudotype virus neutralization systems
Procedure:
- Genetic Surveillance
- Monitor circulating variants through global genome sequencing
- Identify Variants of Interest (VOI) and Variants Under Monitoring (VUM)
- Perform phylogenetic analysis to track emergence and spread
- Antigenic Characterization
- Generate monovalent animal antisera against key variants (XBB.1.5, JN.1, KP.2, etc.)
- Conduct one-way and two-way neutralization tests using both pseudotype and live virus assays
- Calculate antigenic distances between variants
- Immunogenicity Assessment
- Collect human sera from individuals vaccinated with current formulations
- Measure neutralizing antibody titers against panel of variants
- Assess breadth and durability of immune responses at multiple timepoints
- Vaccine Effectiveness Studies
- Conduct observational studies to estimate variant-specific vaccine effectiveness
- Control for time since vaccination and prior infection history
- Calculate relative vaccine effectiveness for protection against infection, symptomatic disease, and severe disease
Data Integration for Decision-Making:
- WHO TAG-CO-VAC integrates genetic, antigenic, immunogenicity, and effectiveness data
- Manufacturers provide non-clinical and clinical data for vaccines in development
- Comparative immunogenicity data between previous and candidate formulations inform decisions
Phylodynamic inference of R₀ provides a powerful framework for connecting pathogen genetic sequence data to fundamental epidemiological parameters that directly inform public health interventions. From establishing vaccine coverage targets through herd immunity thresholds to guiding antigen selection for updated vaccine formulations, these methods bridge the gap between molecular surveillance and population-level disease control strategies. As pathogen evolution continues to present challenges for disease control, particularly for rapidly mutating viruses like SARS-CoV-2 and influenza, the integration of phylodynamics with traditional epidemiology will remain essential for designing effective countermeasures. The continued refinement of these methods, including the development of more scalable approaches that can handle the increasingly large genomic datasets being generated, will further enhance their utility in public health decision-making.
Expert Perspectives on Integrating Genomic Tools into Public Health Practice
National Genomic Medicine Initiatives: Quantitative Outcomes
Large-scale national genomic medicine initiatives demonstrate the operational frameworks and quantitative outcomes achievable when integrating genomics into public health. The following table summarizes key performance metrics from France's PFMG2025 program, one of the first nationwide clinical genomic sequencing implementations [100].
Table 1: Performance Metrics of France's PFMG2025 Genomic Medicine Initiative (as of December 2023)
| Metric | Rare Diseases/Cancer Genetic Predisposition (RD/CGP) | Cancers |
|---|---|---|
| Total Results Returned | 12,737 | 3,109 |
| Median Delivery Time | 202 days | 45 days |
| Diagnostic Yield | 30.6% | Not Specified |
| Government Investment | €239 million (total for the initiative) | |
| Annual Prescription Estimate | 17,380 (17,230 for RD; 150 for CGP) | 12,300 |
| Number of Validated Pre-indications | 62 | 8 |
The French initiative has established a network involving 1,823 clinicians, 1,161 of whom have made at least one prescription, with 75 (6.5%) responsible for the majority of prescriptions (69.4% for RD/CGP and 42.4% for cancers) [100]. Biological interpretation is supported by 310 clinical biologists across the country [100].
Protocol for Implementing Population-Wide Genomic Screening (PGS)
The FOCUS (Facilitating the Implementation of Population-wide Genomic Screening) study protocol provides a structured framework for implementing equitable PGS programs, designed to identify the 1-2% of the population at elevated risk for serious, actionable genetic conditions such as hereditary breast and ovarian cancer syndrome, Lynch syndrome, and familial hypercholesterolemia [101].
Implementation Mapping Framework and Study Design
The protocol uses an Implementation Mapping (IM) approach, guided by the Consolidated Framework for Implementation Research integrated with Health Equity (CFIR/HE) and the Reach, Effectiveness, Adoption, Implementation, and Maintenance framework for Health Equity (RE-AIM/HE) [101]. The study involves:
- Design Sites: 10 diverse organizations representing four implementation stages (exploration, preparation, implementation, and sustainment) to identify barriers and facilitators [101].
- Test Sites: 12 organizations to evaluate the FOCUS toolkit's effectiveness using a hybrid stepped-wedge cluster randomized trial design [101].
- Advisory Panel: 13 stakeholders (public health agencies, community members, patient groups, primary care, and clinical stakeholders) meeting quarterly to guide the research [101].
Key Phases and Data Collection
Aim 1: Needs Assessment and Barrier Identification
- Method: Qualitative interviews with Implementation Team Members (ITMs), PGS patients, and laboratory vendors using the CFIR/HE framework [101].
- Progress: As of the protocol report, 33 interviews with ITMs, 8 with patients, and 2 with laboratory vendors have been completed [101].
Aim 2: Toolkit Development
- Process: Development and packaging of implementation strategies into a freely available, web-based FOCUS toolkit to support equitable PGS implementation [101].
Aim 3: Toolkit Evaluation
- Evaluation Framework: Using the RE-AIM/HE framework to assess the toolkit's impact on improving PGS reach, effectiveness, adoption, and maintenance [101].
- Timeline: The project was funded in September 2024 and will conclude in June 2029 [101].
Workflow Visualization for Phylodynamic Inference in Public Health Genomics
The integration of genomic surveillance with phylodynamic analysis creates a critical feedback loop for public health action. The following workflow details this process.
Essential Research Reagent Solutions for Genomic Implementation
Successful integration of genomic tools requires specific, high-quality reagents and materials at each stage of the workflow.
Table 2: Essential Research Reagents for Public Health Genomic Studies
| Category | Specific Reagent/Kit | Function in Workflow |
|---|---|---|
| Nucleic Acid Extraction | High-throughput DNA/RNA extraction kits | Isolate high-quality genetic material from diverse sample types (e.g., blood, tissue, saliva) for sequencing [100]. |
| Library Preparation | Whole Genome Sequencing (WGS) or Whole Exome Sequencing (WES) library prep kits | Fragment DNA and attach sequencing adapters for comprehensive genomic analysis [100] [101]. |
| Target Enrichment | Panels for hereditary cancer syndromes (e.g., HBOC, Lynch) | Selectively capture genes associated with specific public health conditions for focused screening [101]. |
| Sequencing | Next-Generation Sequencing (NGS) flow cells and chemistry | Generate raw nucleotide sequence data; platform-dependent (e.g., Illumina, Oxford Nanopore) [100]. |
| Bioinformatics Analysis | Variant calling pipelines (e.g., GATK), phylogenetic software (e.g., BEAST) | Process raw sequence data, identify genetic variants, and infer transmission dynamics for R0 calculation [101]. |
| Data Management | Secure data storage and analysis platforms (e.g., CAD in PFMG2025) | Store, manage, and allow analysis of massive genomic datasets while ensuring data security [100]. |
Conclusion
Phylodynamic inference has fundamentally transformed our ability to estimate R0 directly from pathogen genome sequences, providing a powerful lens through which to view epidemic spread. This synthesis demonstrates that while robust methodologies now exist for diverse pathogens—from SARS-CoV-2 and Influenza to pandemic E. coli clones—key challenges in sampling bias, model specification, and computational scalability remain active frontiers. The validated agreement between phylodynamic and traditional epidemiological R0 estimates underscores its reliability. Future directions will involve refining models to better capture host population structure and heterogeneity in transmission, improving real-time analytical capabilities for outbreak response, and deepening the integration of phylodynamic insights into the design of vaccines and therapeutic strategies. For biomedical researchers and public health professionals, mastering these tools is no longer optional but essential for navigating the complex landscape of infectious disease threats.
References
- 1. Viral phylodynamics - PubMed - NIH [https://pubmed.ncbi.nlm.nih.gov/23555203/]
- 2. Viral phylodynamics [https://en.wikipedia.org/wiki/Viral_phylodynamics]
- 3. Phylodynamics - an overview | ScienceDirect Topics [https://www.sciencedirect.com/topics/biochemistry-genetics-and-molecular-biology/phylodynamics]
- 4. Epidemiological inference from pathogen genomes: A review ... [https://pmc.ncbi.nlm.nih.gov/articles/PMC9241095/]
- 5. Basic reproduction number [https://en.wikipedia.org/wiki/Basic_reproduction_number]
- 6. Understanding the Basic Reproduction Number (R0) [https://www.gideononline.com/blogs/understanding-the-basic-reproduction-number-r0-the-key-to-tracking-disease-spread/]
- 7. Complexity of the Basic Reproduction Number (R0) [https://wwwnc.cdc.gov/eid/article/25/1/17-1901_article]
- 8. Phylodynamic analysis in the understanding of the current ... [https://pmc.ncbi.nlm.nih.gov/articles/PMC7898299/]
- 9. Phylodynamic estimation of incidence and prevalence ... [https://virological.org/t/phylodynamic-estimation-of-incidence-and-prevalence-of-novel-coronavirus-ncov-infections-through-time/391]
- 10. Interpretation of the Basic and Effective Reproduction ... [https://pmc.ncbi.nlm.nih.gov/articles/PMC7733754/]
- 11. Application of Phylodynamic Tools to Inform the Public Health ... [https://formative.jmir.org/2023/1/e39409]
- 12. Assessment of basic reproduction number (R0), spatial and ... [https://pmc.ncbi.nlm.nih.gov/articles/PMC8078038/]
- 13. Molecular Phylogenetics - Genomes - NCBI Bookshelf - NIH [https://www.ncbi.nlm.nih.gov/books/NBK21122/]
- 14. Molecular clock [https://en.wikipedia.org/wiki/Molecular_clock]
- 15. Genomic epidemiological models describe pathogen ... [https://pmc.ncbi.nlm.nih.gov/articles/PMC9278859/]
- 16. Shared Genomic Variants: Identification of Transmission ... [https://pmc.ncbi.nlm.nih.gov/articles/PMC5860558/]
- 17. When are pathogen genome sequences informative of ... [https://journals.plos.org/plospathogens/article?id=10.1371/journal.ppat.1006885]
- 18. Inferring bacterial transmission dynamics using deep ... [https://www.nature.com/articles/s41467-023-42211-8]
- 19. Estimating the relative probability of direct transmission ... [https://pmc.ncbi.nlm.nih.gov/articles/PMC7394954/]
- 20. The basic reproduction number (R0) of ebola virus disease [https://www.sciencedirect.com/science/article/pii/S147789392300145X]
- 21. Basic reproduction number varies markedly between ... [https://www.nature.com/articles/s41467-025-65301-1]
- 22. Sampling through time and phylodynamic inference ... - PMC [https://pmc.ncbi.nlm.nih.gov/articles/PMC4223917/]
- 23. Robust Phylodynamic Analysis of Genetic Sequencing ... [https://pmc.ncbi.nlm.nih.gov/articles/PMC9413058/]
- 24. The coalescent SIR model in BEAST [https://www.beast2.org/2014/08/18/the-coalescent-sir-model-in-beast.html]
- 25. Estimating R0 from coalescent growth rates [https://beast.community/estimating_R0]
- 26. Estimating pathogen spread using structured coalescent ... [https://www.sciencedirect.com/science/article/pii/S1755436524000562]
- 27. Sampling through time and phylodynamic inference with ... [https://ui.adsabs.harvard.edu/abs/2014arXiv1408.6694V/abstract]
- 28. Decoding the Fundamental Drivers of Phylodynamic Inference [https://pmc.ncbi.nlm.nih.gov/articles/PMC10284498/]
- 29. Viral Phylodynamics - PMC - PubMed Central - NIH [https://pmc.ncbi.nlm.nih.gov/articles/PMC3605911/]
- 30. [2311.09838] Bayesian Inference of Reproduction Number ... [https://arxiv.org/abs/2311.09838]
- 31. Online Bayesian Phylodynamic Inference in BEAST with ... [https://pmc.ncbi.nlm.nih.gov/articles/PMC7253210/]
- 32. A Bayesian phylodynamic inference framework for single-cell ... [https://pmc.ncbi.nlm.nih.gov/articles/PMC11867110/]
- 33. Bayesian phylodynamic inference of population dynamics ... [https://pmc.ncbi.nlm.nih.gov/articles/PMC12067208/]
- 34. BEAST X for Bayesian phylogenetic, phylogeographic and ... [https://www.nature.com/articles/s41592-025-02751-x]
- 35. Advances in approximate Bayesian inference for models in ... [https://www.sciencedirect.com/science/article/pii/S175543652500043X]
- 36. Phylogenetic and phylodynamic approaches to ... [https://www.nature.com/articles/s41576-022-00483-8]
- 37. Estimation of the basic reproduction number (R0) for ... [https://pmc.ncbi.nlm.nih.gov/articles/PMC7538841/]
- 38. Visualizing BEAST2 results in R [https://taming-the-beast.org/tutorials/Visualizing-BEAST2-results/]
- 39. Phylodynamic models [https://www.beast2.org/phylodynamic-models/]
- 40. Interacting with Nextstrain's phylogeographic visualisations [https://docs.nextstrain.org/en/latest/learn/interpret/interacting-with-nextstrain.html]
- 41. What is R0? [https://www.vaccinestoday.eu/stories/what-is-r0/]
- 42. and Spatial Connectivity Structure Reproduction ... Number Estimation [https://arxiv.org/html/2509.20034v1]
- 43. Estimated Burden of Influenza and Direct and Indirect ... [https://pmc.ncbi.nlm.nih.gov/articles/PMC12268489/]
- 44. Current Epidemic Trends (Based on R t ) for States [https://www.cdc.gov/cfa-modeling-and-forecasting/rt-estimates/index.html]
- 45. Practical considerations for measuring the effective reproductive ... [https://pmc.ncbi.nlm.nih.gov/articles/PMC7325187/]
- 46. The Stealth Pandemic of Escherichia coli Sequence Type ... [https://pmc.ncbi.nlm.nih.gov/articles/PMC7314120/]
- 47. Genomic epidemiology reveals geographical clustering of ... [https://www.nature.com/articles/s41467-024-45608-1]
- 48. Convergence of virulence and antimicrobial resistance in ... [https://www.nature.com/articles/s42003-022-03660-x]
- 49. Estimating the reproduction number and transmission ... [https://pmc.ncbi.nlm.nih.gov/articles/PMC11009662/]
- 50. Rapid and Specific Detection, Molecular Epidemiology ... [https://pmc.ncbi.nlm.nih.gov/articles/PMC3993632/]
- 51. Escherichia coli Sequence Type 131 as a Prominent Cause of ... [https://pmc.ncbi.nlm.nih.gov/articles/PMC3811657/]
- 52. Evaluation of presence of clone ST131 and biofilm ... [https://pmc.ncbi.nlm.nih.gov/articles/PMC10229391/]
- 53. Phylodynamic Analysis of Ebola Virus in the 2014 Sierra ... [https://pmc.ncbi.nlm.nih.gov/articles/PMC4399230/]
- 54. Phylodynamic assessment of intervention strategies for the ... [https://www.nature.com/articles/s41467-018-03763-2]
- 55. Quantifying the epidemic spread of Ebola virus (EBOV) in ... [https://pmc.ncbi.nlm.nih.gov/articles/PMC4601477/]
- 56. Molecular tools for studying HIV transmission in sexual networks [https://pmc.ncbi.nlm.nih.gov/articles/PMC4109889/]
- 57. Phylogenetic analysis of initial genomes from Kasai EBOV ... [https://virological.org/t/phylogenetic-analysis-of-initial-genomes-from-kasai-ebov-outbreak-8-september-2025/1004]
- 58. Deep-sequence phylogenetics to quantify patterns of HIV ... [https://elifesciences.org/articles/72657]
- 59. Phylogenetic and phylodynamic approaches to understanding ... [https://pmc.ncbi.nlm.nih.gov/articles/PMC9028907/]
- 60. Eight challenges in phylodynamic inference - PMC [https://pmc.ncbi.nlm.nih.gov/articles/PMC4383806/]
- 61. Assessing biases in phylodynamic inferences in the presence ... [https://veterinaryresearch.biomedcentral.com/articles/10.1186/s13567-019-0692-5]
- 62. Estimation of the basic reproduction number (𝑅0 ... [https://pmc.ncbi.nlm.nih.gov/articles/PMC7722950/]
- 63. Inference of R0 and Transmission Heterogeneity from the Size ... [https://journals.plos.org/ploscompbiol/article?id=10.1371/journal.pcbi.1002993]
- 64. Inference of transmission dynamics and retrospective ... [https://pmc.ncbi.nlm.nih.gov/articles/PMC10655980/]
- 65. Common misspecification of the generation interval leads ... [https://www.semanticscholar.org/paper/5b3cf0380fee32a3a578f8c51ed690023c895e67]
- 66. Robust phylodynamic inference and model specification for ... [https://pmc.ncbi.nlm.nih.gov/articles/PMC12344737/]
- 67. Robust phylodynamic inference and model specification for ... [https://pubmed.ncbi.nlm.nih.gov/40683077/]
- 68. Estimating the basic reproduction number at the beginning ... [https://pmc.ncbi.nlm.nih.gov/articles/PMC9205483/]
- 69. Estimating the basic reproduction number at the beginning of ... [https://journals.plos.org/plosone/article?id=10.1371/journal.pone.0269306]
- 70. Robust Phylodynamic Analysis of Genetic Sequencing ... [https://www.mdpi.com/1999-4915/14/8/1648]
- 71. How does date-rounding affect phylodynamic inference for ... [https://journals.plos.org/ploscompbiol/article?id=10.1371/journal.pcbi.1012900]
- 72. Consequences of recombination on traditional ... [https://pmc.ncbi.nlm.nih.gov/articles/PMC1461297/]
- 73. Whole genome phylogenies reflect the distributions of ... [https://elifesciences.org/articles/65366]
- 74. Impact of homologous recombination on core genome ... [https://bmcgenomics.biomedcentral.com/articles/10.1186/s12864-020-07262-x]
- 75. The phylodynamic threshold of measurably evolving populations [https://sciety-labs.elifesciences.org/articles/by?article_doi=10.1101/2025.07.07.663495]
- 76. key term - Scalability and Computational Complexity [https://fiveable.me/key-terms/introduction-cognitive-science/scalability-and-computational-complexity]
- 77. Scaling Machine Learning Models with Large Datasets and ... [https://www.sapien.io/blog/scaling-machine-learning-models-with-large-datasets-and-data-labeling]
- 78. Genomic reproducibility in the bioinformatics era [https://genomebiology.biomedcentral.com/articles/10.1186/s13059-024-03343-2]
- 79. Ten Simple Rules for Reproducible Computational Research [https://pmc.ncbi.nlm.nih.gov/articles/PMC3812051/]
- 80. Model design for non-parametric phylodynamic inference ... [https://pmc.ncbi.nlm.nih.gov/articles/PMC8382123/]
- 81. Evolutionary and epidemic dynamics of COVID-19 in Germany ... [https://pmc.ncbi.nlm.nih.gov/articles/PMC11898094/]
- 82. Evaluating a novel reproduction number estimation method [https://www.nature.com/articles/s41598-025-89203-w]
- 83. Comparison of methods to Estimate Basic Reproduction ... [https://pmc.ncbi.nlm.nih.gov/articles/PMC6670001/]
- 84. A new phylogenetic protocol: dealing with model ... [https://pmc.ncbi.nlm.nih.gov/articles/PMC7671319/]
- 85. Application of Phylodynamic Tools to Inform the Public Health ... [https://pmc.ncbi.nlm.nih.gov/articles/PMC10131930/]
- 86. Epidemiological hypothesis testing using a ... [https://www.nature.com/articles/s41467-020-19122-z]
- 87. The Impacts of Low Diversity Sequence Data on ... [https://www.mdpi.com/1999-4915/13/1/79]
- 88. Comparing the transmission potential from sequence and ... [https://www.sciencedirect.com/science/article/pii/S2468042723000106]
- 89. Eight challenges in phylodynamic inference [https://www.sciencedirect.com/science/article/pii/S1755436514000437]
- 90. Methods Single-cell phylodynamic inference of stem ... [https://www.sciencedirect.com/science/article/abs/pii/S2405471225000778]
- 91. Demystifying R Naught: Understanding What Does it Hide? [https://pmc.ncbi.nlm.nih.gov/articles/PMC8117892/]
- 92. A Comparative Analysis of Statistical Methods to Estimate ... [https://pubmed.ncbi.nlm.nih.gov/33079987/]
- 93. The R0 package: a toolbox to estimate reproduction numbers ... [https://bmcmedinformdecismak.biomedcentral.com/articles/10.1186/1472-6947-12-147]
- 94. Estimate of the Basic Reproduction Number for COVID-19 [https://www.jpmph.org/journal/view.php?doi=10.3961/jpmph.20.076]
- 95. How Herd Immunity Works | History of Vaccines [https://historyofvaccines.org/vaccines-101/what-do-vaccines-do/how-herd-immunity-works/]
- 96. Phylodynamics software [https://virological.org/t/phylodynamics-software/237]
- 97. Types of data requested to inform December 2025 COVID- ... [https://www.who.int/news/item/29-09-2025-types-of-data-requested-to-inform-december-2025-covid-19-vaccine-antigen-composition-deliberations]
- 98. The effect of herd immunity thresholds on willingness to ... [https://www.nature.com/articles/s41599-022-01257-7]
- 99. Toward Achieving a Vaccine-Derived Herd Immunity ... [https://pmc.ncbi.nlm.nih.gov/articles/PMC8343072/]
- 100. PFMG2025–integrating genomic medicine into the national ... [https://pmc.ncbi.nlm.nih.gov/articles/PMC11910791/]
- 101. Implementation Mapping to Identify Best Practices for ... [https://www.researchprotocols.org/2025/1/e73718]