Resolving Ambiguity: A Modern Framework for Classifying Antibiotic Resistance Genes in RND Efflux Pumps
Accurate classification of antibiotic resistance genes (ARGs) in Resistance-Nodulation-Division (RND) efflux pumps is critical for combating multidrug-resistant Gram-negative pathogens.
Resolving Ambiguity: A Modern Framework for Classifying Antibiotic Resistance Genes in RND Efflux Pumps
Abstract
Accurate classification of antibiotic resistance genes (ARGs) in Resistance-Nodulation-Division (RND) efflux pumps is critical for combating multidrug-resistant Gram-negative pathogens. This article provides a comprehensive resource for researchers and drug development professionals, addressing the persistent challenge of ambiguous ARG type classification. We explore the phylogenetic and structural roots of this ambiguity, review cutting-edge computational and experimental methods for precise identification, present strategies to overcome common classification pitfalls, and establish validation frameworks for comparative analysis. By synthesizing foundational knowledge with advanced methodological applications, this work aims to standardize classification practices and inform the development of efflux pump inhibitors.
The Roots of Ambiguity: Phylogenetic Overlap and Functional Redundancy in RND Families
Foundational Knowledge: The Three Primary RND Families
The Resistance-Nodulation-Division (RND) superfamily encompasses transporters found in all domains of life, but is particularly crucial for understanding multidrug and heavy metal resistance in Gram-negative bacteria [1] [2]. These transporters are defined by a characteristic protein fold and often form tripartite complexes that span the entire bacterial cell envelope [3]. Among these, three primary families are almost exclusively found in Gram-negative bacteria: the Heavy Metal Efflux (HME) family, the Hydrophobe/Amphiphile Efflux-1 (HAE-1) family, and the Nodulation Factor Exporter (NFE) family [4].
Table 1.1: Core Characteristics of the Three Primary RND Families
| Family | Primary Substrate | Key Functional Role | Prevalence in Gram-negative Bacteria |
|---|---|---|---|
| HME (Heavy Metal Efflux) | Metallic cations (e.g., Zn²⁺, Co²⁺, Ni²⁺, Cu⁺/Cu²⁺) [4] [1] | Detoxification, metal ion homeostasis [4] | Found in 21.8% of genomes studied [4] |
| HAE-1 (Hydrophobe/Amphiphile Efflux-1) | Organic molecules (antibiotics, bile salts, detergents, solvents) [4] [5] | Multidrug resistance, virulence, biofilm formation [6] [4] | Found in 41.8% of genomes studied; most abundant [4] |
| NFE (Nodulation Factor Exporter) | Lipooligosaccharides (nodulation factors), some drugs [4] [7] | Symbiotic nitrogen fixation (in plant-associated bacteria), some MDR phenotypes [4] | Phylogenetically overlaps with HAE-1; functional characterization is limited [4] |
Frequently Asked Questions (FAQs) & Troubleshooting
FAQ 2.1: During phylogenetic analysis, my RND permease sequence does not cleanly cluster into HAE-1 or NFE families. What is the basis for this ambiguity and how can I resolve it?
Answer: Ambiguous clustering between HAE-1 and NFE is a common challenge due to their close phylogenetic relationship [4]. The historical functional distinction (drug efflux vs. nodulation factor export) does not always align with phylogenetic clades, as some NFE family members are involved in multidrug resistance [4].
Troubleshooting Guide:
- Expanded Reference Set: Use a robust, curated set of reference sequences from the Transporter Classification Database (TCDB) for all three families (HAE-1, NFE, HME) to root your tree [4].
- Conserved Position Analysis: Perform a multiple sequence alignment and inspect conserved residues in transmembrane helix 4 (TM4), which is a key determinant of substrate specificity [1].
- Contextual Genomic Data: Check the genomic context. HAE-1 and HME genes are often located in operons with their corresponding membrane fusion protein (MFP) gene, which can provide additional clues [4] [7].
FAQ 2.2: What could explain the sudden, high-level resistance to a novel beta-lactam/beta-lactamase inhibitor (BL/BLI) in my clinical isolate, despite no acquisition of a known resistance gene?
Answer: Overexpression or mutation of chromosomal HAE-1 efflux pumps is an increasingly recognized mechanism of resistance to new BL/BLI combinations [8]. This resistance is often missed in clinical settings as there are no standard tests for efflux-mediated resistance.
Troubleshooting Guide:
- Check for Regulatory Mutations: Sequence the regulatory regions and genes of major HAE-1 pumps (e.g., mexAB-oprM in P. aeruginosa, acrAB in E. coli). Mutations in local repressors (e.g., acrR) or global regulators can lead to pump overexpression [9] [8].
- Look for Structural Mutations: Identify amino acid substitutions in the inner membrane pump (IMP) component (e.g., AcrB, MexB). Specific mutations in the substrate-binding pockets can significantly alter and often broaden the pump's substrate profile to include new drugs [6] [8].
- Efflux Inhibition Assay: Use an efflux pump inhibitor (EPI) like Phe-Arg-β-naphthylamide (PAβN) in combination with the antibiotic. A significant decrease (e.g., ≥4-fold) in the Minimum Inhibitory Concentration (MIC) in the presence of the EPI is strong evidence of efflux-mediated resistance [5].
FAQ 2.3: My gene knockout of an RND pump does not yield a hypersusceptibility phenotype against common antibiotics. Does this mean the pump is non-functional?
Answer: Not necessarily. Many Gram-negative bacteria possess multiple, often redundant, RND pumps with overlapping substrate specificities [4] [7]. The absence of one pump can be compensated for by the activity of another.
Troubleshooting Guide:
- Genome Inventory: Perform a comprehensive genomic inventory to identify all RND pump genes in your strain. Species like Burkholderia cenocepacia can have 16 or more RND genes [7].
- Create Multiple Knockouts: Generate double or triple knockout mutants to eliminate redundant pump functions. Phenotypes often become apparent only after the major contributing pumps are inactivated.
- Test Non-Antibiotic Substrates: The primary physiological role of these pumps may not be antibiotic resistance. Test susceptibility to other substrates like detergents (e.g., SDS), dyes (e.g., ethidium bromide), bile salts, or heavy metals, depending on whether it's a putative HAE-1 or HME pump [5] [9].
Experimental Protocols for Classification and Characterization
Protocol 3.1: Phylogenetic Classification of an RND Permease
This protocol outlines a bioinformatics pipeline for classifying a putative RND permease sequence into one of the three primary families.
- Objective: To determine the phylogenetic clade (HME, HAE-1, or NFE) of an uncharacterized RND permease.
Materials:
- Putative RND permease protein sequence(s).
- Curated set of reference RND sequences (e.g., from TCDB: HME: TC#2.A.6.1, HAE-1: TC#2.A.6.2, NFE: TC#2.A.6.3) [4].
- Sequence alignment software (e.g., Muscle, Clustal Omega).
- Phylogenetic inference software (e.g., IQ-TREE).
Method:
- Sequence Collection: Compile a dataset including your query sequence(s) and the reference sequences from HME, HAE-1, and NFE families.
- Multiple Sequence Alignment: Align the full-length protein sequences using a suitable algorithm. Refine the alignment by removing poorly aligned regions with a tool like Gblocks [4].
- Phylogenetic Tree Construction: Construct a Maximum Likelihood phylogenetic tree. Use model testing (e.g., in IQ-TREE) to find the best-fit evolutionary model (e.g., LG+F+R6) [4].
- Clade Assessment: Assess the placement of your query sequence. A sequence clustering with known HME references is classified as HME. The HAE-1 family, as recently proposed, may be restricted to two major sister clades that contain most multidrug resistance pumps [4].
Expected Outcome: A phylogenetic tree visualizing the evolutionary relationship of the query sequence to known RND families, allowing for its classification.
Troubleshooting: If the query sequence falls into a poorly resolved region between HAE-1 and NFE, refer to FAQ 2.1 for further steps.
Protocol 3.2: Functional Analysis of an HAE-1 Efflux Pump via Minimum Inhibitory Concentration (MIC) Profiling
This protocol describes how to determine the contribution of a specific HAE-1 pump to antibiotic resistance.
- Objective: To establish the antibiotic susceptibility profile conferred by a specific HAE-1 efflux pump.
Materials:
Method:
- Strain Preparation: Grow wild-type and mutant strains to the appropriate growth phase (typically mid-log phase).
- Broth Microdilution: Perform standard broth microdilution according to CLSI guidelines. Prepare a 2-fold serial dilution of each antibiotic in CAMHB in a microtiter plate.
- Inoculation: Inoculate each well with a standardized suspension of bacteria (~5 × 10⁵ CFU/mL).
- Incubation and Reading: Incubate the plates at 35°C for 16-20 hours. The MIC is the lowest concentration of antibiotic that completely inhibits visible growth.
- Data Analysis: Compare the MIC values of the wild-type and mutant strains. A significant increase (e.g., ≥4-fold) in the MIC for the wild-type strain indicates the pump contributes to resistance against that antibiotic [9].
Expected Outcome: A table of MIC values identifying the specific antibiotics extruded by the HAE-1 pump under investigation.
Troubleshooting: If no phenotype is observed, consider creating a knockout in a different genetic background or generating a multi-pump knockout mutant (see FAQ 2.3).
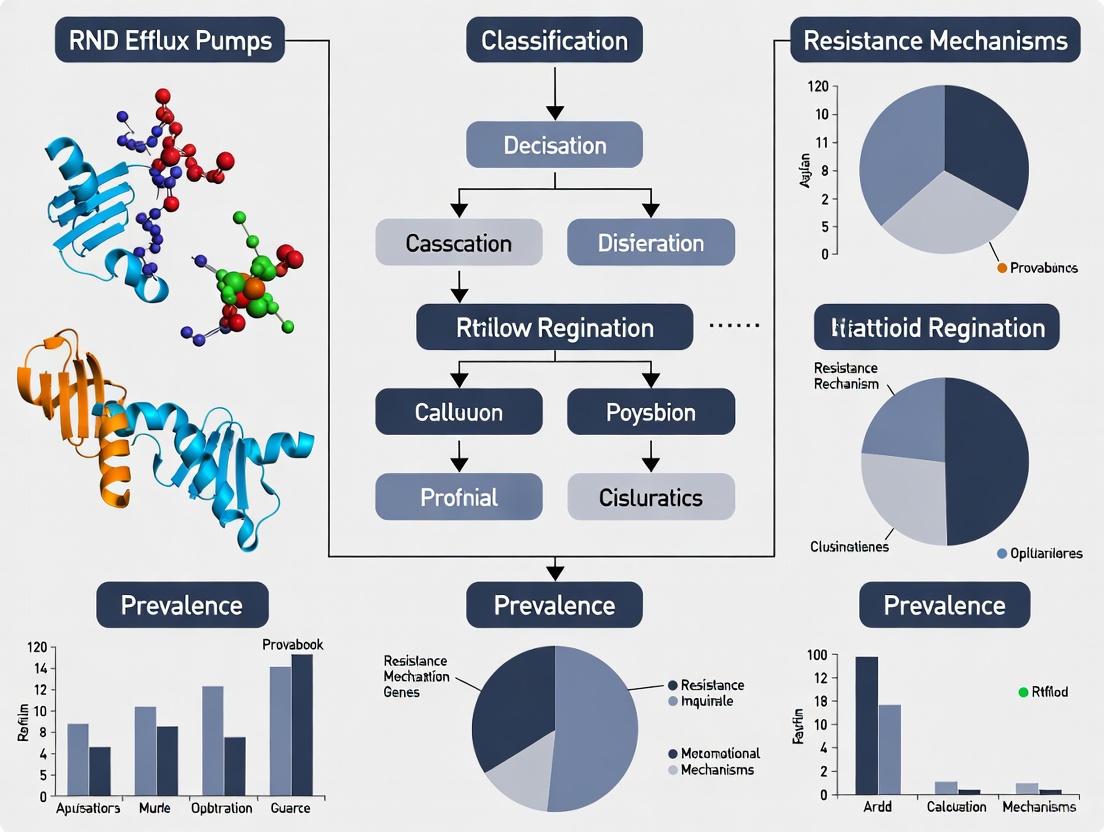
Visual Guide to RND Pump Phylogeny and Functional Analysis
The following diagram illustrates the phylogenetic relationships between the primary RND families and a logical workflow for characterizing a novel RND permease, integrating both phylogenetic and experimental data to resolve classification ambiguities.
Diagram 4.1: A workflow for the phylogenetic classification and functional validation of RND permeases.
The Scientist's Toolkit: Essential Research Reagents
Table 5.1: Key Reagents for Studying RND Efflux Pumps
| Reagent / Material | Function / Application | Example(s) / Notes |
|---|---|---|
| Phe-Arg-β-naphthylamide (PAβN) | Broad-spectrum efflux pump inhibitor (EPI). Used in combination assays to confirm efflux-mediated resistance [5]. | Reduces MIC of antibiotics in strains with overactive HAE-1 pumps. Chemical structure: Phenylalanyl-arginyl-β-naphthylamide. |
| Antibiotic Panels | For determining substrate specificity and MIC profiles of HAE-1 pumps [5] [9]. | Should include β-lactams, fluoroquinolones, macrolides, tetracyclines, chloramphenicol, novobiocin. |
| Heavy Metal Salts | For determining substrate specificity of HME pumps and inducing their expression [4] [1]. | Use salts of ZnCl₂, CoCl₂, NiCl₂, CuSO₄. Prepare fresh stock solutions. |
| Ethidium Bromide | Fluorescent substrate for many HAE-1 pumps. Used in real-time efflux assays [6] [9]. | Efflux can be measured as a decrease in intracellular fluorescence over time. |
| TCDB Reference Sequences | Curated set of protein sequences for rooting phylogenetic trees and family classification [4]. | Access via Transport Classification Database (TCDB.org). Essential for HME (2.A.6.1), HAE-1 (2.A.6.2), NFE (2.A.6.3). |
| Isogenic Mutant Strains | Genetically engineered strains (e.g., gene knockouts) for comparative phenotypic studies [9] [8]. | Critical for controlling genetic background and proving a pump's specific function. |
Phylogenetic Analysis Revealing Clade Overlap Between HAE-1 and NFE Families
FAQs & Troubleshooting Guide
This guide addresses common challenges in the phylogenetic analysis of Resistance-Nodulation-Division (RND) efflux pumps, specifically focusing on resolving ambiguous Antimicrobial Resistance Gene (ARG) type classification between the HAE-1 and NFE families.
FAQ 1: What causes the ambiguous phylogenetic positioning between HAE-1 and NFE families, and how can it be resolved?
Answer: The ambiguous phylogenetic positioning between HAE-1 and NFE families stems from their close evolutionary relationship and overlapping functional characteristics. A comprehensive phylogenetic study reveals that while the Heavy Metal Efflux (HME) family forms a single distinct clade, the HAE-1 and NFE families have overlapping distributions among clades, making clear demarcation challenging [4].
Troubleshooting Steps:
- Implement Robust Phylogenetic Frameworks: Use the redefined phylogenetic clades proposed in recent studies. It is recommended to restrict the HAE-1 family to two phylogenetic sister clades that encompass most RND pumps involved in multidrug resistance. The remaining clades that do not fit this definition may represent the NFE family or other proposed groups like HAE-4 [4].
- Verify with Reference Sequences: Always include TCDB (Transporter Classification Database) reference sequences (TC #2.A.6.1, #2.A.6.2, #2.A.6.3) in your alignment to anchor your analysis to established families [4].
- Check Functional Data: Correlate phylogenetic clustering with known functional data. For instance, confirm if a cluster with ambiguous positioning includes pumps experimentally validated to export lipooligosaccharides (an NFE function) or a broad range of antibiotics (an HAE-1 function) [4].
FAQ 2: How should I handle a gene sequence that phylogenetically clusters with HAE-1 but has predicted metal efflux function?
Answer: This scenario highlights the limitation of relying solely on phylogenetic position for functional prediction.
Troubleshooting Steps:
- Re-analyze the Alignment: Ensure your multiple sequence alignment is robust. Use tools like Muscle or Clustal Omega and eliminate poorly aligned positions with GBlocks to improve phylogenetic signal [4].
- Confirm Functional Prediction: Use complementary methods to validate the metal efflux function, such as:
- Promoter and Operon Analysis: Check if the gene is co-localized with genes encoding heavy metal homeostasis proteins.
- In vitro Functional Assays: Test susceptibility to heavy metals like copper or zinc in knockout strains.
- Gene Context: Analyze the genomic neighborhood for other signatures of metal resistance islands [4].
- Consider Subfunctionalization: The gene may be the result of a duplication event followed by subfunctionalization, where a pump has acquired a new substrate specificity while retaining its phylogenetic heritage [4].
FAQ 3: My phylogenetic tree has low bootstrap support for key clades separating HAE-1 and NFE. How can I improve confidence?
Answer: Low bootstrap values indicate uncertainty in the evolutionary relationships, which is a known issue in this specific area of research [4].
Troubleshooting Steps:
- Optimize Phylogenetic Modeling: Use Maximum Likelihood methods with a model that best fits your data. For RND permeases, the LG+F+R6 model has been selected as the best-fit model in recent analyses. Use ultrafast bootstrapping (e.g., 1000 samples) to assess branch support [4].
- Increase Informative Sites: The use of a full-length multiple sequence alignment of the RND permease subunit (after removing poorly aligned positions) is critical, as this subunit determines substrate specificity. A study using 265 aligned amino acid positions from 6205 protein sequences provided a solid foundation for clade distinction [4].
- Evaluate Tree Topology: Perform tree topology tests to statistically evaluate the incongruence of polyphyletic groups and determine the most likely tree structure [4].
Experimental Protocols for Resolving Ambiguous Classifications
Protocol 1: Comprehensive Phylogenetic Pipeline for RND Permease Classification
This methodology is derived from a 2024 phylogenetic and ecological study of RND permeases [4].
1. Sequence Curation and Alignment
- Input Data: Start with a set of protein sequences for RND permeases. These can be obtained from public databases (e.g., UniProt) or from your own genomes.
- Reference Sequences: Include TCDB reference sequences for HME (TC #2.A.6.1), HAE-1 (TC #2.A.6.2), and NFE (TC #2.A.6.3) to root the analysis.
- Alignment Tool: Use Muscle (v3.8.31) or Clustal Omega (v1.2.1) with default parameters.
- Alignment Refinement: Use Gblocks (v0.91b) with default settings to eliminate poorly aligned positions and potential outliers.
2. Phylogenetic Reconstruction
- Software: Perform Maximum Likelihood tree reconstruction using IQ-TREE (v1.6.5).
- Model Selection: Allow the software to determine the best-fitted model according to the Bayesian Information Criterion (BIC). The LG+F+R6 model is a known good fit for this data.
- Branch Support: Use ultrafast bootstrapping with 1000 replicates to assign confidence values to the tree nodes.
- Topology Testing: Use the "tree topology test" option in IQ-TREE to evaluate the statistical significance of conflicting clade arrangements.
3. Clade Designation and Validation
- Clade Assignment: Assign sequences to HME, HAE-1, or NFE families based on their clustering with the TCDB reference sequences and the proposed revised clades from recent literature.
- Ecological Correlation: Validate the classification by checking for correlations with ecological metadata (e.g., HME abundance in metal-contaminated environments, HAE-1 abundance in the rhizosphere) [4].
Protocol 2: In silico Validation of Efflux Pump Function
1. Genomic Context Analysis
- Objective: Identify the operon structure of the RND pump gene to support functional prediction.
- Method: Examine the genes located upstream and downstream of the RND permease gene. A tripartite RND efflux system is typically encoded by genes for the RND permease, a membrane fusion protein (MFP), and an outer membrane factor (OMF), often in an operon [9].
- Tools: Use genome browsers in databases like NCBI or specialized databases like The Transporter Database (www.membranetransport.org).
2. Homology Modeling of Substrate Binding
- Objective: Predict if the pump is likely to bind antibiotics (HAE-1) or other substrates (NFE).
- Method: Use the protein sequence of the RND permease to create a 3D homology model based on crystal structures of known pumps (e.g., AcrB from E. coli). Analyze the substrate-binding pockets for key residues that determine specificity [8].
Table 1: Distribution and Characteristics of Primary RND Efflux Pump Families in Gram-Negative Bacteria
| RND Family | Primary Function | % of All RND Pumps | Average per Genome | Phylogenetic Distinctness | Common Ecological Niche |
|---|---|---|---|---|---|
| HME (Heavy Metal Efflux) | Metal cation export | 21.8% | ~1.5 | Forms a single, distinct clade | Metal-contaminated environments [4] |
| HAE-1 (Hydrophobe/Amphiphile Efflux-1) | Multidrug resistance; export of antibiotics, solvents, detergents | 41.8% | ~2.8 | Two primary sister clades; overlaps with NFE | Rhizosphere; clinical settings [4] |
| NFE (Nodulation Factor Exporter) | Putative lipooligosaccharide export; some MDR | Not Specified | Not Specified | Ambiguous and overlapping with HAE-1 | Not Specified [4] |
| HAE-4 (Newly Proposed) | Not fully characterized | Not Specified | Not Specified | Phylogenetically distinct | Predominant in marine environments [4] |
Note: Data summarized from an analysis of 6205 RND permease genes from 920 representative Gram-negative genomes [4]. MDR: Multidrug Resistance.
The Scientist's Toolkit: Research Reagent Solutions
Table 2: Essential Materials for RND Efflux Pump Phylogenetic and Functional Analysis
| Item/Category | Specific Example | Function/Application |
|---|---|---|
| Bioinformatics Software | IQ-TREE, Muscle/Clustal Omega, Gblocks | Phylogenetic reconstruction, multiple sequence alignment, and alignment refinement [4]. |
| Reference Database | Transporter Classification Database (TCDB) | Provides curated reference sequences for HME, HAE-1, and NFE families to anchor phylogenetic trees [4]. |
| Genomic Database | UniProt (Reference Proteomes), NCBI Genome | Source for retrieving RND permease protein sequences from a wide range of Gram-negative bacteria [4]. |
| Model Organism | Escherichia coli (e.g., K-12 strains) | Well-characterized model for genetic studies on RND pumps (e.g., AcrAB-TolC, MdtAB, CusCFBA) [9]. |
| Efflux Pump Inhibitor | Phe-Arg β-naphthylamide (PAβN) | Chemical agent used in functional assays to inhibit RND pumps and confirm efflux-mediated resistance phenotypes [9]. |
Visualization of Phylogenetic Analysis Workflow
The following diagram illustrates the logical workflow and key decision points for resolving ambiguous RND efflux pump classifications.
Phylogenetic Classification Workflow
Advanced Troubleshooting: Addressing Specific Experimental Issues
FAQ 4: During sequence retrieval, my BLASTp search returns sequences that are too short or too divergent. What filters should I apply?
Answer: Applying stringent filters during the initial sequence curation phase is crucial for a high-quality phylogenetic analysis [4].
Troubleshooting Steps:
- Set E-value Threshold: Use an e-value cutoff of <10⁻⁴ to include only significant hits.
- Apply Alignment Coverage Filter: Discard hits where the alignment covers less than 80% of the query sequence.
- Set Minimum Length Filter: A critical step is to discard protein sequences shorter than 852 amino acids, which is approximately 80% of the average length of a typical RND permease reference sequence [4].
FAQ 5: How can I distinguish between a true HAE-1 pump and a member of the proposed HAE-4 family?
Answer: The HAE-4 family has been proposed based on its distinct phylogenetic signature and ecological preference [4].
Troubleshooting Steps:
- Phylogenetic Position: Ensure your tree includes sequences from marine bacteria. HAE-4 permeases will form a clade that is phylogenetically separate from the primary HAE-1 and HME families.
- Ecological Source: Check the source of the genome. If the gene comes from a marine strain, it has a higher probability of belonging to the HAE-4 family.
- Functional Deferral: In the absence of experimental data, classify a pump as "putative HAE-4" based on phylogeny and ecology, noting that its exact substrate profile may not yet be known.
Frequently Asked Questions (FAQs)
What does "functional promiscuity" mean in the context of RND efflux pumps? Functional promiscuity refers to the ability of a single Resistance-Nodulation-Division (RND) efflux pump to recognize, bind, and transport a vast spectrum of structurally unrelated antibiotics and other toxic compounds. Unlike specific resistance enzymes, a single promiscuous pump like AcrB from E. coli or AdeB from A. baumannii can confer resistance to multiple drug classes simultaneously, including β-lactams, fluoroquinolones, tetracyclines, macrolides, chloramphenicol, and even dyes and detergents [10] [9] [11].
What is the molecular basis for this broad substrate recognition? The broad substrate range is enabled by large, flexible binding pockets within the pump's periplasmic domain. These pockets do not rely on precise, lock-and-key interactions but instead can accommodate diverse chemicals through hydrophobic interactions and van der Waals forces. High-resolution structures reveal that substrates bind to different regions or in different orientations within the same large binding pocket [10] [11]. A key feature is the "hydrophobic trap" in the deep binding pocket, which can interact with various aromatic and hydrophobic groups common to many antibiotics [10].
My data shows a discrepancy between genotypic prediction and phenotypic resistance for an RND pump. What could be the cause? This ambiguity is a common experimental challenge and can arise from several factors:
- Regulatory Mutations: Overexpression of the efflux pump due to mutations in local repressors (e.g., acrR, mexR) or global regulators (e.g., marA, soxS, ramA) can dramatically increase resistance levels without any change in the pump's amino acid sequence [12] [9] [8].
- Silent Mutations or Missense Mutations in Non-Binding Regions: Sequence variations may not affect the pump's function if they are silent or located in regions not critical for substrate binding or energy transduction.
- Co-existing Resistance Mechanisms: The observed resistance phenotype may be the result of a combined effect of efflux with other mechanisms like enzymatic inactivation (e.g., β-lactamases) or reduced permeability (porin loss) [8]. Disentangling the contribution of efflux requires specific experimental approaches.
How can I experimentally confirm that a specific RND pump is responsible for the observed resistance phenotype? A combination of genetic and pharmacological tools is required:
- Genetic Knockout/Deletion: Construct a deletion mutant of the pump gene (e.g., ΔacrB) and compare its Minimum Inhibitory Concentration (MIC) for various antibiotics to the wild-type strain. A significant reduction (e.g., 4 to 8-fold decrease) in MIC for multiple drugs strongly implicates the pump [13] [14].
- Controlled Overexpression: Clone the pump genes into an expression plasmid and introduce them into a susceptible background. A significant increase in MICs confirms the pump's ability to confer resistance.
- Use of Efflux Pump Inhibitors (EPIs): Use chemical EPIs like PAβN or CCCP in combination with antibiotics. A significant reduction in the MIC in the presence of the inhibitor indicates active efflux. Note: The specificity and toxicity of available EPIs can be a limitation [11].
Troubleshooting Common Experimental Problems
Problem 1: Inconsistent MIC Reductions in Knockout Strains
| Symptom | Possible Cause | Solution |
|---|---|---|
| Small or no MIC change in knockout mutant for a known substrate. | 1. Functional redundancy from other RND pumps.2. Overexpression of a different efflux pump compensating for the loss.3. The antibiotic is a poor substrate for the targeted pump. | 1. Create double or triple knockout mutants of redundant pumps (e.g., ΔacrB ΔacrD ΔacrF).2. Check the expression levels of other major pumps in your knockout background via qPCR or RNA-seq.3. Consult the literature for robust positive control substrates (e.g., ethidium bromide, novobiocin) to validate your assay [10] [11]. |
| The knockout strain is not viable or has severe growth defects. | The targeted RND pump is essential for the extrusion of natural metabolites or bile salts, impacting fitness in vivo [12]. | Use a conditional knockout (e.g., Cre-lox) or inducible promoter system to control pump expression. Alternatively, use an EPI in the wild-type strain as an alternative approach. |
Problem 2: Difficulty in Linking a Specific Mutation to a Resistance Phenotype
| Symptom | Possible Cause | Solution |
|---|---|---|
| A mutation is found in an RND pump gene, but its functional significance is unknown. | The mutation could be a neutral polymorphism, or it could affect substrate specificity or pump assembly. | 1. Genetic Reconstruction: Introduce the specific mutation into a clean, susceptible background (e.g., lab strain) and measure MICs. This isolates the effect of the mutation [13] [8].2. Molecular Docking: If the mutation is in the periplasmic domain, use available high-resolution structures (e.g., PDB: 4DX5 for AcrB) to model its potential impact on substrate binding pockets [10]. |
Problem 3: Challenges in Detecting Efflux Activity in Clinical Isolates
| Symptom | Possible Cause | Solution |
|---|---|---|
| An EPI reduces the MIC of an antibiotic, but you cannot identify a mutation in known pump genes or regulators. | 1. Mutation is in an uncharacterized regulator.2. The EPI has non-specific effects on membrane energetics.3. A novel, uncharacterized efflux pump is involved. | 1. Use whole-genome sequencing and look for mutations in intergenic regions or genes of unknown function.2. Use a combination of EPIs with different mechanisms to confirm the result.3. Perform RNA-seq to identify all overexpressed genes in the resistant isolate compared to a susceptible one [8]. |
Key Experimental Protocols & Data
Protocol 1: Verifying Efflux Pump Function via MIC Reduction Assay
Principle: This assay tests whether a chemical inhibitor restores susceptibility to an antibiotic by blocking the efflux pump.
Materials:
- Cation-adjusted Mueller-Hinton Broth (CAMHB)
- Antibiotic stock solutions
- Efflux Pump Inhibitor (e.g., PAβN at 20-50 mg/L; CCCP at 10-20 μM)
- Sterile 96-well microtiter plates
- Bacterial overnight culture
Method:
- Prepare a dilution series of the antibiotic in CAMHB in a 96-well plate, covering a range from below to above the expected MIC.
- To the test wells, add the EPI at a sub-inhibitory concentration.
- Normalize the bacterial inoculum to ~5 × 10^5 CFU/mL and add to each well.
- Include controls: growth control (no antibiotic), antibiotic alone, EPI alone.
- Incubate at 35±2°C for 16-20 hours.
- The MIC is the lowest concentration of antibiotic that completely inhibits visible growth. A ≥4-fold reduction in MIC in the presence of the EPI is considered a positive result for efflux activity [11].
Protocol 2: Genetic Complementation Test
Principle: This test confirms that a specific RND pump gene is responsible for the resistance phenotype by reintroducing the gene into a deficient strain and restoring resistance.
Materials:
- Susceptible strain (e.g., knockout mutant or laboratory strain with low intrinsic efflux)
- Cloning vector with an inducible promoter (e.g., pBAD, pET)
- DNA of the target RND pump gene
Method:
- Clone the intact RND pump gene into the expression vector.
- Transform the construct into the susceptible host strain.
- Plate the transformed cells on agar plates containing the inducing agent (e.g., arabinose for pBAD) and a selective concentration of the antibiotic of interest.
- The restoration of growth in the presence of the antibiotic, only when the pump gene is induced, provides direct evidence of its function [14].
Quantitative Data on RND Pump Substrate Profiles
Table 1: Substrate Spectrum of Characterized RND Efflux Pumps
| Organism | RND Pump | Representative Substrate Classes | Key References |
|---|---|---|---|
| Escherichia coli | AcrAB-TolC | β-lactams, Fluoroquinolones, Tetracyclines, Chloramphenicol, Macrolides, Rifampicin, Dyes, Bile Salts [9] [11] | [9] [11] |
| Acinetobacter baumannii | AdeABC | Aminoglycosides*, Carbapenems, Tetracyclines (Tigecycline), Fluoroquinolones, Chloramphenicol [10] | [10] |
| Pseudomonas aeruginosa | MexAB-OprM | β-lactams, Fluoroquinolones, Sulfonamides, Trimethoprim, Chloramphenicol [8] | [8] |
| Pseudomonas aeruginosa | MexXY-OprM | Aminoglycosides, Tetracyclines, Macrolides, Fluoroquinolones [8] | [8] |
Note: The role of AdeABC in aminoglycoside resistance is debated and may be context-dependent [10].
Structural Insights into Promiscuity
Table 2: Key Structural Features Enabling Substrate Promiscuity in AcrB
| Feature | Description | Role in Promiscuity |
|---|---|---|
| Access Pocket (AP) | A shallow, hydrophobic pocket in the "L" (loose) protomer that captures substrates from the periplasm or outer membrane leaflet [10]. | Provides the initial binding site for a wide variety of compounds. |
| Deep Binding Pocket (DBP) | A constricted, hydrophobic region in the "T" (tight) protomer where substrates are trapped before extrusion [10] [11]. | The "hydrophobic trap" allows binding of diverse molecules via non-specific interactions. |
| Switch Loop (G-loop) | A flexible loop (residues 614-621 in AcrB) between the AP and DBP [11]. | Its flexibility allows the pump to accommodate and transport substrates of different sizes and structures. Mutations here can affect substrate specificity. |
| Functional Rotation | The three protomers of the trimer cycle consecutively through L, T, and O (open) conformations [10] [11]. | Ensures continuous binding and extrusion, allowing a single trimer to handle multiple substrates efficiently. |
Signaling Pathways & Experimental Workflows
Diagram: The Functional Rotation Mechanism of RND Pumps
Diagram Title: Conformational Cycling in RND Pump Transport
This diagram illustrates the concerted conformational changes in the AcrB trimer during the efflux cycle. The "L" protomer captures substrates from the periplasm. It then transitions to the "T" state, where the substrate is trapped in the deep binding pocket. Finally, it shifts to the "O" conformation, which is closed to the periplasm but open to the exit funnel, leading to substrate extrusion. The energy for this process is coupled to proton import from the extracellular space [10] [11].
Diagram: Experimental Workflow for Characterizing a Novel RND Pump
Diagram Title: Workflow for RND Pump Functional Analysis
This workflow outlines a logical approach to resolve ambiguous ARG classification. It begins with observing a resistance phenotype and genotype, then uses functional assays to confirm active efflux, followed by genetic experiments to pinpoint the specific pump responsible, and finally proceeds to in-depth mechanistic studies.
The Scientist's Toolkit: Essential Research Reagents
Table 3: Key Reagents for Studying RND Efflux Pumps
| Reagent / Material | Function in Research | Example Use Case |
|---|---|---|
| PAβN (Phe-Arg-β-naphthylamide) | Broad-spectrum efflux pump inhibitor; competes with substrates for binding sites [11]. | Used in MIC reduction assays to provide pharmacological evidence of efflux activity. |
| CCCP (Carbonyl cyanide m-chlorophenyl hydrazone) | Protonophore that dissipates the proton motive force (PMF) [9]. | Used to confirm that an RND pump is PMF-dependent by de-energizing the membrane and inhibiting efflux. |
| Ethidium Bromide | A fluorescent substrate for many RND pumps [10] [11]. | Used in real-time fluorometric assays to measure kinetic efflux activity (e.g., in a spectrophotometer). |
| Salipro Nanodiscs | A membrane scaffold system that provides a native-like lipid environment for membrane proteins [10]. | Used for stabilizing RND pumps like AdeB for structural studies (e.g., Cryo-EM). |
| pET / pBAD Vectors | Cloning vectors with strong, inducible promoters. | Used for the overexpression and purification of RND pumps or for genetic complementation tests. |
The Tripartite Complex Architecture and its Role in Substrate Specificity
Resistance-Nodulation-cell Division (RND) efflux pumps are formidable tripartite complexes in Gram-negative bacteria that confer multidrug resistance (MDR) by extruding antibiotics from the cell [6]. For researchers investigating antibiotic resistance genes (ARGs), a significant classification challenge arises from the polyspecific nature of these transporters—their ability to recognize and export diverse, structurally unrelated compounds [6] [15]. This polyspecificity, while evolutionarily advantageous for bacterial survival, creates substantial ambiguity in bioinformatic analyses and functional studies.
A documented case of this ambiguity involves the misclassification of MexF sequences as adeF in the Comprehensive Antibiotic Resistance Database (CARD) [15]. This occurs because the curated BLAST bit-score threshold for MexF (2200) is much higher than for adeF (750), causing genuine MexF sequences that fail to meet their own stringent threshold to be assigned to adeF if they surpass its lower cutoff [15]. This specific example underscores a broader issue: classification models that rely on single ARG-type thresholds can produce results incoherent with BLAST homology relationships, potentially leading to false positives and false negatives in ARG identification [15].
Frequently Asked Questions (FAQs)
What is the basic architecture of a tripartite RND efflux pump? The canonical RND efflux pump spans the entire cell envelope of Gram-negative bacteria, comprising three essential components [6] [16]:
- Inner Membrane Protein (IMP/RND permease): A trimeric transporter (e.g., AcrB, MexB) embedded in the inner membrane. It is responsible for substrate recognition and uses the proton motive force to power export [6].
- Periplasmic Adaptor Protein (PAP/MFP): A membrane fusion protein (e.g., AcrA, MexA) that forms a hexameric duct in the periplasm, structurally and functionally linking the IMP to the OMP [6] [16] [17].
- Outer Membrane Protein (OMP/OMF): A trimeric channel (e.g., TolC, OprM) that forms a conduit through the outer membrane, allowing substrates to be expelled to the extracellular environment [6] [16].
Why is determining the structure of the full tripartite complex so challenging? The functional complex spans two different biological membranes (inner and outer) and the periplasmic space, creating technical difficulties for purification and structural studies [16]. The interactions between components can be dynamic and of low affinity, making it difficult to isolate a stable, native complex for analysis [16] [17].
What are the key experimental strategies for studying tripartite assembly? Advanced reconstitution techniques have been pivotal. A key protocol involves:
- Nanodisc Reconstitution: Separately inserting the IMP (e.g., MexB) and OMP (e.g., OprM) into membrane-like lipid nanodiscs of controlled sizes using membrane scaffold proteins (MSPs) like MSP1D1 or MSP1E3D1 [16].
- Complex Formation: Mixing the IMP-nanodisc, OMP-nanodisc, and native lipidated MFP (e.g., MexA) in a defined molar ratio (e.g., 1:1:10) [16].
- Visualization and Validation: Using techniques like native PAGE (to observe electrophoretic mobility shifts) and single-particle electron microscopy to visualize the fully assembled, native-like complex [16].
Troubleshooting Common Experimental Issues
Problem: Inconsistent Results in Efflux Pump Assembly Studies
| Potential Cause | Diagnostic Signs | Recommended Solution |
|---|---|---|
| Unstable protein-protein interactions | Inability to isolate intact complex; dissociation during purification [16]. | Use cross-linkers or genetic fusion constructs (e.g., AcrB-AcrA fusions) to stabilize transient interactions for structural studies [16] [17]. |
| Non-native detergent environment | Loss of activity; improper complex formation [16]. | Reconstitute components into a more physiologically relevant environment like lipid nanodiscs to preserve native structure and function [16]. |
| Incorrect component stoichiometry | Formation of incomplete or non-functional complexes [16]. | Optimize molar ratios during reconstitution (e.g., a 1:1:10 ratio of IMP-ND:OMP-ND:MFP was successful for MexAB-OprM) [16]. |
Problem: Ambiguous ARG Type Classification from Genomic Data
| Potential Cause | Diagnostic Signs | Recommended Solution |
|---|---|---|
| Incoherence with BLAST homology | The best BLAST hit for a query sequence is ARG type A, but the classification model assigns it to type B [15]. | Manually verify classifications where the bit score is close to the threshold. Implement an optimized model that considers homology to all ARG types, not just a single threshold [15]. |
| Overlapping homology in RND families | Sequences from one RND pump type (e.g., MexF) are consistently classified as another (e.g., adeF) [15]. | Be aware of phylogenetically close sub-families. Use multiple databases and, if possible, experimental validation to confirm gene identity and function. |
| Use of non-specific bit-score thresholds | High rates of false positives/negatives for specific ARG types [15]. | Calculate and utilize FN-ratio and Coherence-ratio to quantify ambiguity in your dataset and refine decision boundaries [15]. |
Key Research Reagent Solutions
Essential materials and reagents for studying RND efflux pump assembly and function are summarized in the table below.
Table: Essential Research Reagents for Tripartite Efflux Pump Studies
| Reagent / Material | Function / Application | Key Consideration |
|---|---|---|
| Lipid Nanodiscs | Provides a native-like lipid bilayer environment to reconstitute and stabilize individual pump components and the full complex [16]. | Choose MSP scaffold protein (e.g., MSP1D1, MSP1E3D1) based on the size of the transmembrane domain of your target protein [16]. |
| Membrane Scaffold Proteins (MSPs) | Encapsulates a lipid patch to form a nanodisc. Different MSP variants control the nanodisc's diameter [16]. | MSP1D1 creates ~10nm discs for OprM; MSP1E3D1 creates larger ~12-14nm discs for MexB [16]. |
| Cross-linking Agents | Stabilizes weak or transient interactions within the tripartite complex, enabling structural analysis [16]. | Can be used to trap the complex in a defined state; may be combined with fusion protein strategies [17]. |
| Genetic Fusion Constructs | Creates covalent links between components (e.g., AcrB-AcrA) to facilitate the formation and isolation of a stable complex [17]. | Validated by checking if the fusion protein retains efflux activity in functional assays [17]. |
Experimental Protocol: Reconstituting a Tripartite RND Efflux Pump in Nanodiscs
This protocol, adapted from, details the reconstitution of a native tripartite efflux pump complex for structural and functional analysis [16].
Objective: To assemble a functional tripartite complex (e.g., MexAB-OprM or AcrAB-TolC) from individually purified components in a lipid nanodisc environment.
Materials:
- Purified inner membrane protein (IMP: MexB, AcrB)
- Purified outer membrane protein (OMP: OprM, TolC)
- Purified, natively lipidated membrane fusion protein (MFP: MexA, AcrA)
- Lipids (e.g., POPC - 1-palmitoyl-2-oleoyl-sn-glycero-3-phosphocholine)
- Membrane scaffold proteins (MSP1D1, MSP1E3D1)
- Detergent (e.g., sodium cholate)
- Size-exclusion chromatography (SEC) columns
- Materials for native PAGE and electron microscopy
Procedure:
- Prepare IMP-Nanodiscs: Reconstitute the IMP (e.g., MexB) into nanodiscs using MSP1E3D1 and POPC lipids at a optimized molar ratio (e.g., MSP1E3D1 : Lipid : MexB = 1 : 27 : 1). Remove detergent to initiate nanodisc formation [16].
- Prepare OMP-Nanodiscs: Reconstitute the OMP (e.g., OprM) into separate nanodiscs using MSP1D1 and POPC at a different molar ratio (e.g., MSP1D1 : Lipid : OprM = 1 : 36 : 0.4) to ensure single-molecule insertion [16].
- Form the Tripartite Complex: Combine the IMP-nanodisc, OMP-nanodisc, and lipidated MFP (e.g., MexA) in a defined molar ratio (e.g., 1 : 1 : 10). Incubate to allow complex assembly [16].
- Purify the Assembled Complex: Use size-exclusion chromatography to isolate the fully assembled complex from individual components.
- Validate Assembly:
- Native PAGE: A successful assembly is indicated by a distinct band with reduced electrophoretic mobility compared to the individual nanodisc components [16].
- Electron Microscopy: Perform negative-stain EM and single-particle analysis to visualize the elongated, ~33 nm structure of the fully assembled complex, confirming the connection of the IMP and OMP via the MFP adaptor [16].
Visualizing the Tripartite Assembly and Classification Workflow
The following diagrams illustrate the core architecture of the efflux pump and the analytical workflow for addressing ARG classification ambiguity.
Diagram 1: Tripartite RND Efflux Pump Architecture. The model shows the IMP and OMP connected solely via the PAP, forming a continuous duct across the cell envelope, with no direct contact between the membrane components [16] [17].
Diagram 2: Troubleshooting ARG Classification Ambiguity. This workflow helps identify and resolve classification errors that arise from relying on a single ARG-type threshold, which can be incoherent with overall BLAST homology [15].
Frequently Asked Questions (FAQs)
Q1: What is an operon and why is its structure important in bacterial genetics?
An operon is a functioning unit of DNA containing a cluster of genes under the control of a single promoter [18]. This structure allows for the coordinated expression of genes, meaning the genes are transcribed together into a single mRNA strand and are either all expressed or not expressed at all [18] [19]. The classic operon consists of several key components:
- Promoter: A nucleotide sequence where RNA polymerase binds to initiate transcription [18].
- Operator: A segment of DNA to which a repressor protein can bind, physically obstructing RNA polymerase and preventing transcription [18] [19].
- Structural Genes: The genes that are co-regulated by the operon and code for proteins [18].
This organization is crucial for the efficient regulation of metabolic pathways and rapid response to environmental changes.
Q2: How does Horizontal Gene Transfer (HGT) complicate the classification of Antibiotic Resistance Genes (ARGs)?
HGT allows bacteria to acquire DNA from distantly related organisms, profoundly reshaping their genomes [20]. This process complicates ARG classification in several ways:
- Integration of Novel Genes: HGT can introduce entirely new ARGs into a genome, often from uncharacterized sources [20] [21].
- Formation of New Operons: Horizontally acquired genes, including ORFans (genes with no identifiable homologs), can be inserted into existing operons, creating new genetic units [21].
- Phylogenetic Incongruity: The history of a horizontally transferred gene differs from the history of the host organism. Phylogenetic trees of the ARG will disagree with the species tree, creating confusion about its origin [20].
- Blurred Taxonomic Boundaries: HGT enables ARGs to move across species boundaries, making it difficult to associate a specific resistance gene with a specific bacterial lineage [20].
Q3: In RND efflux pumps, what specific genomic features can lead to ambiguous ARG type classification?
The Resistance-Nodulation-Division (RND) efflux pumps are a major source of multidrug resistance in Gram-negative bacteria [9] [22]. Ambiguity in their classification arises from several features intrinsic to their genomic context and function:
- Operonic Structure and Shared Components: RND pumps are often encoded in operons (e.g., the
acrABoperon for the RND and membrane fusion protein) but require a third, chromosomally separate component (e.g.,tolCfor the outer membrane protein) to function [9]. This genetic separation can complicate the annotation of the complete functional unit. - Gene Duplication and Homology: Genes within the RND family share significant sequence homology because they likely arose from gene duplication events [21]. This high similarity can make it difficult for classification algorithms to distinguish between closely related pump subtypes.
- Substrate Promiscuity: RND pumps extrude a broad range of structurally diverse antibiotics, biocides, and detergents [9] [22]. This functional redundancy means that different pump systems can confer resistance to the same antibiotic, and a single pump can be responsible for resistance to multiple drug classes.
Q4: A common problem in my research is the misclassification of MexF sequences as adeF in database searches. What is the technical basis for this error?
This specific misclassification is a documented issue related to the bit-score thresholds used by databases like the Comprehensive Antibiotic Resistance Database (CARD) [23]. The problem occurs as follows:
- The CARD database uses pre-trained, type-specific bit-score cutoffs for ARG identification [23].
- The
adeFARG type has a relatively low bit-score threshold (~750), allowing sequences with lower identity to be classified asadeF. - In contrast, the
mexFARG type has a much higher threshold (~2200), requiring sequences to be almost identical for a positive classification. - Since genes in the RND family display inherent sequence homology, a
mexFsequence may have a bit score that fails to meet the stringentmexFthreshold but easily exceeds the more permissiveadeFthreshold. Consequently, the CARD model will incorrectly classify it asadeF, even thoughmexFis its true best BLAST hit [23].
Q5: What computational and experimental strategies can I use to resolve these ambiguous ARG classifications?
Resolving ambiguities requires a multi-faceted approach that moves beyond simple BLAST-based searches against a single database.
Table 1: Strategies for Resolving Ambiguous ARG Classification
| Strategy | Description | Application to RND Pump Ambiguity |
|---|---|---|
| Multi-Database Analysis | Cross-referencing hits across multiple ARG databases (e.g., CARD, SARG, NCBI-AMRFinder). | Confirms a hit is robust and not an artifact of one database's specific model [23]. |
| Phylogenetic Analysis | Constructing a gene tree of the query sequence with reference sequences from known ARG types. | Visually clusters the query with its true homologs, helping to distinguish between mexF and adeF [20]. |
| Genomic Context Inspection | Analyzing the surrounding genomic region of the query gene for operon structure and regulatory elements. | Identifying if the gene is part of a known acrAB-like or mexAB-like operon structure can support its classification [18] [9]. |
| Experimental Validation | Using phenotypic assays (e.g., MIC determination) with and without efflux pump inhibitors. | Functionally confirms the role of the pump in antibiotic resistance and its substrate profile [9] [22]. |
Troubleshooting Guide: Ambiguous ARG Classification in RND Efflux Pumps
Problem: Inconsistent or low-confidence ARG type assignments for RND efflux pump genes.
Solution: Follow a systematic workflow to refine the classification.
The following diagram illustrates a logical troubleshooting workflow to resolve ambiguous ARG classifications.
Step-by-Step Protocol:
Initial Multi-Database Query
- Action: Run your query sequence against at least two different ARG databases. The CARD database is a standard, but also consider SARG or NCBI's AMRFinder [23].
- Troubleshooting: If results are conflicting, note all proposed classifications and their confidence scores (e.g., bit-scores, percent identity). This conflict is the starting point for your investigation.
Genomic Context Analysis
- Objective: Determine if the gene is part of an operon, which supports its functional annotation.
- Protocol: a. Locate the gene in its genomic assembly using a genome browser. b. Identify upstream and downstream genes. Check if they are on the same strand and the intergenic distances. Short distances (often less than 100 bp) suggest co-transcription [18] [24]. c. Check for conserved operon structures. For example, an RND pump gene is often adjacent to a gene encoding a membrane fusion protein (MFP) [9]. d. Search for regulatory elements. Look for promoter sequences upstream and Rho-independent terminators downstream [24].
Phylogenetic Analysis
- Objective: Visually cluster your sequence with its true evolutionary relatives to resolve classification disputes (e.g.,
mexFvs.adeF). - Protocol:
a. Sequence Collection: Gather reference protein sequences for the ARG types in question (e.g.,
mexF,adeF,acrB) from public databases. b. Multiple Sequence Alignment: Use a tool like Clustal Omega or MAFFT to align your query sequence with the references. c. Tree Building: Construct a phylogenetic tree using a method like Maximum Likelihood or Neighbor-Joining. Use a distantly related sequence as an outgroup. d. Interpretation: Your query sequence's classification is supported if it forms a clade (a group with a common ancestor) with sequences of a known ARG type with high bootstrap support.
- Objective: Visually cluster your sequence with its true evolutionary relatives to resolve classification disputes (e.g.,
Experimental Validation (If Feasible)
- Objective: Provide functional evidence for the ARG's identity and activity.
- Protocol: Efflux Pump Inhibition Assay
- Materials: A bacterial strain expressing the RND pump, relevant antibiotics, and an efflux pump inhibitor (e.g., PAβN).
- Method: i. Determine the Minimum Inhibitory Concentration (MIC) of an antibiotic for the strain. ii. Repeat the MIC determination in the presence of a sub-lethal concentration of the efflux pump inhibitor. iii. Interpretation: A significant (e.g., 4-fold or greater) reduction in MIC in the presence of the inhibitor confirms the involvement of an active efflux mechanism [9] [22].
The Scientist's Toolkit: Essential Research Reagents and Materials
Table 2: Key Reagents for Studying RND Efflux Pumps and ARG Classification
| Item | Function/Brief Explanation | Example(s) |
|---|---|---|
| CARD Database | A curated resource providing ARG sequences, type-specific bit-score thresholds, and ontology terms for computational identification [23]. | https://card.mcmaster.ca/ |
| Efflux Pump Inhibitors (EPIs) | Small molecules that block the activity of efflux pumps. Used in experimental assays to confirm pump function and for combination therapies [22]. | Phenylalanine-arginine β-naphthylamide (PAβN) |
| Reference Strains | Well-characterized bacterial strains with known efflux pump profiles. Used as positive and negative controls in experiments. | E. coli K-12 (with AcrAB-TolC); P. aeruginosa PAO1 (with MexAB-OprM) [9] |
| RNA-seq Data | High-throughput sequencing data used to experimentally define operon structures by identifying co-transcribed genes across the genome [24]. | Data from studies on E. coli or Listeria monocytogenes [18] [24] |
| Bioinformatics Suites | Software tools that integrate various computational methods for operon prediction and phylogenetic analysis. | Rockhopper (for RNA-seq analysis and operon prediction) [24] |
A Methodological Toolkit: From Phylogenetics to Machine Learning for Precise ARG Typing
Robust Phylogenetic Frameworks Using Permease-Specific Reference Sequences
Frequently Asked Questions
What are the most common causes of misclassification in RND efflux pumps? Misclassification often arises from the high degree of genetic homology between different sub-types within the RND superfamily. Current database models, like CARD, use ARG-type-specific bit-score thresholds. Ambiguity occurs when a query sequence has a higher BLAST bit score to one ARG type (e.g., MexF) but its score is below that type's high threshold, while it exceeds the lower threshold of a different, homologous ARG type (e.g., adeF). This can lead to the sequence being incorrectly assigned to the type with the lower threshold [15].
My phylogenetic tree for RND pumps has low bootstrap support. How can I improve its robustness? Low bootstrap values often indicate unreliable branching patterns. For highly divergent or fast-evolving protein families like RND pumps, consider moving beyond sequence-only methods. Structural phylogenetics, which uses protein structure information that evolves more slowly than sequence, can provide more robust evolutionary signals. Using a pipeline like FoldTree, which aligns sequences using a structural alphabet before tree building, can resolve relationships that sequence-based methods miss, leading to better-supported topologies [25].
How should I handle large gaps in my multiple sequence alignment before tree building? The treatment of gaps depends on their nature and size. For large gaps at the sequence ends, it is recommended to trim these regions prior to realignment. For large indels in the middle of the alignment that are not present in all sequences, exercise caution; small indels have a minor effect, but large gaps that do not contain useful phylogenetic information can be considered for removal. Always document any trimmed regions for methodological transparency [26].
What is the gold-standard method for classifying closely related species like the Klebsiella pneumoniae complex (PQV)? While Whole-Genome Sequencing (WGS) is the most reliable method, it can be resource-intensive. A robust and cost-effective alternative is to use panels of Species-Specific Marker Genes (SSMGs). These are genes present in all genomes of one species but absent in others. Sequencing these markers provides a rapid and accurate method for species differentiation, with the Genome Taxonomy Database (GTDB) serving as a highly accurate taxonomic reference [27].
My data matrix is very large. Can I align and build trees in sections to save time? No, this approach is not recommended. Phylogenetic analyses are approximations of evolutionary history based on the entire dataset provided. Altering the dataset by breaking it into sections changes the context of the analysis and will produce different, non-comparable results. For a large number of samples, a better strategy is to perform analyses on a representative, pared-down subset of taxa to infer broad-level relationships [26].
Troubleshooting Guides
Problem: Ambiguous Antibiotic Resistance Gene (ARG) Type Classification
Issue: When identifying ARGs in RND efflux pumps, the same query sequence may be classified into different ARG types by different databases or methods, or classified to a type that is not its best BLAST hit.
Diagnosis: This is a known challenge with RND efflux pumps, exemplified by the misclassification of MexF sequences as adeF in the CARD database. This happens due to an FN-ambiguity (False-Negative ambiguity), where the curated bit-score threshold for the correct ARG type (MexF) is set too high, while the threshold for a homologous type (adeF) is lower [15].
Solution: A multi-step validation protocol is recommended to resolve these ambiguities.
- Run a BLASTP Analysis: Perform a manual BLASTP of your query sequence against the CARD database protein sequences.
- Identify the Best Hit: Note the ARG type that gives the highest raw BLAST bit score.
- Check against CARD Model: Compare the bit scores against the pre-defined thresholds for the top-hit ARG types in CARD.
- Report Ambiguity: If the classification from the CARD model (based on thresholds) differs from the BLAST best-hit, report both the model-assigned type and the best-hit type as an ambiguous case. For critical applications, consider the best BLAST hit as the more likely classification.
Problem: Resolving Phylogenies of Highly Divergent Protein Families
Issue: Standard sequence-based phylogenetic trees for fast-evolving protein families (e.g., RRNPPA quorum-sensing receptors) have low resolution, poor branch support, or unclear evolutionary relationships due to sequence saturation.
Diagnosis: Over long evolutionary timescales, multiple substitutions at the same site cause sequence alignment and tree-building uncertainty. For such families, the phylogenetic signal in the primary amino acid sequence is often too weak [25].
Solution: Incorporate protein structural information into your phylogenetic analysis, as protein structure evolves more slowly than sequence.
Recommended Workflow: FoldTree [25]
- Gather Structures: Obtain protein structures for your homologs, either experimentally or via AI-based prediction tools like AlphaFold2.
- Generate 3Di Alignments: Use Foldseek to perform an all-against-all comparison of structures. This aligns sequences using a structural alphabet (3Di), which represents the local structural context of each residue.
- Calculate Distances: From the Foldseek output, use the statistically corrected sequence similarity metric (
Fident) to create a distance matrix. - Build the Tree: Construct a Neighbor-Joining tree from the
Fidentdistance matrix. Benchmarking shows this approach outperforms both pure sequence and other structure-distance methods for divergent families.
Experimental Protocols
Protocol 1: Identifying Species-Specific Marker Genes (SSMGs)
This protocol outlines a methodology for discovering genetic markers that can accurately differentiate between closely related bacterial species, as demonstrated for the Klebsiella pneumoniae complex [27].
Methodology:
- Data Acquisition and Curation:
- Acquire high-quality, closed genomes from a curated database like IMG/M.
- Evaluate genome quality (completeness and contamination) using CheckM.
- Use the Genome Taxonomy Database (GTDB) as a reference for accurate taxonomic classification, as it has been shown to be more consistent than NCBI for closely related species.
Phylogenetic Framework:
- Annotate genomes using a tool like RASTtk.
- Construct a robust phylogenetic tree using a multi-gene or whole-genome approach to establish a reliable species clade structure.
Comparative Genomics and Marker Identification:
- Perform pangenome profiling across the defined species clades.
- Screen for KEGG Orthologies (KOs) that are present in 100% of genomes from one species and absent in all genomes of the other species.
- This presence/absence analysis will yield candidate SSMGs.
Validation:
- Test the specificity of candidate markers against a larger set of genomes.
- A panel of multiple SSMGs (e.g., K05306, K07507, K13795, K09955 for Klebsiella) should be used for reliable differentiation.
Protocol 2: Structural Phylogenetics for Divergent Protein Families
This protocol details the "FoldTree" method for inferring more accurate phylogenetic trees for highly divergent protein sequences by leveraging structural information [25].
Methodology:
- Input Preparation:
- Collect a set of homologous protein sequences.
- Obtain their 3D structures. Ideally, use AlphaFold2-predicted models and filter them based on predicted pLDDT scores to ensure structural reliability.
Structural Alignment:
- Use Foldseek to perform an all-versus-all comparison of the structures in the "3Di" mode. This generates a multiple sequence alignment based on the structural alphabet, which is more conserved than the amino acid sequence.
Distance Calculation:
- From the Foldseek results, extract the
Fidentvalue for each protein pair. This value represents a statistically corrected sequence similarity based on the structural alignment. - Compile these values into a pairwise distance matrix.
- From the Foldseek results, extract the
Tree Building:
- Use a distance-based method, such as Neighbor Joining, with the
Fidentdistance matrix to infer the phylogenetic tree.
- Use a distance-based method, such as Neighbor Joining, with the
Workflow Visualization:
Table: Essential Resources for Phylogenetic Analysis of ARGs and Efflux Pumps
| Resource Name | Type/Category | Function in Research |
|---|---|---|
| CARD (Comprehensive Antibiotic Resistance Database) [15] | Database | A curated resource containing ARG sequences, type-specific bit-score thresholds, and prevalence data for identifying and classifying resistance genes. |
| GTDB (Genome Taxonomy Database) [27] | Database | Provides a phylogenetically consistent and standardized bacterial taxonomy, crucial for accurate species-level classification in genomic studies. |
| Foldseek [25] | Software Tool | Rapidly aligns and compares protein structures using a structural alphabet, enabling structure-informed phylogenetic and homology analyses. |
| CheckM [27] | Software Tool | Assesses the quality and completeness of microbial genomes derived from sequencing, ensuring reliable downstream genomic analysis. |
| Species-Specific Marker Genes (SSMGs) [27] | Genetic Marker | A panel of genes unique to a specific species; used for rapid, accurate, and cost-effective differentiation of closely related species. |
| AlphaFold2 [25] | AI Tool | Predicts highly accurate 3D protein structures from amino acid sequences, providing structural data for analysis where experimental structures are unavailable. |
Frequently Asked Questions (FAQs) and Troubleshooting Guides
FAQ 1: What are the primary advantages of using cryo-EM over X-ray crystallography for studying RND efflux pumps?
Answer: Cryo-EM offers several distinct advantages for analyzing the structure of RND efflux pumps, which are critical membrane protein complexes [28] [29].
- No Crystallization Required: Cryo-EM does not require protein crystallization, bypassing a major bottleneck of X-ray crystallography that is particularly challenging for membrane proteins and large complexes [28].
- Small Sample Amounts: This technique requires only small amounts of sample compared to crystallography [28].
- Preservation of Native States: Vitrification (flash-freezing) preserves the sample in a near-native, hydrated state, allowing for the study of multiple conformational and compositional states that may coexist in a sample [28] [29].
- Handling Flexibility and Heterogeneity: Single-particle cryo-EM is particularly adept at dealing with conformational flexibility and discrete heterogeneity, which is common in dynamic complexes like efflux pumps. Advanced software can separate different structural states from a single data set [29] [30].
FAQ 2: During model building, my cryo-EM map has a global resolution of 3.2 Å, but I am having trouble tracing the backbone and placing key arginine side chains. What are the best practices for validation?
Answer: This is a common challenge in the "shadow range" of 3.3 to 4.5 Å resolution, where side-chain density becomes partially visible [31]. Relying on a single validation metric can be misleading. The 2019 EMDataResource Challenge recommends using a combination of Fit-to-Map and Coordinates-only metrics for a full and objective assessment [32].
- Common Modeling Errors to Avoid:
- Peptide Bond Misorientation: The carbonyl oxygen protrusion can disappear into the backbone density tube, leading to incorrect orientation of trans peptide bonds. This may not be flagged as a Ramachandran outlier but can be detected by the CaBLAM metric [32].
- Sequence Misalignment: In weak density, the protein sequence can be misthreaded. This is often recognized by poor local Fit-to-Map scores, bad geometry, and clashes [32].
- Recommended Validation Metrics: The table below summarizes key validation metrics recommended by the community challenge for near-atomic resolution structures [32].
Table 1: Key Cryo-EM Model Validation Metrics for Near-Atomic Resolution
| Metric Category | Metric Name | Description and Utility |
|---|---|---|
| Fit-to-Map | Q-score | Assesses atom resolvability; scores improve with better map resolution [32]. |
| Map-Model FSC | Measures the correlation between the model and the map; the FSC=0.5 threshold is a standard resolution indicator [32]. | |
| EMRinger | Evaluates the fit of side-chain rotamers to the density; sensitive to map resolution [32]. | |
| Coordinates-only | MolProbity Clashscore | Measures steric overlaps; high scores indicate poor atomic packing [32]. |
| Ramachandran Outliers | Identifies energetically unfavorable protein backbone conformations [32]. | |
| CaBLAM | Evaluates protein backbone conformation using virtual dihedral angles; detects peptide bond misorientation [32]. |
FAQ 3: How can I resolve ambiguous amino acid classification, specifically for arginine residues, in moderate-resolution cryo-EM maps?
Answer: Ambiguous assignment of bulky, positively charged residues like arginine is frequent when side-chain density is unclear. A multi-pronged approach is necessary.
Leverage Complementary Information:
- Evolutionary Coupling (EC) Data: Use predicted residue-residue contacts from sequence co-evolution analysis. These constraints can guide the placement of side chains, including arginines, by indicating which residues are likely to be in spatial proximity [31].
- Comparative Modeling: If a homologous structure exists (e.g., MexB for studying MexY), use it as a guide. Aligning your sequence and model to the known structure can provide a strong prior for the expected location of conserved arginine residues [33] [34].
Analyze the Chemical Environment:
- Substrate Specificity Switches: Look for charge-reversal patterns. For example, in the P. aeruginosa MexB pump, key charged residues (K134, R620) are critical for substrate binding. In the related MexY pump, the corresponding residues are D133 and E644. This switch from positive to negative charge may explain differences in substrate specificity and can serve as a landmark for orientation and assignment [33].
- Functional Cluster Analysis: Identify if the arginine is part of a known functional cluster. For instance, the periplasmic cleft of MexY is surrounded by anionic and aromatic residues (e.g., E129, D133, E175, Y127, Y613, Y659) that are critical for substrate recognition. An arginine found in this region should be evaluated for its potential role in binding positively charged drugs like aminoglycosides [33].
FAQ 4: What experimental protocols are recommended for determining a substrate-bound structure of an RND efflux pump using cryo-EM?
Answer: Protocol: Single-Particle Cryo-EM of a Substrate-Bound RND Efflux Pump
I. Sample Preparation and Vitrification
- Purification: Purify the efflux pump (e.g., MexY) in a suitable detergent or, ideally, in a lipid environment like nanodiscs to maintain native conformation and stability [29].
- Substrate Incubation: Incubate the purified pump with a high concentration of the target substrate (e.g., an aminoglycoside antibiotic) for a sufficient time to ensure binding. Use a concentration well above the MIC if possible.
- Grid Preparation: Apply the protein-substrate complex to a cryo-EM grid. Blot away excess liquid and vitrify the grid by plunging it into a cryogen such as liquid ethane. The use of a spraying-freezing apparatus or microfluidic mixing devices can be employed for time-resolved studies to capture transient binding states [30].
II. Data Collection and Processing
- Microscopy: Collect a large dataset of movie micrographs using a transmission electron microscope equipped with a direct electron detector. Data should be collected in "movie mode" to facilitate motion correction [28].
- Motion Correction & Particle Picking: Correct for beam-induced motion from the movie frames. Automatically pick particle images from the micrographs.
- 2D and 3D Classification: Perform multiple rounds of 2D classification to select well-defined particles. Use 3D classification to isolate homogeneous subsets of particles. This is crucial for separating particles with and without bound substrate, and for sorting different conformational states (e.g., binding, resting, extrusion) of the pump trimer [33] [29].
- Refinement and Resolution Assessment: Refine the selected particle subsets to generate a high-resolution 3D reconstruction. Calculate the global and local resolution of the final map using the Fourier Shell Correlation (FSC=0.143) criterion.
III. Model Building, Refinement, and Validation
- De Novo Model Building: For the substrate-bound state, use a combination of automated tools (e.g., DeepTracer, Rosetta) and manual building in programs like Coot to trace the protein backbone and place side chains [31].
- Ligand Docking: Fit the substrate into clear, uncontaminated density within the binding pockets (e.g., the periplasmic cleft, central cavity). The density should be distinct from that of the protein and detergent.
- Refinement and Validation: Refine the atomic model against the cryo-EM map. Conduct rigorous validation using the metrics outlined in Table 1 to ensure the model's accuracy, including the fit of the substrate and the surrounding residues [32].
The Scientist's Toolkit: Research Reagent Solutions
Table 2: Essential Materials for RND Efflux Pump Structural Studies
| Research Reagent | Function and Application |
|---|---|
| Direct Electron Detector | Hardware component of the "quantum leap" in cryo-EM. Provides high contrast, preserves high-resolution signal, and enables movie-mode data collection for motion correction [28]. |
| Lauryl Maltose Neopentyl Glycol (LMNG) | A surfactant used in protein purification and crystallization. Can act as a competitive inhibitor and substrate for RND pumps like MexB, making it useful for functional and structural studies [34]. |
| Lipid Cubic Phase (LCP) / Nanodiscs | Lipid bilayer mimetics that maintain membrane proteins in a native-like lipid environment. Can lead to more physiologically relevant structures compared to detergent-solubilized proteins [29]. |
| ABI-PP | A pyridopyrimidine derivative efflux pump inhibitor. It binds with high affinity to a specific hydrophobic pit in the distal binding pocket of pumps like AcrB and MexB, serving as a tool for structural studies of inhibition [34]. |
Workflow and Pathway Diagrams
Diagram 1: Cryo-EM Model Building & Validation
This diagram illustrates the key steps and decision points in building and validating an atomic model from a cryo-EM density map, with a focus on resolving ambiguous residues.
Diagram 2: RND Efflux Pump Transport Conformation Cycle
This diagram shows the functional rotation mechanism of an RND pump trimer, highlighting the different conformational states that are often resolved by cryo-EM and are critical for understanding substrate transport.
Frequently Asked Questions
FAQ 1: What are the primary functional assays for confirming efflux pump activity and its role in resistance?
Researchers typically use a combination of assays to build a complete picture of efflux pump function. Key methodologies include:
- Efflux Assays: These measure the real-time extrusion of a fluorescent substrate (e.g., ethidium bromide) from pre-loaded cells. An accelerated decrease in intracellular fluorescence compared to a control strain indicates active efflux [35].
- Accumulation Assays: These quantify the intracellular concentration of a substrate over time, often using fluorometry or mass spectrometry. Higher accumulation in the presence of an Efflux Pump Inhibitor (EPI) or in an efflux-deficient mutant confirms the pump's activity [36].
- Minimum Inhibitory Concentration (MIC) Determinations: The MIC of various antibiotics is measured in the presence and absence of an EPI. A significant decrease (e.g., 4-fold or greater) in MIC upon the addition of an EPI is strong evidence of efflux-mediated resistance [36] [35].
FAQ 2: How can I determine the substrate profile of an RND efflux pump?
Substrate profiling involves testing the pump's ability to confer resistance to a wide array of compounds.
- Method: Create an isogenic bacterial strain that overexpresses the RND pump of interest. Determine the MICs for a panel of antimicrobial agents (e.g., antibiotics, dyes, biocides) against this strain and compare them to the MICs for a control strain with basal pump expression. A significant increase in MIC for a particular compound confirms it is a substrate [35].
- Data Integration: Profiling studies have revealed that RND pumps like AcrB and KexF can recognize a remarkably broad range of structurally unrelated compounds, contributing to the multidrug-resistant (MDR) phenotype [37] [35].
FAQ 3: My efflux assay shows high background fluorescence, obscuring the results. What could be the cause?
High background is a common issue that can stem from several factors:
- Cell Lysis: Damage to cells during washing or the assay itself can release the fluorescent substrate into the media, increasing external fluorescence. Ensure gentle handling and optimize centrifugation speeds [36].
- Insufficient Energy Source: Active efflux requires energy (typically the proton motive force). Ensure your assay buffer contains a sufficient energy source like glucose to fuel the transport process.
- Non-specific Binding: The fluorescent substrate may be binding to the exterior of the cells or the assay vessel. Include a control with an energy poison (e.g., Carbonyl Cyanide m-Chlorophenylhydrazone, CCCP) to collapse the proton motive force and inhibit active efflux; this establishes the baseline for no-efflux fluorescence [36].
FAQ 4: How can I distinguish between increased efflux activity and other resistance mechanisms (like target mutation) in a clinical isolate?
A systematic approach is required to deconvolute resistance mechanisms.
- Use an EPI: As in FAQ 1, a reversal of resistance upon addition of a broad-spectrum EPI strongly points to efflux.
- Genetic Analysis: Sequence the genes encoding the suspected drug targets to rule out target site mutations.
- Gene Expression Analysis: Quantify the mRNA expression levels of the major RND efflux pumps (e.g., acrB, oqxB, kexF) in the clinical isolate versus a reference strain. Overexpression is a common cause of increased efflux activity [35].
- Pump Inactivation: Genetically inactivate the suspected efflux pump in the clinical isolate. If the resistance is primarily due to that pump, the MICs for its substrates will drop significantly [38].
FAQ 5: What controls are essential for a robust ethidium efflux assay?
Proper controls are critical for interpreting efflux data.
- Energy Poison Control: Treat cells with CCCP. This should abolish active efflux, resulting in a flat or slowly decreasing fluorescence curve, confirming that the observed efflux is energy-dependent.
- EPI Control: Incubate cells with a known EPI. This should inhibit efflux, similar to CCCP, and validate the assay's specificity.
- Strain Controls: Include an efflux-deficient strain (e.g., a knockout mutant) to establish the baseline for no efflux, and a known hyper-expressing strain as a positive control [35].
Experimental Protocols
Protocol 1: Real-Time Ethidium Bromide Efflux Assay
This protocol measures the kinetics of substrate extrusion from bacterial cells [35].
1. Materials:
- Bacterial cultures (test strain, efflux-deficient mutant, and/or hyper-expressing strain)
- Ethidium Bromide (EtBr) solution
- Assay Buffer (e.g., phosphate-buffered saline with glucose)
- Carbonyl Cyanide m-Chlorophenylhydrazone (CCCP) solution
- Fluorometer or spectrofluorometer with temperature control
- Microcentrifuge tubes
2. Procedure:
- Step 1: Cell Preparation. Grow bacteria to mid-log phase. Harvest cells by centrifugation and wash twice with assay buffer to remove residual media.
- Step 2: Substrate Loading. Resuspend the cell pellet in assay buffer containing a sub-inhibitory concentration of EtBr. Incubate for 30-60 minutes to allow EtBr accumulation inside the cells.
- Step 3: Efflux Initiation. Pellet the loaded cells and wash once quickly to remove external EtBr. Resuspend in fresh, pre-warmed assay buffer with or without an EPI/CCCP and immediately transfer to a fluorometer cuvette.
- Step 4: Data Acquisition. Monitor fluorescence (Excitation: ~530 nm, Emission: ~590 nm) continuously for 20-30 minutes. The decrease in fluorescence over time represents active efflux of EtBr.
3. Data Analysis: Plot fluorescence intensity versus time. The initial rate of fluorescence decrease and the final plateau level are key metrics for comparing efflux activity between strains.
Protocol 2: Determining the Role of Efflux via Minimum Inhibitory Concentration (MIC) Reduction
This protocol uses EPIs to infer efflux pump contribution to resistance [36] [35].
1. Materials:
- Cation-adjusted Mueller-Hinton Broth
- Test antibiotics
- Efflux Pump Inhibitor (e.g., Phe-Arg-β-naphthylamide, PAβN)
- 96-well microtiter plates
2. Procedure:
- Step 1: Broth Microdilution. Perform a standard broth microdilution MIC assay for the antibiotic of interest against the bacterial strain.
- Step 2: EPI Addition. In a parallel assay, include a sub-inhibitory concentration of an EPI in all wells.
- Step 3: Incubation and Reading. Incubate the plates and determine the MIC as the lowest concentration that inhibits visible growth.
3. Data Analysis: A four-fold or greater reduction in the MIC value in the presence of the EPI is considered indicative of significant efflux pump activity against that antibiotic.
Data Presentation
Table 1: Example MIC Profile of K. pneumoniae Mutants Overexpressing RND Efflux Pumps [35]
| Antimicrobial Agent | Wild-type Strain MIC (μg/mL) | Mutant EB256-1 (eefA overexpression) MIC (μg/mL) | Mutant Nov2-2 (kexF overexpression) MIC (μg/mL) |
|---|---|---|---|
| Ethidium Bromide | 16 | 128 | 256 |
| Norfloxacin | 0.06 | 0.5 | 0.25 |
| Tetraphenylphosphonium Cl | 64 | >512 | >512 |
| Rhodamine 6G | 8 | 64 | 128 |
| Novobiocin | 8 | 32 | 128 |
Table 2: Essential Research Reagents for Efflux Functional Assays
| Reagent / Material | Function in Experiment |
|---|---|
| Fluorescent Substrates (e.g., Ethidium Bromide) | Probe molecules whose accumulation or efflux is directly measured to quantify pump activity [35]. |
| Efflux Pump Inhibitors (EPIs) (e.g., PAβN, CCCP) | Used to block pump function, confirming its role in resistance through MIC reduction or accumulation assays [36]. |
| Energy Source (e.g., Glucose) | Fuels the proton motive force required for the active transport of substrates by most RND pumps. |
| Assay Buffer (e.g., PBS) | Provides a controlled, non-toxic ionic environment for performing efflux and accumulation assays. |
Workflow Visualization
The following diagram illustrates the logical workflow and decision tree for troubleshooting ambiguous resistance mechanisms, central to the thesis on resolving ARG classification.
Logical workflow for resolving ambiguous ARG classification using functional efflux assays.
The diagram below outlines the key steps in a standard ethidium bromide efflux assay.
Key steps in the ethidium bromide efflux assay protocol.
Genome-Wide Association Studies (GWAS) and Pan-Genome Analysis for Novel ARG Discovery
Frequently Asked Questions (FAQs)
Q1: Our GWAS for antimicrobial resistance genes (ARGs) found no significant variants. What are the common causes? A lack of significant hits in a GWAS is often due to insufficient statistical power or improper model correction. Ensure your sample size is adequate; a convention in bacterial studies suggests a minimum of 100 isolates, though more may be needed for complex traits [39]. Population stratification is a major confounder; using a Linear Mixed Model (LMM) can control for this by accounting for the underlying population structure [39]. Furthermore, if known resistance variants are present in your population, conducting a conditional GWAS by including them as covariates in your model can reduce false positives and increase power to identify novel, secondary associations [40].
Q2: The GWAS results show many significant variants that are phylogenetically linked but not in known resistance genes. How should we interpret this? This pattern typically indicates population stratification or genetic linkage, where non-causal variants are co-inherited with the true causal mutation on a successful genetic background. For example, a GWAS on Neisseria gonorrhoeae initially identified variants in genes like hprA and ydfG that were later found to be linked to known 23S rRNA resistance mutations [40]. To address this, calculate linkage metrics (e.g., r²) between your significant hits and known ARGs. Re-running the GWAS conditional on these known variants, as demonstrated in a study of azithromycin resistance, can help distinguish true signals from spurious associations [40].
Q3: How can we distinguish a novel ARG from other types of genetic variants, like those involved in efflux pump regulation? Focus on the variant's genomic context and its association strength. Novel ARGs often involve non-synonymous mutations in genes with direct antimicrobial targets (e.g., ribosomal proteins, topoisomerases) or membrane transporters. In contrast, regulatory variants for efflux pumps may be found in promoter regions (e.g., mtrR promoter) and often have smaller effect sizes [40]. Pan-genome analysis is crucial here, as it can identify accessory genes, such as those encoding novel efflux pump components, that may be absent from the reference genome. Functional validation through mutagenesis or MIC testing is the definitive step for confirmation [39] [40].
Q4: Our pan-genome analysis is struggling with the "core vs. accessory" genome classification for RND efflux pump components. What is the best approach? Resolving ambiguous classification in RND efflux pumps requires a tiered approach. First, use a precise clustering method (e.g., CD-HIT, Roary with a high identity threshold) to define gene families. For components that are difficult to classify, perform a manual, gene-centric analysis: align all sequences of the specific pump component (e.g., MtrD) across your isolates. This can reveal mosaic alleles or fragmented genes that automated pipelines might misclassify [40]. Classifying these components correctly is essential, as mosaic alleles acquired from commensal species can be a key resistance mechanism [40].
Q5: What is the recommended workflow to integrate GWAS and pan-genome analysis for discovering novel ARGs in RND efflux pumps? An effective integrated workflow involves sequential and complementary steps:
- Pan-genome Construction: Use a tool like Roary to define the core and accessory genome from your isolate assemblies.
- Variant Calling: Extract single nucleotide variants (SNVs) from the core genome and presence/absence variants (PAVs) from the accessory genome.
- Parallel GWAS: Conduct separate association studies for SNVs and PAVs against your antimicrobial susceptibility testing (AST) phenotype data, using an LMM to control for population structure.
- Conditional Analysis: Re-run the GWAS conditioned on known ARG variants (e.g., 23S rRNA mutations) to uncover secondary effects.
- Data Integration: Overlap significant hits from both analyses. A significant PAV in a genomic region containing an uncharacterized membrane protein, especially if it co-occurs with SNVs in known regulators like mtrR, provides a strong candidate for a novel efflux component [39] [40].
Troubleshooting Guides
Issue 1: GWAS Yields No Significant Variants or Appears Underpowered
| Possible Cause | Diagnostic Steps | Solution |
|---|---|---|
| Insufficient Sample Size | Calculate the statistical power for your study given the expected effect size and allele frequency of ARGs. | Increase the number of sequenced isolates. A minimum of 100 is a common starting point, but several hundred may be needed for polygenic traits [39]. |
| Incorrect Phenotypic Data | Check for skewed Minimum Inhibitory Concentration (MIC) distributions. Correlate a known resistance variant with its expected phenotype as a positive control. | Ensure AST is performed using standardized methods (e.g., Sensititre microbroth dilution). Use a continuous MIC value instead of a binary resistant/susceptible classification for greater power [39]. |
| Overly Stringent Multiple Testing Correction | Review the Manhattan plot for variants just below the significance threshold (e.g., Bonferroni). | Consider using a less conservative method like False Discovery Rate (FDR) or consolidating the number of tested variants by grouping them into unique genetic patterns [39]. |
Issue 2: GWAS Identifies an Overabundance of False Positive Associations
| Possible Cause | Diagnostic Steps | Solution |
|---|---|---|
| Population Stratification (Clonal Population) | Examine a phylogenetic tree of your isolates; if the phenotype (e.g., high MIC) is confined to one clade, stratification is likely. | Implement a Linear Mixed Model (LMM) that includes a genetic relatedness matrix (kinship matrix) to account for population structure [39]. |
| Linkage with Known ARGs | Calculate linkage disequilibrium (e.g., r²) between your top hits and known resistance mutations. | Perform a conditional GWAS by incorporating known resistance variants (e.g., 23S rRNA mutations) as fixed-effect covariates in your model [40]. |
| Polygenic Trait Architecture | Check if the trait heritability is high but distributed across many variants of small effect. | Use methods like PCATOOLS or a Mixed Model to account for this polygenic background. |
Issue 3: Pan-Genome Analysis Fails to Resolve Ambiguous ARG Types in RND Efflux Pumps
| Possible Cause | Diagnostic Steps | Solution |
|---|---|---|
| Poor-Quality Genome Assemblies | Check assembly statistics (N50, number of contigs). Efflux pump genes may be fragmented across contigs. | Use long-read sequencing (e.g., Oxford Nanopore, PacBio) to generate complete, closed genomes for more accurate gene annotation and presence/absence calls. |
| Strict/Incorrect Clustering Threshold | Manually inspect the multiple sequence alignment for a specific RND component (e.g., MtrD) where classification is ambiguous. | Adjust the sequence identity threshold in your pan-genome tool (e.g., Roary). For highly conserved genes, a higher threshold (e.g., 95-99%) may be more appropriate. |
| Misannotation of Mosaic Genes | BLAST individual allele sequences against a database of known efflux pump genes from both pathogenic and commensal species. | Perform a manual, gene-centric analysis. Don't rely solely on automated pipelines for critical components. Manually curate the alignment and phylogenetic tree of the specific gene family [40]. |
Experimental Protocols & Data Presentation
Table 1: Key GWAS and Pan-Genome Analysis Software Tools
| Tool Name | Function | Key Application in ARG Discovery |
|---|---|---|
| Pyseer | Microbial GWAS | Identifies genetic variants (SNPs, k-mers, unitigs) associated with AMR phenotypes. Supports LMMs to control for population structure [39]. |
| Roary | Pan-genome Analysis | Rapidly constructs the pan-genome from annotated assemblies, categorizing genes into core and accessory genomes [40]. |
| BWA & Samtools | Read Alignment & Processing | Aligns sequencing reads to a reference genome and processes alignment files for variant calling [39]. |
| Freebayes | Variant Calling | Calls genetic variants (SNPs, indels) from aligned sequence data [39]. |
This table exemplifies how conditional analysis clarifies true associations by controlling for a major 23S rRNA resistance mutation [40].
| Gene / Variant | Beta (Effect Size) | P-value (Standard GWAS) | P-value (Conditional GWAS) | Interpretation |
|---|---|---|---|---|
| 23S rRNA (A2059G) | 7.14 | < 1 × 10⁻¹⁰⁰ | (Covariate) | Known target-site mutation, primary confounder. |
| hprA | ~0.9 | ~1 × 10⁻⁹ | > 1 × 10⁻⁶ | False positive; association lost after conditioning. |
| rplD (G70D) | 0.95 | Not Significant | 1.08 × 10⁻¹¹ | Novel, validated ribosomal protein mutation; revealed after conditioning [40]. |
| mtrR Promoter | -0.86 | Not Significant | 5.44 × 10⁻²⁰ | Known regulatory mutation; power increased after conditioning [40]. |
Protocol 1: Conducting a Conditional GWAS for AMR
Purpose: To identify novel ARGs by controlling for the effect of known, high-impact resistance mutations. Materials: Whole genome sequences, phenotypic MIC data, list of known ARG variants in the population. Methodology:
- Variant Calling and Filtering: Generate a high-quality set of core genome variants (e.g., using Freebayes) and filter for biallelic sites with high coverage [39].
- Population Structure Correction: Generate a kinship matrix from the core genome variants to account for population stratification.
- Initial GWAS: Run an initial GWAS (e.g., using Pyseer's LMM) with the MIC phenotype and the kinship matrix. This identifies both known and potentially confounded novel variants [39] [40].
- Conditional GWAS: Re-run the GWAS using the same model, but add the known resistance variants (e.g., copy number of 23S rRNA A2059G and C2611T mutations) as fixed-effect covariates.
- Result Interpretation: Compare the results before and after conditioning. True novel associations will remain significant, while variants linked to the known ARGs will drop below the significance threshold [40].
Protocol 2: Resolving Ambiguous RND Efflux Pump Components via Pan-Genome Analysis
Purpose: To accurately classify and analyze RND efflux pump genes that are misclassified by automated pipelines. Materials: Annotated genome assemblies for all isolates. Methodology:
- Automated Pan-Genome Construction: Run Roary with standard parameters to get an initial classification of core and accessory genes.
- Gene-Centric Extraction: Extract the protein sequences for the specific RND component of interest (e.g., MtrD) from the Roary output for all isolates.
- Multiple Sequence Alignment and Phylogeny: Create a multiple sequence alignment (e.g., using MAFFT) of all extracted sequences. Build a phylogenetic tree to visualize the relationships.
- Manual Curation: Manually inspect the alignment and tree. Look for:
- Mosaic alleles: Sequences with regions of high similarity to commensal Neisseria species [40].
- Fragmented genes: Sequences that are truncated due to assembly errors.
- Divergent alleles: Sequences that form distinct clades and may represent novel pump subtypes.
- Re-classification: Based on this manual analysis, re-classify the alleles and update your presence/absence matrix for a more accurate association analysis.
Visualization: Experimental Workflows
GWAS and Pan-Genome Workflow
Conditional GWAS Logic
The Scientist's Toolkit: Research Reagent Solutions
Table 3: Essential Materials for GWAS and Pan-Genome Analysis of ARGs
| Item / Reagent | Function / Application | Example / Specification |
|---|---|---|
| Sensititre Microplate | High-throughput antimicrobial susceptibility testing (AST) to generate precise MIC phenotype data [39]. | Customized plates with serial two-fold dilutions of antimicrobials (e.g., enrofloxacin, tetracyclines, macrolides) [39]. |
| AlamarBlue Indicator | Colorimetric redox indicator used in broth microdilution AST to assess bacterial growth and determine MICs [39]. | |
| Reference Genome | A high-quality complete genome for read alignment and variant calling during the bioinformatic pipeline. | Mycoplasma bovis PG45 (CP002188.1) or Neisseria gonorrhoeae FA1090 [39]. |
| Trimmomatic | A flexible read trimming tool for Illumina NGS data to remove adapters and low-quality sequences [39]. | |
| BWA & Samtools | Standard tools for aligning sequencing reads to a reference genome and manipulating sequence alignment files [39]. | |
| Roary | A high-speed pan-genome pipeline for categorizing genes into core, soft core, shell, and cloud genomes [40]. | |
| Pyseer | A Python-based tool for performing microbial GWAS, supporting multiple models to detect genetic associations with phenotypes [39]. |
Machine Learning Approaches for Predicting Substrate Specificity from Sequence Data
What is the core challenge in predicting substrate specificity for RND efflux pumps?
The primary challenge lies in the conformational plasticity of RND efflux pumps and the fact that substrate specificity is determined by complex, non-linear relationships within the protein sequence. Unlike simple enzyme-substrate relationships, RND pumps like AcrB and OqxB possess dynamic binding pockets that adopt different conformational states to accommodate structurally unrelated drugs [41]. Furthermore, research indicates that substrate recognition is determined predominantly by two large periplasmic loops, making feature extraction from sequence data particularly challenging [42].
Why do traditional alignment-based methods fail with novel ARG variants?
Traditional methods like BLAST rely on high sequence similarity to reference databases. When sequences diverge or represent novel variants, these methods produce false negatives due to their reliance on fixed similarity thresholds [43] [44]. For instance, as shown in Table 1, the performance of alignment-based tools drops significantly for sequences with low identity (<50%) to known ARGs in databases.
How can machine learning models overcome data imbalance in ARG datasets?
Data imbalance, where some ARG classes have few training examples, is a fundamental problem. Solutions integrated into modern tools include:
- Algorithmic Approaches: Using the Borderline-SMOTE algorithm to generate synthetic samples for underrepresented classes [45].
- Data Partitioning Strategies: Employing tools like GraphPart for precise dataset splitting, which ensures that training and testing sets do not contain sequences above a specified similarity threshold, thereby preventing biased performance metrics [43].
Troubleshooting Experimental Workflows
Issue: Poor model performance on divergent ARG sequences
Diagnosis: The model may be over-reliant on homology features and fails to learn the discriminative sequence patterns for remote homologs. Solution: Implement a hybrid model architecture.
- Protocol: Use a pipeline like ProtAlign-ARG, which integrates a pre-trained protein language model (PPLM) with an alignment-based scoring system [43].
- Input protein sequences are first passed through the PPLM to generate embeddings that capture complex contextual patterns.
- A confidence threshold is applied to the PPLM's prediction.
- Sequences for which the model lacks confidence are automatically routed to an alignment-based module that uses bit-scores and e-values for final classification [43].
- Expected Outcome: This approach demonstrated remarkable accuracy, particularly in recall, outperforming models that use only one source of information [43].
Issue: Inability to predict substrate specificity for uncharacterized RND pumps
Diagnosis: Standard ARG classification tools predict the antibiotic class but often lack granularity for specific substrate profiles within RND pumps. Solution: Leverage protein language models for fine-grained functional inference.
- Protocol:
- Feature Extraction: Utilize a pre-trained protein language model (e.g., ESM, ProtTrans) to convert protein sequences into numerical embeddings. These embeddings encapsulate semantic information from vast unannotated protein sequence corpora [43].
- Model Training: Train a classifier (e.g., a Convolutional Neural Network or CNN) on these embeddings. For example, ARG-CNN applies a deep CNN over raw protein sequences to extract local features related to function [44].
- Specificity Inference: Studies show that transferring a single conserved residue between phylogenetic clusters of RND pumps (e.g., from AcrB to OqxB) can alter the resistance profile. ML models can be tuned to detect such critical residue patterns that determine substrate specificity [41].
Performance Data & Tool Selection
Table 1: Comparative Performance of ARG Classification Methods on Sequences with Varying Identity to Database
| Method | No Hit (0% Identity) | Low Identity (≤50%) | High Identity (>50%) |
|---|---|---|---|
| BLAST Best Hit | 0.0000 | 0.6243 | 0.9542 |
| DeepARG | 0.0000 | 0.5266 | 0.9419 |
| TRAC | 0.3521 | 0.6124 | 0.9199 |
| ARG-CNN | 0.4577 | 0.6538 | 0.9452 |
| ARG-SHINE (Ensemble) | 0.4648 | 0.6864 | 0.9558 |
Performance metric is accuracy. Data adapted from benchmark studies [44].
Table 2: Overview of Advanced ML Tools for ARG and Substrate Specificity Analysis
| Tool Name | Core Methodology | Key Advantage | Application Context |
|---|---|---|---|
| ProtAlign-ARG | Hybrid: Protein Language Model + Alignment scoring | High accuracy on sequences with low homology; robust to data imbalance [43]. | Classifying ARGs from novel or divergent pathogens. |
| ARG-SHINE | Ensemble: Learning to Rank integrates CNN, InterPro, KNN | Superior performance across all identity levels; uses protein domain knowledge [44]. | Comprehensive ARG class prediction from metagenomic data. |
| ARGNet | Deep Neural Network: Autoencoder + CNN | Handles sequences of variable lengths (short reads to full-length); reduced runtime [46]. | Efficient analysis of large-scale sequencing data. |
| ISTRF | Random Forest + PSSM features | Effective for specific protein families (e.g., transporters); uses Borderline-SMOTE for imbalance [45]. | Predicting function of transmembrane transporters like SUT proteins. |
Essential Research Reagent Solutions
Table 3: Key Resources for ML-Based Analysis of RND Efflux Pumps
| Research Reagent / Resource | Function in Analysis | Example / Source |
|---|---|---|
| Curated ARG Databases | Provides labeled data for model training and validation. | HMD-ARG-DB, CARD, COALA dataset [43] [44]. |
| Protein Language Model (PPLM) | Generates contextual embeddings from amino acid sequences, capturing structural and functional motifs. | ESM (Evolutionary Scale Modeling), ProtTrans [43]. |
| Feature Encoding Tools | Converts protein sequences into numerical vectors for machine learning. | Position-Specific Scoring Matrix (PSSM), k-separated-bigrams-PSSM [45]. |
| Data Partitioning Software | Ensures non-redundant and rigorous splitting of data into training/test sets to avoid overestimation of performance. | GraphPart [43]. |
Visualizing Workflows and Structures
Tripartite Structure and Conformational Cycle of an RND Efflux Pump
This diagram illustrates the fundamental mechanism of RND efflux pumps, which is critical for understanding the substrate specificity that ML models aim to predict.
Hybrid ML Workflow for Resolving Ambiguous ARG Classification
This workflow diagram outlines the integrated protocol for tackling ambiguous classifications, as described in the troubleshooting section.
Overcoming Classification Pitfalls: Strategies for Resolving Ambiguous Cases
Addressing Database Inconsistencies and Annotation Errors in Public Repositories
FAQs on Database Issues and Troubleshooting
- What are the common causes of database inconsistencies? Inconsistencies can arise from incorrect system shutdowns (like power failure or process termination), failures to complete transactions due to JVM errors (such as OutOfMemoryError), or underlying hardware and I/O path issues [47] [48].
- What symptoms indicate a corrupt database repository? Look for error messages related to orphaned nodes, such as "NodeState references inexistent parent," "ParentState references inexistent child," "ChildNode has invalid parent," or "javax.jcr.ItemExistsException" [48].
- Why do annotation errors occur in public sequence databases? Errors primarily stem from incorrect user-submitted metadata, contamination in biological samples, and computational prediction errors based on homology, which are then propagated as the database grows [49].
- What is the recommended first step when DBCC CHECKDB reports errors? Before attempting any repair, resolve any underlying hardware-related problems, update device drivers, firmware, and operating system updates relevant to the I/O path [47].
- How can I detect taxonomically misclassified sequences? Heuristic methods can be used to detect misclassified proteins by analyzing provenance, frequency of annotations, and clustering information. One study using this approach found over two million potentially misclassified proteins in the NR database [49].
The following table summarizes findings from a large-scale analysis of the non-redundant (NR) protein database, highlighting the scale of taxonomic misclassification [49].
| Metric | Figure | Context |
|---|---|---|
| Proteins with multiple taxonomic assignments | 29,175,336 | Total sequences in NR with conflicting annotations. |
| Potentially misclassified proteins | 2,238,230 | Identified via heuristic method; 7.6% of sequences with multiple assignments. |
| Clusters with potential misclassifications | 3,689,089 (4%) | Clusters grouped at 95% sequence similarity containing misclassifications. |
| Detection Method Performance | 97% Precision, 87% Recall | As measured on simulated data for the heuristic detection method. |
Troubleshooting Guides
Guide 1: Resolving Database Consistency Errors
This workflow is critical for maintaining database integrity, especially when working with genomic data for RND efflux pump classification.
Methodology Details:
- Investigate Root Cause: Check Windows System Event Logs for system-level errors. Run diagnostics provided by your hardware manufacturer for storage and memory [47].
- Check Hardware & System: Ensure the entire I/O path configuration conforms to SQL Server requirements. Update all device drivers and supporting software [47].
- Apply SQL Server Updates: Apply the latest Cumulative Updates or Service Packs, as they may contain fixes for known issues related to corruption [47].
- Choose Recovery Path:
- Path A (Restore): The best solution is to restore from a known good backup [47].
- Path B (Repair): Execute
DBCC CHECKDBwith theREPAIR_ALLOW_DATA_LOSSoption. This may require multiple runs and can lead to data loss, leaving the database in a logically inconsistent state [47]. - Path C (Export): Script out the database schema to create a new database. Use tools like BCP or SSIS to export as much data as possible from the corrupted database [47].
- Manual Data Validation: After any repair or data export, perform manual validation. Repair processes can remove inconsistent data, potentially breaking logical relationships like foreign keys [47].
Guide 2: Detecting and Correcting Taxonomic Annotation Errors
This protocol helps ensure the accuracy of taxonomic data, which is fundamental for correctly identifying and classifying RND efflux pumps in genomic datasets.
Methodology Details:
- Heuristic Detection: This method uses the Boa language and Hadoop framework to process the entire NR database. It identifies potentially misclassified sequences by analyzing the provenance (source database) and frequency of each taxonomic annotation, combined with clustering information at 95% sequence similarity to identify outliers [49].
- Phylogeny-Aware Detection: This approach uses the Evolutionary Placement Algorithm (EPA) to place sequences into a known reference tree. Mislabeled sequences are identified as those placed in a phylogenetic location inconsistent with their provided taxonomic annotation [49].
- Functional Detection: Tools like MisPred and FixPred identify erroneous annotations by checking if sequence features violate established biological knowledge of proteins, such as domain integrity [49].
- Correction: For sequences identified as misclassified, the most probable taxonomic assignment is proposed based on the consensus from the heuristic analysis (e.g., the most frequent annotation within a cluster) or phylogenetic placement [49].
The Scientist's Toolkit: Research Reagent Solutions
| Item/Tool | Function in Context | Relevance to RND Efflux Pumps |
|---|---|---|
| BoaG / Hadoop Framework | A genomics-specific language and framework for large-scale exploration of sequence databases and their annotations [49]. | Enables analysis of massive datasets (like NR) to find misclassified RND efflux pump sequences. |
| Evolutionary Placement Algorithm (EPA) | A phylogeny-aware algorithm for identifying mislabeled sequences by placing them into a known reference tree [49]. | Helps validate the taxonomic origin of a putative RND efflux pump gene. |
| MisPred & FixPred | Tools that detect and correct misannotated sequences based on violations of protein knowledge (e.g., abnormal domain structure) [49]. | Identifies RND pump sequences with erroneous functional annotations that could mislead research. |
| VecScreen | A tool recommended by NCBI to screen DNA sequences for contamination from vectors, linkers, and primers [49]. | Ensures RND pump sequences are not artifactual contaminants before analysis or deposition. |
| InterPro / CDD | Databases and tools for classifying protein sequences into families and predicting domains and functional sites [49]. | Critical for confirming the presence of characteristic domains in RND efflux pumps. |
| DBCC CHECKDB | A SQL Server command for checking the logical and physical integrity of all objects in a database [47]. | Ensures the consistency of a local, curated database of efflux pump sequences. |
| chkdsk | A system utility to check the integrity of the file system. Note: Must be run only when SQL Server is stopped to avoid reporting transient errors [47]. | Verifies the health of the storage volume hosting critical research databases. |
Differentiating Between Clinically Relevant Resistance and Ancillary Physiological Functions
Frequently Asked Questions (FAQs)
1. What is the primary reason RND efflux pumps are often misclassified in resistance studies? RND efflux pumps are frequently misclassified because they are studied primarily in the context of antibiotic exposure. However, these pumps are ancient, core genomic elements whose primary evolutionary drivers are likely physiological functions, not antibiotic resistance. Their ability to confer multidrug resistance is often a fortuitous (or unfortunate) byproduct of their natural roles in detoxification and cellular homeostasis [12]. Consequently, observing pump overexpression during antibiotic treatment does not necessarily indicate that resistance is its primary biological function.
2. What key experimental evidence can distinguish a pump's primary physiological role from incidental antibiotic resistance? Key evidence includes:
- Induction by Natural Substances: Demonstration that pump expression is induced by natural compounds like bile salts, fatty acids, or bacterial metabolic byproducts, rather than solely by antibiotics [50] [12].
- Phenotypic Impact in Absence of Antibiotics: Observation of a significant growth, colonization, or virulence defect in pump-deficient mutants, even in antibiotic-free environments. For example, AcrAB-TolC in Salmonella enterica is crucial for cell invasion and virulence [51].
- Conservation Analysis: Phylogenetic studies showing that a pump is highly conserved across an entire genus, including non-pathogenic environmental species, suggest a core physiological function. For instance, the AdeIJK pump is conserved across all Acinetobacter species, indicating an ancient, essential role [52].
3. A clinical isolate shows elevated resistance to multiple antibiotics and has a mutation in a regulator gene (e.g., ramR). How can I confirm the role of the RND efflux pump in this resistance? A comprehensive confirmation protocol should be employed:
- Genotypic Confirmation: Sequence the local and global regulatory genes (e.g., ramR, ramA, acrR, marR) and the structural genes of the efflux pump operon to identify mutations [50] [9].
- Transcriptional Analysis: Quantify the mRNA expression levels of the pump genes (e.g., acrB) in the mutant strain compared to a wild-type control using RT-qPCR. Overexpression is a key indicator [50].
- Phenotypic Confirmation:
- MIC Reduction Assay: Determine the Minimum Inhibitory Concentration (MIC) of relevant antibiotics against the mutant strain in the presence and absence of a broad-spectrum Efflux Pump Inhibitor (EPI) like PAβN. A significant (e.g., 4-fold or greater) reduction in MIC with the EPI strongly implicates efflux activity [11] [53].
- Dye Accumulation Assay: Measure the intracellular accumulation of fluorescent substrate dyes (e.g., ethidium bromide) with and without an EPI. Increased dye accumulation in the presence of an EPI confirms active efflux [9] [54].
4. What are the most common non-antibiotic substances that induce RND efflux pump expression? Common inducers include substances bacteria encounter in their natural habitats, as summarized in the table below.
| Inducer Class | Specific Examples | Relevant Bacterial Species | Regulator Involved |
|---|---|---|---|
| Bile Salts [50] [12] | Cholic acid, deoxycholate | Salmonella enterica, E. coli | RamA, Rob |
| Fatty Acids [50] [12] | Decanoate | Escherichia coli | Rob |
| Host Defense Peptides [12] | Antimicrobial peptides | Neisseria gonorrhoeae | MtrR |
| Bacterial Metabolites [8] | Quorum-sensing signals (e.g., PQS) | Pseudomonas aeruginosa | Multiple |
| Metal Ions [51] [9] | Copper, Zinc | E. coli (CusABC) | CusR |
Troubleshooting Guides
Problem: Inconsistent EPI Efficacy in MIC Reduction Assays
Potential Causes and Solutions:
Cause 1: Substrate Specificity of the EPI.
- Solution: Not all EPIs are effective against all RND pumps. If the initial EPI (e.g., PAβN) shows no effect, consult the literature for an EPI known to target your specific pump of interest. For example, some pyridopyrimidine derivatives are AcrAB/MexAB-specific [53].
Cause 2: Inadequate EPI Concentration or Stability.
- Solution: Perform a dose-response curve with the EPI to ensure you are using a concentration that is effective but not inherently toxic to the bacteria. Also, verify the stability of the EPI in your assay medium and incubation conditions.
Cause 3: Redundancy in Efflux Systems.
- Solution: The bacterium may possess multiple efflux pumps with overlapping substrate ranges. Knocking out the specific pump genetically and repeating the MIC assay provides the most definitive proof of its involvement.
Problem: Determining if Pump Overexpression is a Direct Cause of Clinical Resistance
Step-by-Step Diagnostic Protocol:
- Isolate the Strain: Obtain the clinical isolate and a reference strain (e.g., ATCC type strain) for comparison.
- Profile Resistance: Determine the MICs for a panel of antibiotics representing different classes (e.g., fluoroquinolones, β-lactams, chloramphenicol, macrolides).
- Quantify Pump Expression: Perform RT-qPCR to measure the expression levels of key pump genes (e.g., acrB, mexB) normalized to a housekeeping gene.
- Inhibit the Pump: Repeat the MIC tests for the resistant antibiotics in the presence of a validated EPI.
- Sequence Regulators: Sequence known regulatory genes (e.g., ramR, marR, mexR) to identify inactivating mutations.
- Correlate Findings: Clinically relevant resistance is strongly indicated by a correlation between high-level antibiotic resistance, pump overexpression, a significant reduction in MIC with an EPI, and the presence of a loss-of-function mutation in a repressor gene.
Experimental Protocols
Protocol 1: Ethidium Bromide Accumulation Assay for Efflux Pump Activity
Principle: This fluorometric assay measures the real-time accumulation of a fluorescent efflux pump substrate (Ethidium Bromide, EtBr) inside bacterial cells. Active efflux keeps intracellular EtBr low. Inhibition of efflux pumps leads to increased accumulation and fluorescence.
Materials:
- Bacterial broth culture in mid-log phase
- Ethidium Bromide (EtBr) stock solution
- Efflux Pump Inhibitor (EPI) stock solution (e.g., CCCP, PAβN)
- Appropriate buffer (e.g., PBS or minimal medium)
- Fluorometer or fluorescence microplate reader
- 37°C water bath or incubator
Procedure:
- Harvest and Wash: Harvest bacterial cells by centrifugation (e.g., 5,000 x g, 10 min). Wash the cell pellet twice with assay buffer to remove residual growth medium.
- Pre-incubate with EPI: Resuspend the cell pellet to a standardized optical density (OD~600nm~ ≈ 0.5) in buffer with or without (control) a sub-inhibitory concentration of EPI. Incubate for 10-15 minutes at 37°C.
- Initiate Uptake: Add EtBr to the cell suspension to a final concentration (e.g., 1-2 μg/mL) and immediately transfer to a pre-warmed cuvette or microplate well.
- Measure Fluorescence: Immediately begin measuring fluorescence at excitation/emission wavelengths of ~530/585 nm every 30-60 seconds for at least 30 minutes at 37°C.
- Data Analysis: Plot fluorescence intensity versus time. A steeper initial slope and a higher final fluorescence plateau in the EPI-treated sample compared to the untreated control indicate successful inhibition of efflux activity.
Protocol 2: RT-qPCR for Quantifying Efflux Pump Gene Expression
Principle: Reverse Transcription quantitative Polymerase Chain Reaction (RT-qPCR) is used to quantify the mRNA transcript levels of efflux pump genes relative to a stable reference gene.
Materials:
- RNA extraction kit (e.g., spin-column based)
- DNase I, RNase-free
- Reverse transcription kit
- qPCR master mix
- Sequence-specific primers for target (e.g., acrB, mexB) and reference genes (e.g., rpoB, rrs)
- Real-time PCR instrument
Procedure:
- RNA Extraction: Extract total RNA from bacterial cultures harvested at the desired growth phase. Treat the RNA with DNase I to remove genomic DNA contamination. Quantify RNA purity and concentration.
- Reverse Transcription: Convert equal amounts of total RNA (e.g., 1 μg) into cDNA using a reverse transcription kit with random hexamers or gene-specific primers.
- qPCR Setup: Prepare qPCR reactions containing cDNA template, qPCR master mix, and forward and reverse primers for both the target and reference genes. Include no-template controls (NTCs) for each primer set.
- Amplification and Detection: Run the qPCR program according to your master mix protocol (typically: initial denaturation, 40 cycles of denaturation/annealing/extension).
- Data Analysis: Calculate the cycle threshold (C~t~) values. Use the comparative C~t~ method (2^−ΔΔC~t~) to determine the relative fold change in gene expression in the test sample compared to a calibrator sample (e.g., wild-type strain).
Signaling Pathway Diagram
The following diagram illustrates a canonical regulatory pathway for RND efflux pump expression, integrating signals from both antibiotics and natural physiological inducers.
Diagram Title: Integrated Regulation of RND Efflux Pumps
Research Reagent Solutions
| Reagent / Material | Primary Function in Experimental Context |
|---|---|
| Phenylalanine-arginine β-naphthylamide (PAβN) | A broad-spectrum efflux pump inhibitor (EPI) used in MIC reduction and accumulation assays to confirm efflux-mediated resistance [11] [53]. |
| Carbonyl cyanide m-chlorophenyl hydrazone (CCCP) | A proton motive force (PMF) uncoupler. Used as an EPI to confirm PMF-dependent efflux activity in assays like ethidium bromide accumulation [53]. |
| Ethidium Bromide (EtBr) | A fluorescent substrate for many RND pumps. Used as a probe in fluorometric accumulation assays to measure real-time efflux pump activity [9] [54]. |
| Real-Time PCR System | Instrumentation required for performing RT-qPCR to quantify the relative mRNA expression levels of efflux pump and regulatory genes [50]. |
| Custom Gene Knockout Kits (e.g., CRISPR-based) | Used for the targeted deletion of specific efflux pump genes to create isogenic mutant strains, which are crucial for definitively assigning function and separating resistance from physiological roles [51] [52]. |
FAQ: Clarifying Core Concepts and Definitions
What are the primary RND efflux pump families, and how are they functionally distinguished?
The Resistance-Nodulation-cell Division (RND) superfamily in Gram-negative bacteria primarily includes three families, distinguished by their substrate specificity and phylogenetic clades [4] [1]:
- HME (Heavy Metal Efflux): Primarily exports metallic cations (e.g., Zn²⁺, Co²⁺, Ni²⁺, Cd²⁺) [4] [1].
- HAE-1 (Hydrophobe/Amphiphile Efflux-1): Exports a broad range of organic substrates, including antibiotics, detergents, bile salts, and solvents. This family is most frequently implicated in clinical multidrug resistance (MDR) phenotypes [4] [9].
- NFE (Nodulation Factor Exporter): Less characterized functionally; initial studies described a role in exporting lipooligosaccharides, but some members are also involved in MDR or even metal ion export [4].
What is the central problem in distinguishing HAE-1 from NFE permeases?
The core issue is the overlapping phylogenetic and functional distribution between HAE-1 and NFE families. A 2024 phylogenetic study revealed that these families do not form distinct, monophyletic clades but are intermingled, making classification based on sequence data alone ambiguous [4]. This is compounded by functional studies showing that some pumps classified as NFE can confer multidrug resistance, a trait traditionally associated with HAE-1 [4].
What is the proposed HAE-4 family, and what is its ecological significance?
The HAE-4 family is a newly proposed phylogenetic clade within the RND superfamily based on genomic analysis [4]. Its primary significance is its predominance in marine bacterial strains and genomes. This stands in contrast to the HAE-1 family, which is significantly less abundant in marine environments but abundant in other niches like the rhizosphere. This suggests HAE-4 pumps play a crucial and specialized role in the adaptation of bacteria to oceanic ecosystems [4].
Troubleshooting Guide: Resolving Classification Ambiguity in the Lab
Problem: Inconsistent Phylogenetic Clading of a Putative HAE-1 Permease
Issue: Your phylogenetic tree shows a permease sequence clustering within a proposed NFE clade, but your experimental data suggests it confers antibiotic resistance.
Solution:
- Verify Your Phylogenetic Framework:
- Method: Include the TCDB (Transporter Classification Database) reference sequences for HAE-1, NFE, and HME families in your multiple sequence alignment [4].
- Rationale: This anchors your analysis to the standard, accepted families and helps identify the core clades as defined by the broader scientific community. The 2024 study proposes restricting the "HAE-1 family" specifically to two sister phylogenetic clades that contain most known multidrug resistance pumps [4].
- Re-analyze Alignment and Tree Construction:
- Protocol:
- Perform multiple sequence alignment using tools like Muscle v3.8.31 or Clustal Omega v1.2.1 with default parameters [4].
- Use Gblock v0.91b with default settings to eliminate poorly aligned positions and reduce noise [4].
- Construct a Maximum Likelihood phylogenetic tree using IQ-Tree v1.6.5 with a model like
LG+F+R6(selected via Bayesian Information Criterion) and assess node support with 1000 ultrafast bootstraps [4].
- Expected Outcome: This rigorous process may reveal that your sequence falls within one of the redefined HAE-1 sister clades, resolving the apparent contradiction. If it firmly places within an NFE clade, it provides evidence for the functional overlap between the families.
- Protocol:
Problem: Determining the Ecological Role of an Uncharacterized RND Permease
Issue: You have identified a previously uncharacterized RND permease in a bacterial genome and want to generate a hypothesis about its primary function (e.g., metal resistance, drug efflux, niche adaptation).
Solution:
- Conduct a Preliminary Phylogenetic Assignment:
- Follow the phylogenetic protocol above to place your permease in one of the major families (HME, HAE-1, NFE, or the proposed HAE-4) [4].
- Leverage Ecological Metadata from Genomic Studies:
- Action: Cross-reference the phylogenetic clade with established ecological correlations from large-scale genomic and metagenomic studies.
- Interpretation Guide:
- HME family: Strongly correlated with environments contaminated with heavy metals. Consider testing resistance to metals like Cu²⁺, Zn²⁺, and Co²⁺ [4].
- HAE-1 family: Highly abundant in the rhizosphere, suggesting a role in resisting plant-derived antimicrobials or in colonization. Also predominant in clinical isolates. Test against a panel of common antibiotics [4].
- HAE-4 family: Predominant in marine bacterial strains. Its specific substrates are not yet well-defined, but its distribution points to adaptation to oceanic conditions [4].
Table 1: Quantitative Distribution of RND Permease Families in Gram-Negative Bacteria
| Family | Percentage of All RND Pumps | Average per Genome | Primary Substrate(s) | Key Ecological Correlation |
|---|---|---|---|---|
| HME | 21.8% | ~1.5 | Metal ions (Cu²⁺, Zn²⁺, Co²⁺, etc.) | Metal-contaminated environments [4] |
| HAE-1 | 41.8% | ~2.8 | Antibiotics, bile salts, detergents, solvents | Rhizosphere, clinical settings [4] |
| NFE | Part of overlapping HAE-1/NFE distribution | Lipooligosaccharides, some drugs | Functional and phylogenetic overlap with HAE-1 [4] | |
| HAE-4 (proposed) | Predominant in specific niches | Not quantified globally | Not yet fully characterized | Marine environments [4] |
Data derived from analysis of 920 representative Gram-negative bacterial genomes, identifying 6,205 RND permease genes [4].
Experimental Protocols for Functional Validation
Protocol 1: qPCR Assay for Tracking HME and HAE-1 Gene Abundance in Environmental Samples
This protocol is used to confirm the ecological role of HME and HAE-1 pumps by quantifying their gene abundance in different environments [4].
- Primer Design: Design "universal" primers that specifically target conserved regions within the RND permease domains of the HME and HAE-1 families, respectively.
- Nucleic Acid Extraction: Extract total community DNA from your environmental samples (e.g., soil from a metal-polluted site, rhizosphere soil, and pristine marine sediment).
- Quantitative Polymerase Chain Reaction (qPCR):
- Prepare reaction mixtures for each sample in triplicate, using the designed HME- and HAE-1-specific primers and a fluorescent DNA-binding dye.
- Run the qPCR protocol with appropriate cycling conditions.
- Use a standard curve of a known copy number of the target gene to quantify absolute abundance.
- Data Analysis: Normalize the gene copy numbers to the weight of the extracted environmental sample. The 2024 study confirmed a significant increase in HME permease genes in metal-contaminated environments compared to controls, while HAE-1 genes were particularly abundant in the rhizosphere [4].
Protocol 2: Assessing the Impact of Horizontal Gene Transfer (HGT) vs. Gene Duplication
This methodology helps determine the evolutionary mechanism behind the expansion of RND pumps in a genome [4].
- Genomic Context Analysis:
- Action: For the RND operon of interest, analyze the flanking genomic regions for signatures of HGT, such as the presence of mobile genetic elements (plasmids, transposons, integrons), phage integration sites, or a GC content that deviates significantly from the genomic average.
- Phylogenetic Congruence Testing:
- Action: Construct a phylogenetic tree of the RND permease and compare its topology to a species tree based on core housekeeping genes.
- Interpretation:
- Incongruent Topologies: Suggest a history of Horizontal Gene Transfer. For example, if your permease from E. coli clusters closely with a permease from a distantly related Pseudomonas species, this is strong evidence for HGT [4] [9].
- Congruent Topologies & Gene Clustering: If the tree mirrors the species tree and the genome contains multiple, closely linked paralogs of the permease, this is evidence for expansion through local gene duplication events [4].
The Scientist's Toolkit: Key Research Reagent Solutions
Table 2: Essential Reagents and Resources for RND Efflux Pump Research
| Reagent / Resource | Function and Application in Research |
|---|---|
| TCDB Reference Sequences | Provides the standard, reference protein sequences for HME, HAE-1, and NFE families, essential for phylogenetic framework and classification [4]. |
| Universal qPCR Primers for HAE-1/HME | Allows for the quantification of efflux pump gene abundance in diverse environmental or clinical metagenomic samples to study ecology and prevalence [4]. |
| RND Permease-Knockout Strains | Isogenic bacterial strains (e.g., E. coli ΔacrB) used as controls to confirm the specific function of a pump via complementation assays or comparative susceptibility testing [9]. |
| Strain-Specific OMP/MFP Pairs | For functional cloning, the RND permease must be co-expressed with its native Outer Membrane Factor and Membrane Fusion Protein partners to reconstitute a functional tripartite complex [9] [22]. |
Visualizing RND Pump Structure, Function, and Classification
Diagram 1: RND Family Classification and Substrate Specificity
Diagram 2: Tripartite Structure of an RND Efflux Complex
Optimizing Primer Design and Functional Screens for Environmental and Clinical Isolates
Frequently Asked Questions: Primer Design & Optimization
What are the critical parameters for designing effective PCR primers? Effective primers are the foundation of reliable PCR results. The table below summarizes the key design criteria to follow [55] [56].
| Parameter | Optimal Range | Rationale & Tips |
|---|---|---|
| Primer Length | 18–24 nucleotides [55] [56] | Shorter primers bind more efficiently; longer primers can reduce yield and specificity [56]. |
| Melting Temperature (Tm) | 65–75°C for each primer; within 5°C for a primer pair [55] | Ensures both primers bind simultaneously with high specificity during the annealing step. |
| GC Content | 40–60% [55] [56] | Balanced stability. A very high GC content can promote non-specific binding. |
| GC Clamp | Presence of G or C at the 3' end [55] | Strengthens the binding at the 3' end due to stronger hydrogen bonding, crucial for enzyme initiation. |
| Secondary Structures | Avoid runs of 4+ identical bases, dinucleotide repeats, and self-complementary sequences [55] [56] | Prevents primer-dimer formation and hairpins, which compete with target amplification and reduce yield. |
How can I improve primer specificity for ARG detection? To accurately classify ambiguous ARG types, especially for highly diverse gene families, specificity is paramount.
- Leverage Comprehensive Databases: Design primers based on alignments of all known sequences for a target ARG from databases like KEGG (orthology grade >70%) to ensure broad coverage of genetic diversity [57].
- In Silico Validation: Always check candidate primer sequences against the full genome (chromosomes and plasmids) of your test strains to confirm the absence of non-specific binding sites outside your target region [57].
- Experimental Validation: An optimized qPCR assay should demonstrate high amplification efficiency (>90%), good linearity (R² > 0.980), and reproducibility across experiments [57].
My functional screens are missing key degraders or resistant isolates. Why? Traditional shaking culture (TSC) methods have inherent limitations [58]:
- Narrow Screening Range: TSC can miss functional isolates that are only capable of metabolizing specific substrates or are sensitive to metabolic intermediates produced by other community members [58].
- Low Throughput and Efficiency: TSC is time-consuming and labor-intensive, making it unsuitable for screening large numbers of isolates [58].
- Solution: Implement an Enzyme Activity Assay (EAA) method. This approach uses the activity of an isolate's whole enzyme suite as a proxy for its metabolic function, which shows a strong positive correlation (r = 0.97) with its actual contaminant degradation capability. This method broadens the screening scope and is more than 16 times more efficient than TSC when screening 100 isolates [58].
What are common regulatory mutations causing RND efflux pump overexpression in clinical isolates? In clinical settings, constitutive overexpression of RND pumps often results from mutations in their regulatory genes [59] [52].
- For the AdeABC pump in Acinetobacter baumannii, look for mutations in the two-component regulatory system AdeRS. Mutational hot spots exist near histidine 149 in AdeS and in the DNA-binding domain of AdeR [59].
- The AdeFGH system is regulated by a LysR-type transcriptional regulator, AdeL, and its overexpression has been linked to mutations in this gene [59].
- AdeIJK is an evolutionarily ancient, core efflux system in Acinetobacter and is repressed by AdeN. Mutations in adeN lead to its overexpression and increased multidrug resistance [59] [52].
Troubleshooting Guides
Problem: Non-specific Amplification or Primer-Dimer Formation in ARG PCR
This issue can lead to false-positive results and misclassification of ARG types.
| Symptom | Possible Cause | Solution |
|---|---|---|
| Multiple bands or smears on gel | Annealing temperature too low; primer specificity is poor. | - Optimize annealing temperature in 2°C increments.- Use a hot-start polymerase.- Redesign primers with stricter parameters, checking for off-target binding in silico. |
| Primer-dimer band ~50-100 bp | High 3'-end complementarity between forward and reverse primers. | - Use software to analyze and minimize inter-primer homology (self 3'-complementarity) [56].- Increase primer concentration and optimize template DNA concentration to avoid primer-template imbalance. |
Problem: Inconsistent Results in Efflux Pump Functional Screens
Variability in results can stem from uncontrolled genetic or physiological factors.
| Symptom | Possible Cause | Solution |
|---|---|---|
| Variable resistance levels across replicates | Natural variations in pump expression; unstable regulatory mutations. | - Use genetically defined, single-colony isolates.- Include a known positive control strain (e.g., a strain with a confirmed adeRS mutation) in every assay [59].- Measure pump gene expression (e.g., adeB, adeG, adeJ) via qRT-PCR to correlate phenotype with genotype [59]. |
| No potentiation by a known EPI | The EPI cannot penetrate the outer membrane; the primary resistance mechanism is not efflux. | - For tough Gram-negatives like P. aeruginosa, use the EPI in combination with an outer membrane permeabilizer like Polymyxin B nonapeptide (PMBN) [60].- Determine the MIC of the antibiotic alone to confirm that efflux is a contributing resistance mechanism. |
The Scientist's Toolkit: Key Research Reagents
This table lists essential materials for conducting experiments in ARG characterization and efflux pump research.
| Reagent / Material | Primary Function & Application |
|---|---|
| Phusion High-Fidelity DNA Polymerase | Used for accurate amplification of efflux pump genes and regulators for sequencing, thanks to its high fidelity [59]. |
| Specific Primer Pairs (e.g., for adeB, adeRS) | Detecting and quantifying the presence and expression of specific RND pump components and their regulators in clinical isolates via PCR and qRT-PCR [59]. |
| TRIzol Reagent | A ready-to-use solution for the high-quality isolation of total RNA from bacterial cells for subsequent gene expression analysis (qRT-PCR) [59]. |
| MBX2319 (Pyranopyridine EPI) | A research-grade efflux pump inhibitor that specifically targets the AcrB transporter in E. coli and related RND pumps, used to confirm efflux-mediated resistance [60]. |
| Polymyxin B Nonapeptide (PMBN) | A permeabilizer that disrupts the outer membrane of Gram-negative bacteria like P. aeruginosa, allowing EPIs and antibiotics to better access their targets [60]. |
| MicroResp System | A respirometric technology adapted for high-throughput analysis of microbial mineralizing function in enzyme activity assays (EAA) for functional screening [58]. |
Detailed Experimental Protocols
Protocol 1: Screening for RND Efflux Pump Overexpression in Clinical Isolates
This protocol outlines the steps to genotype and phenotype clinical isolates for prevalent RND efflux pumps like AdeABC in A. baumannii [59].
1. Genotypic Screening by PCR
- DNA Extraction: Purify genomic DNA from overnight cultures of test isolates.
- Primer Design: Use previously validated primer sets specific for pump genes (e.g., adeA, adeB, adeC) and their regulators (e.g., adeRS) [59].
- PCR Amplification: Set up reactions with a high-fidelity polymerase (e.g., Phusion). Use a thermocycler program with an extension temperature of 72°C suitable for the polymerase and primer annealing temperatures.
- Sequencing & Analysis: Purify PCR products and sequence them. Analyze the sequences of regulatory genes like adeRS for mutations by comparing them to a reference susceptible strain.
2. Phenotypic Confirmation by qRT-PCR
- RNA Isolation: Grow bacteria to mid-exponential phase in antibiotic-free media. Extract total RNA using a reagent like TRIzol and treat with a DNase to remove genomic DNA contamination [59].
- cDNA Synthesis: Perform reverse transcription on the purified RNA.
- qPCR: Quantify the expression of pump genes (e.g., adeB) using specific primers and a system like SYBR green. Normalize the expression data to a housekeeping gene (e.g., rpoB). A significant overexpression (e.g., >5-10 fold) in clinical isolates compared to a reference strain confirms the phenotype [59].
Protocol 2: High-Throughput Functional Screening of Isolates Using Enzyme Activity Assay (EAA)
This method efficiently screens for functional isolates (e.g., hydrocarbon degraders) based on their collective enzyme activity, overcoming limitations of traditional screening [58].
1. Sample Preparation & Primary Enrichment
- Collect environmental samples (e.g., contaminated soil).
- Enrich for target microorganisms by incubating samples in a medium containing the contaminant (e.g., n-hexadecane) as the sole carbon source.
2. Enzyme Activity Assay (EAA)
- Prepare Inoculum: Sub-culture candidate isolates from the enrichment to a fresh, defined medium (e.g., buffered peptone water) to remove protective compounds from the storage medium [58].
- Harvest Whole Enzymes: Culture isolates and prepare a cell-free extract containing the metabolic enzymes.
- Measure Activity: Use a high-throughput system like the MicroResp to measure the mineralization of the target substrate (e.g., CO₂ release from n-hexadecane) by the whole enzyme extract. This serves as a direct functional proxy [58].
3. Data Analysis & Isolation
- Correlate and Select: Isolates showing high whole enzyme activity (strong positive correlation with function) are selected for further characterization and use in constructing optimized, stable functional microflora [58].
FAQs on Genetic Rearrangements in Antimicrobial Resistance
Q1: What specific genetic rearrangement events complicate the classification of Antibiotic Resistance Genes (ARGs) in RND efflux pumps? The primary genetic events that complicate ARG classification are gene duplications, gene losses, and horizontal gene transfer (HGT) events [61] [62]. In the context of RND efflux pumps, these events can lead to the presence of multiple, similar paralogous genes (ohnologues from whole genome duplications, inparalogues, or outparalogues) within a single genome, as well as the acquisition of xenologues from distantly related bacteria via HGT [61] [62]. This mosaicism obscures evolutionary relationships, making it difficult to distinguish between vertically inherited genes and horizontally acquired ones, and to determine the original function and resistance profile of a specific pump [61].
Q2: During genomic analysis, I suspect horizontal gene transfer of an RND efflux pump. What is the first step in confirmation? The first step is typically a phylogenetic analysis to identify phylogenetic mismatches [62]. You would compare the evolutionary history of the RND efflux pump gene to the evolutionary history of its host organism. If the gene tree is strongly discordant with the species tree (e.g., the pump gene from a Klebsiella pneumoniae isolate is most closely related to a pump from a distantly related species like Acinetobacter baumannii), this is a key signature of HGT [62].
Q3: My analysis of RND efflux pump operons shows inconsistent results. Could gene loss be a factor? Yes, gene loss is a major factor that can confound analysis [61]. Lineage-specific loss of genes after a duplication event (e.g., a whole genome duplication) can create a pattern where paralogous genes appear to be orthologous between two species. This is known as pseudo-orthology and can mislead the interpretation of evolutionary relationships and functional assignments [61].
Q4: Are there alignment-free methods to identify genomic rearrangements like inversions or translocations in bacterial pathogens? Yes, alignment-free methods exist that can detect large-scale and small-scale genomic rearrangements [63]. These methods, such as the Smash tool, use data compression techniques to model the information content of a reference and target sequence [63]. By identifying regions with similar information content, they can visualize rearrangements like inversions and translocations without performing sequence alignments, which is useful for comparing closely related species like human and chimpanzee [63].
Troubleshooting Guide for Experimental Analysis
| Problem | Possible Cause | Solution |
|---|---|---|
| Low or No Amplification of Target ARG | Poor DNA template quality or quantity [64]. | Check DNA purity and concentration using a spectrophotometer (e.g., Nanodrop). Increase template concentration or use a fresh preparation [64]. |
| Non-Specific PCR Bands | Suboptimal primer design or annealing temperature [64]. | Re-design primers to avoid self-complementarity and repetitive sequences. Perform a gradient PCR to optimize the annealing temperature (Tm) [64]. |
| Inconsistent/Erratic qPCR Curves | Pipetting errors or issues with the detection system [64]. | Calibrate pipettes and use fresh, diluted standards. Include a normalization dye (e.g., ROX) and calibrate the optics of your qPCR system [64]. |
| Ambiguous Phylogenetic Trees for RND Pumps | Underlying genetic rearrangements (HGT, gene loss) confusing the evolutionary signal [61] [62]. | Employ additional bioinformatic methods to detect HGT, such as looking for atypical sequence composition (e.g., GC content) in the gene compared to the core genome [62]. Test for recombination within the gene sequence. |
| Cannot Determine Orthology/Paralogy | Unaccounted for gene duplication and subsequent loss events [61]. | Use more sophisticated phylogenetic analysis that considers and tests different evolutionary scenarios, including duplication and loss. Be cautious of terms like pseudo-orthology [61]. |
Experimental Protocols for Detecting Rearrangements
Protocol 1: Detecting Horizontal Gene Transfer with Phylogenetic Incongruence
This protocol uses bioinformatic analysis to identify HGT by comparing gene trees to species trees [62].
- Gene Sequence Selection: Identify the RND efflux pump gene(s) of interest from your isolate(s).
- Ortholog Collection: Gather putative orthologs of this gene from a diverse set of reference bacterial species.
- Multiple Sequence Alignment: Perform a high-quality multiple sequence alignment using a tool like MUSCLE or MAFFT.
- Phylogenetic Tree Construction:
- Build a phylogenetic tree for the RND efflux pump gene alignment.
- Build a second phylogenetic tree using a set of conserved, essential "housekeeping" genes (e.g., 16S rRNA, rpoB) from the same species to represent the accepted species tree.
- Incongruence Testing: Statistically compare the two trees (e.g., using the Approximately Unbiased test in IQ-TREE). Significant incongruence suggests the RND pump gene may have been horizontally transferred [62].
Protocol 2: Alignment-Free Rearrangement Detection
This protocol outlines the use of the Smash tool to find rearrangements between two sequences without alignment [63].
- Input Preparation: Prepare your reference and target sequences in FASTA format. The sequences can be entire chromosomes or smaller genomic regions.
- Preprocessing: The tool will preprocess the sequences, converting all symbols to the {A, C, G, T} alphabet. Non-standard symbols (like 'N') are replaced with random nucleotides [63].
- Model Building: Smash uses a Finite-Context Model (FCM) to build a statistical model of the information content in the reference sequence [63].
- Information Calculation: For each position in the target sequence, the tool calculates the number of bits required to represent that symbol using the model from the reference. This creates an information profile [63].
- Segmentation and Visualization: Regions in the target with low information requirements (high information sharing) are identified by comparing a smoothed version of the profile to a user-defined threshold
T. The tool produces an SVG image showing homologous regions between the two sequences, including inversions [63].
Signaling Pathways and Regulatory Networks in RND Pump Expression
The following diagram visualizes the complex regulatory network controlling the expression of RND efflux pumps, such as MexAB-OprM in P. aeruginosa, which can be perturbed by genetic rearrangements.
RND Pump Regulatory Network
The Scientist's Toolkit: Essential Research Reagents
| Reagent / Solution | Function in Experiment |
|---|---|
| High-Fidelity DNA Polymerase | Critical for accurate amplification of target genes (e.g., RND pump operons) for subsequent sequencing or cloning, minimizing PCR-induced errors [64]. |
| Miniprep Kit (Plasmid DNA Extraction) | For the rapid purification and concentration of high-quality plasmid DNA, which may be used for cloning efflux pump genes or expressing regulators [64]. |
| Specific Guide RNAs (gRNAs) | When using CRISPR-Cas9 systems for functional validation, specific gRNAs are designed to target and edit the genomic locus of the RND pump gene in the bacterial chromosome [65]. |
| High-Fidelity Cas9 Variant | Engineered Cas9 protein with reduced off-target activity, crucial for ensuring that edits are made only to the intended RND pump gene and not to paralogues or other genomic regions [65]. |
| Synthropic Growth Media Additives (e.g., Bile Salts) | Used in in vitro experiments to induce the expression of RND efflux pumps (e.g., via the RamA/RamR pathway) to study their adaptive resistance response [50]. |
Benchmarking and Validation: Establishing Gold Standards for ARG Classification
The resistance-nodulation-division (RND) family of efflux pumps are major contributors to multidrug resistance (MDR) in Gram-negative bacteria, significantly complicating treatment of bacterial infections worldwide. Among these, three systems—AcrAB-TolC in Escherichia coli, MexAB-OprM in Pseudomonas aeruginosa, and AdeIJK in Acinetobacter baumannii—stand out as clinically significant determinants of intrinsic and acquired antibiotic resistance. These tripartite protein complexes span the entire cell envelope of Gram-negative bacteria, actively extruding a diverse array of antimicrobial compounds from the cell thereby reducing intracellular antibiotic accumulation to subtoxic levels. The operational mechanism of these pumps involves a proton-motive force driven process wherein substrate binding in the periplasmic domain triggers conformational changes that facilitate drug translocation across the inner membrane, through the periplasmic adaptor protein, and out via the outer membrane channel. Understanding the nuanced differences in substrate specificity, regulatory mechanisms, and structural features of these pumps is fundamental to developing novel therapeutic strategies to combat multidrug resistant infections, which are associated with millions of deaths globally each year [66] [67] [53].
This technical support document provides a comparative analysis of these three major RND efflux systems, focusing on their molecular architectures, operational mechanisms, and substrate profiles. The document is structured to serve as a practical resource for researchers investigating efflux-mediated resistance mechanisms, offering troubleshooting guidance for common experimental challenges and clarifying ambiguities in resistance gene classification. By synthesizing current structural and functional data, we aim to equip scientists with the necessary tools to accurately characterize RND pump function and contribution to bacterial resistance phenotypes in clinical and laboratory settings.
System Architectures & Molecular Mechanisms
Comparative Architecture of Tripartite RND Pumps
All three efflux systems share a fundamental tripartite architecture consisting of an inner membrane RND transporter, a periplasmic membrane fusion protein (MFP), and an outer membrane factor (OMF) protein. Despite this common blueprint, significant differences exist in their structural organization and component interactions, which contribute to their functional diversity and organism-specific adaptations.
Table 1: Comparative Architecture of Major RND Efflux Pumps
| Component | AcrAB-TolC | MexAB-OprM | AdeIJK |
|---|---|---|---|
| Organism | Escherichia coli | Pseudomonas aeruginosa | Acinetobacter baumannii |
| RND Transporter | AcrB (113.6 kDa) | MexB (~110 kDa) | AdeB (~110 kDa) |
| MFP Adaptor | AcrA (42.2 kDa) | MexA (~40 kDa) | AdeA (~40 kDa) |
| OMF Channel | TolC (53.7 kDa) | OprM (~50 kDa) | AdeK (~50 kDa) |
| Transmembrane Helices (RND) | 12 per protomer (36 total trimer) | 12 per protomer (36 total trimer) | 12 per protomer (36 total trimer) |
| Periplasmic Domains | Porter Domain (PN1, PN2, PC1, PC2), Funnel Domain | Porter Domain (PN1, PN2, PC1, PC2), Funnel Domain | Porter Domain (PN1, PN2, PC1, PC2), Funnel Domain |
| Regulatory Proteins | AcrR, AcrS, MarA, SoxS, Rob, AcrZ | MexR, NalC, NalD, MexT, ArmR | AdeN, AdeS/AdeR (Two-component system) |
| Complex Stoichiometry | AcrB(3):AcrA(6):TolC(3) | MexB(3):MexA(6):OprM(3) | AdeI(3):AdeJ(6):AdeK(3) |
The inner membrane RND transporters (AcrB, MexB, and AdeI) function as homotrimers, with each protomer containing 12 transmembrane helices that form the proton translocation channel and extensive periplasmic domains responsible for substrate recognition and binding [66] [68]. The periplasmic MFPs (AcrA, MexA, and AdeJ) adopt hexameric assemblies that bridge the inner and outer membrane components, facilitating energy transduction and complex stability [66] [22]. The OMF components (TolC, OprM, and AdeK) form trimeric β-barrel channels embedded in the outer membrane, serving as the final exit conduit for extruded substrates [69].
Structural studies have revealed that the AdeB transporter from A. baumannii adopts predominantly a resting state (OOO conformation) where all protomers are in a conformation devoid of transport channels or antibiotic binding sites. However, approximately 10% of protomers adopt an intermediate state (L*OO conformation) where transport channels lead to a closed substrate binding pocket, suggesting potential mechanistic differences in drug recognition compared to AcrB and MexB [10].
Functional Rotating Mechanism and Substrate Transport
RND transporters operate through a sophisticated functional rotating mechanism wherein each protomer within the trimer cycles consecutively through three distinct conformational states: loose (L, access), tight (T, binding), and open (O, extrusion) [10] [68] [22]. This asymmetric cycling creates a peristaltic pump action that drives substrate translocation from the periplasm through the OMF channel to the external environment.
The transport cycle initiates with substrate binding in the access pocket of the L-state protomer, followed by transfer to the deep binding pocket in the T-state conformation. Proton influx through the transmembrane domain then triggers a conformational shift to the O-state, facilitating substrate release through the exit channel toward the OMF component. The sequential progression through these states enables continuous efflux, with each protomer adopting a different conformation at any given time [10] [68]. Recent evidence suggests that AdeB may employ a variation of this mechanism, with its L* state potentially representing an alternative intermediate in the transport cycle [10].
Substrate capture occurs primarily from the periplasm and the interface between the cytoplasmic membrane and periplasm, allowing these pumps to effectively remove antibiotics that have penetrated the outer membrane barrier but have not yet reached their cytoplasmic targets [5]. This periplasmic capture mechanism is particularly effective against hydrophilic β-lactam antibiotics, which accumulate primarily in the periplasmic space where they target penicillin-binding proteins.
Substrate Specificity & Resistance Profiles
Comparative Substrate Spectra
While all three pumps demonstrate broad substrate polyspecificity, each exhibits unique preferences and efficiency profiles against different classes of antimicrobial agents. These differences reflect the distinct ecological niches and resistance challenges faced by their respective bacterial hosts.
Table 2: Substrate Specificity and Resistance Profiles
| Antibiotic Class | AcrAB-TolC | MexAB-OprM | AdeIJK |
|---|---|---|---|
| β-Lactams | Penicillins, Cephalosporins, Carbapenems | Penicillins, Cephalosporins, Carbapenems | Carbapenems, Cephalosporins |
| Fluoroquinolones | Ciprofloxacin, Levofloxacin, Norfloxacin | Ciprofloxacin, Levofloxacin | Levofloxacin, Ciprofloxacin |
| Tetracyclines | Tetracycline, Doxycycline, Tigecycline | Tetracycline, Minocycline | Tetracycline, Doxycycline, Tigecycline |
| Macrolides | Erythromycin, Azithromycin | Erythromycin | Erythromycin, Clarithromycin |
| Aminoglycosides | Limited activity | Limited activity | Tobramycin, Amikacin, Gentamicin |
| Chloramphenicol | Yes | Yes | Yes |
| Rifampicin | Yes | Yes | Yes |
| Novobiocin | Yes | Yes | Yes |
| Fusidic Acid | Yes | Yes | Yes |
| Dyes | Ethidium, Acriflavine, Rhodamine | Ethidium, Acriflavine | Ethidium, Rhodamine 6G |
| Detergents | Bile salts, SDS, Triton X-100 | Bile salts, SDS | Bile salts, SDS |
| Disinfectants | Yes | Yes | Yes |
Comparative studies indicate that AdeABC confers higher resistance in E. coli towards polyaromatic compounds but lower resistance towards certain antibiotic compounds compared to AcrAB-TolC [10]. Unlike AcrB, AdeB has been reported to confer resistance to aminoglycoside antibiotics in A. baumannii, though the contribution of AdeABC alone to aminoglycoside resistance remains somewhat controversial with some studies suggesting it is essential but not the sole factor [10].
The molecular determinants of substrate specificity primarily reside in the porter domain of the RND transporter, particularly in the proximal binding pocket (between PC1 and PC2 subdomains) and distal binding pocket (between PC1 and PN2 subdomains), which are separated by a switch loop (G-loop) [66] [22]. Conformational flexibility in this loop is critical for accommodating diverse substrates, with mutations affecting transport of larger macrolide antibiotics while maintaining activity toward smaller compounds [22].
Regulation & Induction Mechanisms
Regulatory Networks Controlling Pump Expression
The expression of RND efflux pumps is tightly regulated by complex networks of transcriptional regulators that respond to various environmental signals, antibiotic pressures, and cellular stress conditions. Understanding these regulatory circuits is essential for predicting pump expression in clinical isolates and designing effective anti-efflux strategies.
The AcrAB-TolC system is regulated by both local repressors (AcrR, AcrS) and global transcriptional activators (MarA, SoxS, Rob) that respond to diverse stress signals [50] [54]. The MexAB-OprM system is primarily controlled by the MexR repressor, with additional regulation by NalC and NalD, while ArmR functions as an antirepressor that disrupts MexR binding when overexpressed [50]. The AdeIJK system is constitutively expressed and responsible for intrinsic drug resistance in A. baumannii, with overexpression showing cytotoxic effects [10].
Induction by Non-Antibiotic Compounds
A clinically significant concern is the induction of RND efflux pump expression by various non-antibiotic compounds, which can lead to unexpected treatment failures and contribute to the development of cross-resistance. Bile salts present in the intestinal environment have been shown to induce AcrAB-TolC expression in enterobacteria through RamA activation, wherein bile components bind to RamR preventing its interaction with the ramA promoter region, leading to ramA overexpression and consequent AcrAB-TolC upregulation [50]. Biocides, disinfectants, detergents, and various pharmaceuticals can also induce efflux pump expression, potentially compromising antibiotic efficacy through cross-resistance mechanisms [50] [54]. Plant-derived compounds and food additives have additionally been demonstrated to modulate RND pump expression, highlighting the complex interplay between bacterial pathogens and their chemical environments [50].
This induction phenomenon represents a form of adaptive resistance wherein transient pump overexpression in response to environmental signals provides temporary protection until more stable resistance mechanisms can be acquired through mutation or horizontal gene transfer. From a clinical perspective, this underscores the importance of considering non-antibiotic exposures when investigating treatment failures associated with efflux-mediated resistance.
Troubleshooting Guide & FAQs
Frequently Asked Questions
Q1: Why do I observe different resistance profiles for the same efflux pump across different bacterial species or strains? A: Several factors contribute to this variability: (1) Genetic background differences affecting regulatory networks; (2) Variations in outer membrane permeability and porin expression; (3) Presence of additional resistance mechanisms that synergize with efflux; (4) Single nucleotide polymorphisms in efflux pump genes that alter substrate specificity; (5) Differences in pump expression levels due to variations in regulatory elements [10] [54].
Q2: How can I distinguish between efflux-mediated resistance and other resistance mechanisms (e.g., enzymatic inactivation, target modification)? A: Employ a combination of the following approaches: (1) Use specific efflux pump inhibitors (e.g., phenylalanine-arginine β-naphthylamide, PAβN) in combination with antibiotics to assess MIC reduction; (2) Perform real-time efflux assays using fluorescent substrates (e.g., ethidium bromide) with and without inhibitors; (3) Generate knockout mutants of the efflux pump genes and compare susceptibility profiles; (4) Quantify pump expression levels using RT-qPCR or reporter gene fusions; (5) Conduct enzymatic assays to detect antibiotic-modifying enzymes [54] [53] [22].
Q3: My efflux pump knockout strain shows no change in antibiotic susceptibility. What could explain this? A: Possible explanations include: (1) Functional redundancy with other efflux systems compensating for the loss; (2) The antibiotic tested is not a substrate for the specific pump knocked out; (3) The strain has exceptionally low outer membrane permeability, limiting intracellular antibiotic accumulation regardless of efflux; (4) The resistance is primarily mediated by other mechanisms (e.g., enzymatic inactivation); (5) The pump is not expressed under your experimental conditions due to regulatory constraints [54] [22].
Q4: How can I determine if a novel compound is an efflux pump substrate? A: Several experimental approaches can be employed: (1) Compare MICs between wild-type and efflux-deficient strains; (2) Assess compound accumulation in the presence and absence of efflux pump inhibitors; (3) Perform direct efflux assays using fluorescently labeled derivatives; (4) Use competitive assays with known substrates; (5) Employ molecular docking studies using available RND transporter structures [5] [22].
Q5: What controls should I include when conducting efflux inhibition assays? A: Essential controls include: (1) Strains with known efflux pump activity (positive control); (2) Isogenic efflux-deficient mutants (negative control); (3) Solvent controls for inhibitor vehicles (e.g., DMSO); (4) Well-characterized inhibitors as comparative controls; (5) Check for antibacterial activity of inhibitors alone; (6) Include a non-effluxed antibiotic to assess specificity of inhibition [53] [22].
Technical Troubleshooting Guide
Table 3: Troubleshooting Common Experimental Issues
| Problem | Potential Causes | Solutions |
|---|---|---|
| No efflux activity detected | Non-functional pump, improper assay conditions, wrong substrate | Verify pump expression (Western blot), optimize assay buffer (pH, energy source), validate with known substrates |
| High background in accumulation assays | Non-specific binding, inadequate washing, dye precipitation | Include proper controls, optimize washing steps, filter dyes, use appropriate concentrations |
| Inconsistent results between replicates | Bacterial growth state variability, temperature fluctuations, inhibitor stability | Use standardized growth conditions (OD, phase), control temperature, prepare fresh inhibitor solutions |
| Unexpected substrate specificity | Regulatory mutations, pump polymorphisms, additional resistance mechanisms | Sequence pump genes and regulators, check for complementary resistance mechanisms |
| Inhibitor shows no effect | Poor penetration, degradation, wrong target, efflux of inhibitor itself | Verify inhibitor stability, use controlled permeabilization, test inhibitor against known targets |
| Toxicity of efflux inhibitors | Non-specific membrane effects, interference with essential processes | Titrate inhibitor concentration, include viability controls, assess membrane integrity |
Experimental Protocols & Methodologies
Standardized Protocols for Efflux Characterization
Protocol 1: Minimum Inhibitory Concentration (MIC) Determination with Efflux Pump Inhibitors
- Prepare Mueller-Hinton broth according to CLSI guidelines with and without subinhibitory concentrations of efflux pump inhibitors (e.g., 20-50 μg/mL PAβN for Gram-negative bacteria).
- Standardize bacterial inoculum to 0.5 McFarland standard (~1.5 × 10^8 CFU/mL) in sterile saline.
- Perform two-fold serial dilutions of the test antibiotic in 96-well microtiter plates.
- Add bacterial suspension to achieve final concentration of 5 × 10^5 CFU/mL per well.
- Include appropriate controls: growth control (no antibiotic), sterility control (no bacteria), inhibitor control (inhibitor without antibiotic).
- Incubate at 35±2°C for 16-20 hours.
- Interpret MIC as the lowest antibiotic concentration that completely inhibits visible growth.
- A ≥4-fold reduction in MIC in the presence of efflux pump inhibitor suggests involvement of efflux in resistance [53] [22].
Protocol 2: Ethidium Bromide Accumulation Assay
- Grow bacterial cultures to mid-logarithmic phase (OD600 ≈ 0.4-0.6) in appropriate medium.
- Harvest cells by centrifugation (3,500 × g, 10 min) and wash twice with efflux assay buffer (50 mM phosphate buffer, pH 7.0, 5 mM MgCl₂).
- Resuspend cells to OD600 of 0.2 in assay buffer containing 0.4% glucose as energy source.
- Pre-incubate cell suspension at 37°C for 10 minutes with or without efflux pump inhibitors.
- Add ethidium bromide to a final concentration of 2 μg/mL.
- Immediately monitor fluorescence (excitation 530 nm, emission 600 nm) at 37°C for 30 minutes using a spectrofluorometer.
- Add carbonyl cyanide m-chlorophenyl hydrazone (CCCP, 50 μM final concentration) to dissipate proton motive force and confirm energy-dependent efflux.
- Higher fluorescence accumulation indicates reduced efflux activity [54] [53].
Protocol 3: Real-Time RT-PCR for Efflux Pump Gene Expression
- Extract total RNA from bacterial cultures using a commercial kit with DNase I treatment to remove genomic DNA contamination.
- Quantify RNA concentration and purity (A260/A280 ratio ~2.0).
- Reverse transcribe 1 μg total RNA using random hexamers and reverse transcriptase.
- Design gene-specific primers for target efflux pump genes and reference housekeeping genes (e.g., rpoB, gyrB).
- Prepare SYBR Green reaction mix according to manufacturer's instructions.
- Perform quantitative PCR with the following cycling conditions: 95°C for 10 min, followed by 40 cycles of 95°C for 15 s and 60°C for 1 min.
- Include melt curve analysis to verify amplification specificity.
- Calculate relative gene expression using the 2^(-ΔΔCt) method with normalization to reference genes [50] [54].
The Scientist's Toolkit: Essential Research Reagents
Table 4: Key Research Reagents for RND Efflux Pump Studies
| Reagent Category | Specific Examples | Application & Function |
|---|---|---|
| Efflux Pump Inhibitors | PAβN, CCCP, NMP, MBX3132 | Inhibit efflux activity to confirm pump involvement in resistance |
| Fluorescent Substrates | Ethidium bromide, Rhodamine 6G, Hoechst 33342 | Visualize and quantify efflux activity in real-time assays |
| Antibiotic Libraries | Diverse structural classes (β-lactams, fluoroquinolones, tetracyclines, etc.) | Profile substrate specificity and cross-resistance patterns |
| Molecular Biology Tools | Gene knockout systems, overexpression vectors, reporter fusions | Manipulate pump expression and study regulatory elements |
| Structural Biology Reagents | Detergents (DDM), lipids, crystallization screens | Facilitate protein purification and structural determination |
| Analytical Standards | Known efflux substrates, control strains with characterized pumps | Validate experimental systems and enable cross-study comparisons |
Research Gaps & Future Directions
Despite significant advances in understanding RND efflux pumps, several critical knowledge gaps remain that present opportunities for future research. The precise molecular determinants governing substrate polyspecificity in AdeB and other RND transporters require further elucidation, particularly through high-resolution structural studies of pump-substrate complexes [10] [68]. The clinical relevance of efflux pump inhibitors as therapeutic adjuvants warrants expanded investigation, including optimization of pharmacokinetic properties and demonstration of efficacy in animal infection models [53] [22]. The complex regulatory networks controlling pump expression in response to diverse environmental signals need more comprehensive characterization, particularly in clinical isolates during infection [50] [54]. Additionally, the contribution of efflux pumps to the evolution of resistance through their role in facilitating mutation accumulation by reducing intracellular antibiotic concentrations represents an important area for future study with significant clinical implications [50] [53].
Addressing these research gaps will require development of more sophisticated experimental tools, including advanced structural biology approaches, sensitive in vivo imaging techniques for monitoring efflux activity during infection, and high-throughput screening platforms for identifying novel efflux pump inhibitors with clinical potential. Furthermore, standardization of methodologies across laboratories will enhance comparability of findings and accelerate progress in this critical field of antimicrobial research.
Antimicrobial resistance (AMR) is a critical global health threat, and the resistance-nodulation-division (RND) efflux pumps in bacteria are a major contributor to multidrug resistance. These transmembrane transporters are not only involved in expelling antibiotics but also play roles in bacterial physiology and virulence. A core challenge in this field is the ambiguous classification of antibiotic resistance genes (ARGs) associated with these pumps, particularly in distinguishing their activity from other resistance mechanisms in complex environments. This technical support guide provides troubleshooting advice and methodologies for researchers aiming to definitively correlate the abundance and expression of RND efflux pump genes with specific environmental selective pressures.
FAQs and Troubleshooting Guides
FAQ 1: Why is it so difficult to definitively link RND efflux pump gene abundance to antibiotic selective pressures in environmental samples?
Answer: A primary reason is that RND efflux pumps are naturally produced by Gram-negative bacteria and have broad substrate specificity [70]. Their expression can be induced by a wide variety of non-antibiotic molecules commonly found in the environment, making it difficult to conclude that antibiotics are the sole selective pressure.
- Troubleshooting Guide:
- Challenge: Observing an increase in RND gene abundance alongside antibiotic contamination, but other inducers are present.
- Potential Cause: Co-occurring environmental pollutants. Bile salts, biocides, heavy metals, detergents, and plant compounds have all been shown to induce RND efflux pump expression [70]. For instance, heavy metal contamination can co-select for metal and antibiotic resistance genes, reshaping the entire resistance profile [71].
- Solution: Conduct controlled microcosm experiments. As explored in other ecological studies, you can systematically expose bacterial communities or specific strains to isolated and combined stressors (e.g., an antibiotic alone, a heavy metal alone, and both together) [71]. Monitor changes in both gene abundance and phenotypic resistance to disentangle the individual and synergistic effects of each stressor.
FAQ 2: How can I confirm that an observed increase in RND gene abundance is due to selection and not just stochastic population growth?
Answer: Relying solely on relative abundance measurements from standard 16S rRNA amplicon sequencing can be misleading. An increase in a gene's relative abundance might mean it is actually increasing in absolute terms, or that all other genes are decreasing while it remains stable [72].
- Troubleshooting Guide:
- Challenge: Interpreting shifts in relative abundance data from complex microbial communities.
- Potential Cause: The compositional nature of relative data [72].
- Solution: Implement absolute quantification methods. Use digital PCR (dPCR) to anchor your sequencing data to an absolute count of gene copies per unit of sample [72]. This allows you to distinguish between the five possible scenarios behind a changing ratio and accurately determine the magnitude and direction of change for each taxon or gene.
FAQ 3: What is the best way to demonstrate ecological connectivity and cross-sectoral transfer of RND-mediated resistance?
Answer: To move beyond correlation and demonstrate actual connectivity, you need to integrate genomic analysis with functional validation experiments.
- Troubleshooting Guide:
- Challenge: Finding evidence that RND-associated plasmids or genes are moving between different ecological compartments (e.g., from animal waste to environmental water).
- Potential Cause: While whole-genome sequencing can suggest shared genetic elements, it does not prove functional transfer.
- Solution: Perform conjugation assays. A study on E. coli in Hong Kong's aquatic ecosystems generated near-complete genomes using long-read sequencing to identify shared plasmids across human, animal, and environmental sectors. They then functionally confirmed that several of these plasmids were transmissible across ecological boundaries through conjugation assays [73]. This two-pronged approach provides powerful evidence for ecological connectivity.
Experimental Protocols for Ecological Validation
Protocol 1: Absolute Quantification of Microbial Gene Abundance
This protocol, adapted from a quantitative sequencing framework, ensures you measure absolute changes, not just relative shifts [72].
- Sample Processing: Efficiently extract DNA from your environmental samples (e.g., soil, water, mucosa). Validate extraction efficiency by spiking a defined microbial community into a sample subset to ensure equal recovery across taxa.
- Digital PCR (dPCR) Quantification: Use dPCR to perform absolute quantification of the total 16S rRNA gene or a specific RND gene (e.g., acrB) in your DNA samples. dPCR partitions a sample into thousands of nanoliter reactions, allowing for precise counting of target DNA molecules without a standard curve.
- 16S rRNA Gene Amplicon Sequencing: Sequence your samples using standard high-throughput methods.
- Data Integration: Convert the relative abundances obtained from sequencing into absolute abundances using the total 16S rRNA gene count from dPCR as an anchor. This yields data in units of "gene copies per gram" or similar, enabling accurate cross-sample comparisons.
Protocol 2: Functional Conjugation Assay for Plasmid Transfer
This protocol validates the mobility of RND-associated genetic elements [73].
- Donor and Recipient Strain Selection: Select a donor strain (isolated from one environment, e.g., animal waste) that carries the RND-associated plasmid of interest and a recipient strain (a lab strain or an environmental isolate) that is resistant to a different antibiotic but lacks the donor's plasmid.
- Mating Procedure: Mix donor and recipient cells on a filter placed on a non-selective solid medium. Incubate to allow for cell-to-cell contact and plasmid transfer.
- Selection of Transconjugants: After incubation, resuspend the cells and plate them onto a medium containing antibiotics that select for the recipient's intrinsic resistance and the resistance conferred by the donor's plasmid.
- Confirmation: Confirm successful conjugation by PCR or sequencing to verify the presence of the RND-associated plasmid in the transconjugant cells.
The workflow for validating the ecological transfer of RND-mediated resistance is outlined below.
Protocol 3: Microcosm Experiments to Isolate Selective Pressures
This protocol helps pinpoint the specific environmental factor driving RND gene selection [71].
- Experimental Design: Set up multiple microcosms (e.g., soil or water samples) and apply different treatments: a control, an antibiotic, a heavy metal, a biocide, and a combination treatment.
- Monitoring: Over time, sample the microcosms to track:
- Absolute Abundance: Use the dPCR/sequencing method from Protocol 1 to quantify specific RND genes.
- Phenotype: Measure the minimum inhibitory concentration (MIC) of relevant antibiotics for isolated bacteria.
- Community Structure: Assess changes in the overall microbial community using sequencing.
Data Presentation: Quantitative Frameworks
Table 1: Key RND Efflux Pumps and Their Regulation in Model Organisms
| Bacterial Species | Primary RND Efflux Pump | Key Local Regulator(s) | Common Inducing Molecules | Clinical Relevance |
|---|---|---|---|---|
| Escherichia coli | AcrAB-TolC [9] [70] | AcrR [70] | Bile salts, biocides, fatty acids, antibiotics [70] | Major contributor to intrinsic and acquired MDR in enteric bacteria [9] |
| Pseudomonas aeruginosa | MexAB-OprM [8] [70] | MexR, NalC, NalD [70] | Antibiotics, quorum-sensing signals [8] | Critical role in resistance to novel β-lactam/β-lactamase inhibitor combinations [8] |
| Salmonella enterica | AcrAB-TolC [70] | AcrR [70] | Bile salts [70] | Intestinal survival and pathogenesis |
| Stenotrophomonas maltophilia | SmeDEF [70] | SmeT [70] | Antibiotics [70] | Intrinsic resistance to multiple drug classes |
Table 2: Advantages and Limitations of Key Methodologies
| Methodology | Key Advantage | Key Limitation / Challenge | Best Used For |
|---|---|---|---|
| Relative Abundance Sequencing | High-throughput, cost-effective for community profiling [72] | Compositional data can lead to spurious correlations; cannot determine direction/magnitude of change [72] | Initial, broad-scale surveys of microbial community structure |
| Absolute Quantification (dPCR) | Determines true changes in gene abundance (copies/gram) [72] | Requires additional experimental step; lower throughput than sequencing alone [72] | Accurately quantifying changes in specific targets of interest across samples |
| Long-Read Sequencing (Nanopore) | Resolves complete genetic context (plasmids, operons) [73] | Higher error rate than short-read; more complex data analysis [73] | Tracking mobile genetic elements and strain-sharing events |
| Conjugation Assay | Functionally validates horizontal gene transfer [73] | Labor-intensive; requires culturable donor/recipient strains [73] | Providing direct evidence for the mobility of resistance genes |
The Scientist's Toolkit: Research Reagent Solutions
| Reagent / Material | Function in Experiment | Example & Notes |
|---|---|---|
| Nanopore R10.4.1 Flow Cells | Long-read sequencing platform for generating near-complete bacterial genomes and resolving plasmids [73]. | Enables high-quality, closed genomes to track strain and plasmid sharing events ecologically [73]. |
| Digital PCR (dPCR) System | Provides absolute quantification of target gene copies in a sample without a standard curve [72]. | Critical for converting relative sequencing data into absolute abundances, avoiding compositional data pitfalls [72]. |
| Defined Microbial Community | A mock community with known composition and abundance used as a spike-in control. | Validates DNA extraction efficiency and evenness across different sample types (e.g., stool, mucosa) [72]. |
| Efflux Pump Inhibitors (EPIs) | Compounds that block the activity of efflux pumps, such as Phe-Arg-β-naphthylamide (PAβN) [53]. | Used in combination with antibiotics to phenotypically confirm the role of efflux in observed resistance. |
| TetR Family Regulator Assays | Investigates the specific binding of regulators (e.g., AcrR) to DNA in response to inducers [70]. | Helps establish the direct molecular link between an environmental inducer and RND pump expression. |
The regulation of RND efflux pumps is complex, involving a network of local and global regulators that respond to environmental signals, as shown in the following regulatory network.
Frequently Asked Questions: Troubleshooting ARG Type Classification in RND Efflux Pump Research
FAQ 1: My phylogenetic analysis shows an RND permease clustering outside established HME, HAE-1, or NFE families. How should I classify it?
- Answer: This is a known challenge due to the overlapping distributions of the HAE-1 and NFE families [4]. Current best practice is to perform a robust phylogenetic analysis with reference sequences from databases like the Transporter Classification Database (TCDB). Propose a new family (e.g., HAE-4 for marine strains) only if the clade is phylogenetically distinct and correlates with a specific ecological distribution or function [4].
FAQ 2: I have confirmed RND efflux pump overexpression in a clinical isolate, but genetic analysis of the pump's regulatory genes shows no mutations. What other mechanisms should I investigate?
- Answer: Overexpression can occur via mutations in other global regulators. Investigate two-component regulatory systems (TCS) like AdeRS (controlling AdeABC in Acinetobacter baumannii) or BaeSR [74]. Also, consider the presence of biofilms, as efflux pump activity is heterogeneous within biofilms and can be induced by the microenvironment without permanent genetic mutations [75].
FAQ 3: How can I experimentally confirm that a newly classified ARG in an RND pump is responsible for a specific treatment failure?
- Answer: Beyond gene expression analysis, construct isogenic knockout or knockdown mutants of the specific pump gene in the clinical strain background. Compare the minimum inhibitory concentrations (MICs) of the relevant antibiotics between the wild-type and mutant strains. A significant reduction (e.g., 4-fold or greater) in MIC in the mutant directly links the pump to the resistance phenotype [8].
FAQ 4: My data suggests efflux pump activity contributes to beta-lactam/beta-lactamase inhibitor (BL/BLI) resistance, but I cannot identify the specific pump. How can I narrow it down?
- Answer: For gram-negative bacteria like Pseudomonas aeruginosa, screen for mutations in the known RND pump components and their regulators. Pay close attention to pumps like MexAB-OprM and MexCD-OprJ, which are commonly implicated in BL/BLI resistance [8]. Using a broad-spectrum efflux pump inhibitor (EPI) in combination with the antibiotic in an MIC assay can provide functional evidence for efflux involvement [74].
FAQ 5: What is the best way to present quantitative data on the distribution of different ARG types across bacterial genomes?
- Answer: Summarize the data in a clear table format, as shown below. This allows for easy comparison of prevalence across families and highlights their clinical significance.
Quantitative Data on RND Efflux Pump Permeases
Table 1: Prevalence and Key Characteristics of Primary RND Efflux Pump Families in Gram-Negative Bacteria This table summarizes data from a genomic analysis of 6205 RND permease genes from 920 representative Gram-negative bacterial genomes [4].
| RND Family | Proportion of All RND Pumps | Primary Role / Substrates | Potential Impact on Treatment & Patient Outcomes |
|---|---|---|---|
| HME (Heavy Metal Efflux) | 21.8% | Resistance to metal cations (e.g., Cu²⁺) [4]. | Confers survival in metal-contaminated environments (e.g., clinical settings with biocides); can be co-selected with antibiotic resistance [4]. |
| HAE-1 (Hydrophobe/Amphiphile Efflux-1) | 41.8% | Multidrug resistance; exports antibiotics, solvents, bile, detergents [4] [8]. | Major contributor to MDR phenotypes; linked to resistance against novel beta-lactam/BLI combinations (e.g., ceftazidime/avibactam, ceftolozane/tazobactam) in pathogens like P. aeruginosa [4] [8]. |
| NFE (Nodulation Factor Exporter) | Not specified | Poorly characterized; some members involved in MDR or export of lipooligosaccharides [4]. | Ambiguous classification complicates clinical prediction; some pumps may export specific drug classes, leading to unexpected treatment failures [4]. |
Table 2: Common RND Efflux Pumps in Key Pathogenic Species and Their Substrates Understanding pump specificity is crucial for predicting treatment outcomes [74] [8].
| Bacterial Species | Efflux Pump | Regulator(s) | Key Substrate Antibiotics |
|---|---|---|---|
| Acinetobacter baumannii | AdeABC | AdeRS, BaeSR | Aminoglycosides, Fluoroquinolones, Tetracyclines (including tigecycline*), β-lactams [74] |
| Escherichia coli | AcrAB-TolC | AcrR, MarA, SoxS, Rob | Beta-lactams, Fluoroquinolones, Chloramphenicol, Macrolides, Tetracyclines [9] |
| Pseudomonas aeruginosa | MexAB-OprM | MexR, NalC, NalD | Beta-lactams (including novel BL/BLI), Fluoroquinolones, Sulfonamides [8] |
| Pseudomonas aeruginosa | MexXY-OprM | MexZ | Aminoglycosides, Tetracyclines, Macrolides [8] |
Experimental Protocols for Resolving Ambiguous ARG Types
Protocol 1: Comprehensive Phylogenetic Classification of an RND Permease
This methodology is designed to resolve ambiguous ARG type classification [4].
Sequence Acquisition & Alignment:
- Obtain the protein sequence of the RND permease subunit of interest.
- Download reference sequences for HME, HAE-1, and NFE families from the Transporter Classification Database (TCDB).
- Perform a multiple sequence alignment using tools like Muscle or Clustal Omega.
Alignment Refinement:
- Use a tool like Gblocks to eliminate poorly aligned positions and retain only the most reliable, conserved regions for analysis.
Phylogenetic Tree Construction:
- Use maximum likelihood software such as IQ-Tree to reconstruct the phylogeny.
- Select the best-fitted model (e.g., LG+F+R6) based on the Bayesian Information Criterion.
- Determine branch support using ultrafast bootstrapping (e.g., 1000 replicates).
Clade Assignment and Functional Correlation:
- Assign your permease to a family based on its position in the phylogenetic tree relative to the reference clades.
- Correlate its phylogenetic placement with available metadata (e.g., from patient isolates) or experimental data on substrate specificity.
Protocol 2: Establishing a Clinical Correlation Using Isogenic Mutants
This protocol validates the role of a specific RND pump in antibiotic treatment failure [8].
Strain and Growth Conditions:
- Grow the clinical isolate and subsequent mutant strains in an appropriate medium (e.g., Mueller-Hinton broth) under standard conditions.
Mutant Construction:
- Create an isogenic mutant by inactivating the gene encoding the RND permease (e.g., via allelic exchange or CRISPR-based methods).
- Complementation can be performed by introducing a plasmid-borne copy of the wild-type gene back into the mutant.
Antimicrobial Susceptibility Testing (AST):
- Determine the MIC of the relevant antibiotics for the wild-type, mutant, and complemented strains using a reference method like broth microdilution.
Data Interpretation:
- A significant decrease (e.g., ≥4-fold) in the MIC of the antibiotic in the mutant strain, which is restored in the complemented strain, provides strong evidence that the specific efflux pump is responsible for the resistance observed in the patient.
The Scientist's Toolkit: Key Research Reagent Solutions
Table 3: Essential Materials and Reagents for RND Efflux Pump Research
| Item | Function / Application in Research |
|---|---|
| TCDB Reference Sequences | Gold-standard sequences for phylogenetic classification of transporter families, including HME, HAE-1, and NFE [4]. |
| Efflux Pump Inhibitors (EPIs) | Chemical compounds (e.g., PAβN, CCCP) used in combination with antibiotics to functionally confirm efflux pump activity by observing a reduction in MIC [74]. |
| Isogenic Mutant Strains | Genetically engineered strains (knockout/complemented) are crucial for directly linking a specific pump gene to an antibiotic resistance phenotype and patient outcome [8]. |
| qPCR Assays for HME/HAE-1 | "Universal" primers can quantify gene abundance in environmental or clinical samples, linking pump type to ecological niches (e.g., HME in metal-rich environments) [4]. |
| Biofilm Growth Systems | Tools (e.g., flow cells, microtiter plates) to study the interplay between efflux pumps and biofilms, a key environment for the development of tolerance and resistance [75]. |
Visualizing the Role of RND Efflux Pumps in Clinical Treatment Failure
The following diagram integrates the key concepts of RND pump structure, function, and regulation into the pathway that leads from antibiotic exposure to clinical treatment failure.
RND Pump Role in Treatment Failure This diagram shows how antibiotic exposure selects for bacteria where regulatory mutations cause RND efflux pump overexpression. Pumps with specific ARG types expel antibiotics, leading to multidrug resistance and potential treatment failure, a process intensified in biofilms.
The next diagram outlines the core experimental workflow for classifying an ambiguous ARG and validating its clinical impact.
ARG Classification Workflow This workflow illustrates the process from genetic isolation and phylogenetic classification of an RND permease to experimental validation of its role in antibiotic resistance. AST: Antimicrobial Susceptibility Testing.
Cross-Platform Validation of Computational Predictions with Experimental Data
A critical mission in combating the global antimicrobial resistance crisis is the precise identification of antibiotic resistance genes (ARGs) from environmental and clinical samples. The Comprehensive Antibiotic Resistance Database (CARD) has emerged as one of the most widely used resources for this task, providing a platform for efficient computational analysis. Its decision model uses pre-trained, ARG-specific BLASTP alignment bit-score thresholds, offering a more nuanced approach than databases using uniform parameters across all gene types [23].
However, this very flexibility introduces a significant challenge in Resistance-Nodulation-Division (RND) efflux pump research. The CARD model can produce ambiguous classifications because it only considers whether a query sequence surpasses the threshold of a single ARG type, without requiring that this type also be the best BLAST hit. This can lead to scenarios where a sequence is classified to a suboptimal ARG type, creating discrepancies between computational predictions and biological homology. Resolving these ambiguities is essential for accurate risk assessment and understanding the true prevalence and mobility of specific resistance mechanisms [23].
Frequently Asked Questions (FAQs)
FAQ 1: Why does my sequence for a known RND efflux pump gene (e.g., MexF) get misclassified as a different type (e.g., adeF) by the CARD database?
This misclassification stems from an incoherence between bit-score thresholds and BLAST homology. The CARD database uses curated bit-score thresholds for each ARG type. The threshold for adeF is relatively low (bit score 750), allowing sequences with lower identity to be classified as this type. In contrast, the threshold for MexF is much higher (bit score 2200), requiring nearly identical sequences. If your MexF sequence has a bit score against the CARD MexF entry that is below 2200 but its bit score against the adeF entry is above 750, it will be incorrectly classified as adeF, even if MexF is its best BLAST hit [23].
FAQ 2: What are FN-ambiguity and Coherence-ratio, and how do they help quantify classification problems?
These are metrics defined to systematically describe ambiguity in the CARD classification model [23]:
- FN-Ambiguity (False Negative): A sequence not annotated to a particular ARG is a potential false negative for that ARG if it has both a higher bit-score and percent identity than another sequence that is annotated to that ARG. A high FN-ratio for an ARG type indicates a likelihood of missing true positives.
- Coherence-Ratio: This measures the proportion of sequences where the CARD model's classification agrees with the best BLAST hit. A low coherence-ratio indicates a high rate of misclassification against the standard homology relationship.
FAQ 3: Our lab has identified an ambiguous RND efflux pump sequence. What is the recommended wet-lab protocol for experimental validation?
A robust validation protocol involves cloning and expression assays. The core methodology is as follows [23]:
- Cloning: Amplify the ambiguous ARG sequence from your sample and clone it into a standard expression vector (e.g., a plasmid with an inducible promoter).
- Transformation: Introduce the recombinant plasmid into a susceptible bacterial host strain (e.g., an E. coli lab strain with no intrinsic resistance to the antibiotic of interest).
- Expression and MIC Determination:
- Induce the expression of the cloned gene.
- Determine the Minimum Inhibitory Concentration (MIC) of the relevant antibiotic(s) for the transformed host against a control strain with an empty vector.
- A significant increase in MIC for the strain carrying your plasmid confirms the gene's functional role in antibiotic resistance.
- Specificity Confirmation: To distinguish between similar ARG types (e.g., MexF vs. adeF), test against a panel of specific inhibitors or a broader spectrum of antibiotics where the resistance profiles of the suspected types are known.
Troubleshooting Guides
Issue: Inconsistent ARG Type Predictions Across Databases
Problem: A query sequence is classified as different ARG types when analyzed using CARD versus other databases like SARG or NCBI-AMRFinder.
Solution:
- Cause: Different databases use fundamentally different classification algorithms and underlying reference data. CARD uses specific BLAST bit-score thresholds, SARG uses keyword searches and similarity to classified sequences, and AMRFinder uses Hidden Markov Models (HMMs) [23].
- Action Plan:
- Cross-Reference: Run your sequence against multiple databases (CARD, SARG, ARGs-OAP) and compile all results [23] [76].
- Manual Curation: Perform a manual BLAST against the non-redundant (NR) database and examine the top hits for homology and annotation.
- Investigate Discordance: Pay close attention to the bit-scores and percent identities from CARD. Check if the classification is incoherent with the best hit, which would flag it for further scrutiny [23].
Issue: Low Confidence in Computational Predictions for Novel Variants
Problem: You suspect your sequence is a novel variant of an RND efflux pump, but computational predictions are of low confidence or contradictory.
Solution:
- Cause: Novel variants often fall near or below the curated thresholds in databases, making their classification unstable and prone to the incoherence problem.
- Action Plan:
- Calculate Metrics: Use the definitions from the CARD analysis to calculate the FN-ambiguity and Coherence-ratio for your sequence in relation to the top candidate ARG types [23].
- Phylogenetic Analysis: Include your sequence in a multiple sequence alignment and phylogenetic tree with known RND efflux pumps. Its placement within a specific clade provides strong evidence for its classification, independent of fixed thresholds.
- Experimental Validation: This is the definitive step. Follow the experimental protocol outlined in FAQ #3 to functionally characterize the gene and confirm its identity based on phenotypic resistance [23].
Key Metrics and Data Presentation
Table 1: Quantifying Ambiguity in RND Efflux Pump Classification in CARD
This table summarizes key concepts and metrics for diagnosing classification issues, derived from an in-depth analysis of the CARD database [23].
| Metric/Term | Definition | Interpretation in RND Pumps |
|---|---|---|
| Classification Incoherence | A case where the ARG type assigned by the model is not the query's best BLAST hit. | Indicates a potential misclassification; common in RND families due to homologous subtypes with different thresholds [23]. |
| FN-Ambiguity | The ratio of potential false-negative sequences for an ARG type to the total number of sequences that align to it [23]. | A high value suggests the curated threshold for a specific RND gene (e.g., MexF) may be too strict, causing true members to be missed [23]. |
| Coherence-Ratio | The proportion of sequences for which the model's classification matches the best BLAST hit. | A low ratio for the RND family implies widespread misclassification and a high rate of ambiguous results [23]. |
| Bit-Score Threshold | A pre-trained, ARG-specific score cutoff used by CARD to make a positive classification [23]. | Highly variable between RND genes (e.g., 750 for adeF vs. 2200 for MexF), which is the root cause of the observed ambiguity [23]. |
Table 2: Research Reagent Solutions for Validation Experiments
Essential materials and tools for experimental validation of computationally predicted ARGs.
| Reagent / Tool | Function in Validation | Example / Specification |
|---|---|---|
| Cloning Vector | To harbor and enable the expression of the cloned ARG in a host strain. | Plasmid with an inducible promoter (e.g., pET, pBAD series). |
| Susceptible Host Strain | A model organism to test the resistance phenotype conferred by the cloned ARG. | E. coli K-12 derivative with known antibiotic susceptibility. |
| Antibiotic Panel | To determine the resistance profile and help distinguish between similar ARG types. | Includes tetracyclines, beta-lactams, fluoroquinolones, etc. |
| MIC Test Strips/Kits | To quantitatively measure the minimum inhibitory concentration of an antibiotic. | Cation-adjusted Mueller-Hinton broth, MIC test strips. |
| CARD Database | The primary computational tool for initial ARG prediction and threshold-based analysis [23]. | https://card.mcmaster.ca |
| ARGs-OAP Pipeline | A standardized pipeline for high-throughput ARG analysis, useful for cross-referencing [76]. | ARGs-OAP v3.0 with the structured SARG database [76]. |
Experimental Workflow and Visualization
Workflow for Resolving Ambiguous ARG Classification
The following diagram outlines a comprehensive, cross-platform strategy to diagnose and resolve ambiguous classifications of RND efflux pumps, integrating both computational and experimental approaches.
Logic of CARD Model Incoherence
This diagram illustrates the specific logical flaw in the CARD model that leads to misclassification of RND efflux pumps, using the example of a MexF sequence being incorrectly assigned to adeF.
Technical Support Center: Troubleshooting RND Efflux Pump Classification
FAQ 1: Why does my phylogenetic analysis of RND pump genes (e.g., adeB, mexB) produce poorly resolved trees with low bootstrap values?
Answer: This is a common issue often caused by high sequence similarity among closely related pump types or the presence of highly conserved transmembrane domains that provide little phylogenetic signal.
- Solution:
- Refine your MSA: Use a more stringent multiple sequence alignment (MSA) algorithm (e.g., MUSCLE, MAFFT) and manually trim poorly aligned regions.
- Increase Informative Sites: Focus the analysis on the nucleotide-binding domains (NBDs) and the membrane fusion proteins (MFPs), which are more variable than the transmembrane domains.
- Use a Combination of Genes: Construct a concatenated tree using the core genes of the operon (e.g., adeA, adeB, adeC for A. baumannii) to increase the number of informative sites.
- Validate with a Reference Set: Include well-characterized reference sequences from databases like CARD (Comprehensive Antibiotic Resistance Database) in your analysis to anchor your clusters.
FAQ 2: My phenotypic efflux pump assay (e.g., with carbonyl cyanide m-chlorophenyl hydrazine (CCCP)) shows inconsistent results between biological replicates. What could be wrong?
Answer: Inconsistency often stems from variable gene expression or suboptimal assay conditions.
- Solution:
- Standardize Growth Conditions: Ensure the optical density (OD) and growth phase (typically mid-log phase) of the bacterial culture are identical at the start of each assay.
- Confirm Efflux Pump Inhibitor (EPI) Activity: Verify the potency and stability of your EPI (e.g., CCCP, PaβN). Prepare fresh stock solutions and include a control with EPI alone to rule out bacterial growth inhibition.
- Control for Intrinsic Resistance: Use a strain with a known deletion of the efflux pump operon as a negative control.
- Combine with Genotypic Data: Correlate phenotypic results with quantitative PCR (qPCR) to measure the expression levels of the target RND pump genes.
FAQ 3: During PCR amplification for RND efflux pump genes, I get non-specific bands or no product. How can I optimize this?
Answer: Primer design is critical due to the presence of multiple, similar RND operons within a single genome.
- Solution:
- Design Specific Primers: Use primer-BLAST against the genome of your target strain to ensure specificity. Target unique variable regions within the gene.
- Optimize Annealing Temperature: Perform a gradient PCR to determine the optimal annealing temperature for your primer set.
- Check Template Quality and Quantity: Use high-quality, pure genomic DNA. Verify concentration and purity (A260/A280 ratio).
- Use a Touchdown PCR Protocol: This can increase specificity by starting with a higher annealing temperature and gradually decreasing it.
FAQ 4: How can I resolve ambiguous classification when a novel RND pump sequence shows high identity to two different subtypes?
Answer: This ambiguity requires a multi-method approach beyond simple BLAST.
- Solution:
- Motif and Domain Analysis: Use tools like InterProScan to identify specific amino acid motifs and domain architectures that are characteristic of a particular subtype.
- Average Nucleotide Identity (ANI): Calculate the ANI between the novel sequence and reference sequences. A subtype is typically defined by >95% ANI.
- Functional Clustering: Perform a minimum inhibitory concentration (MIC) panel against a wide range of antibiotics and compare the profile to known subtypes.
- Structural Modeling: Use homology modeling (e.g., with SWISS-MODEL) to predict the 3D structure of the novel pump and compare the substrate-binding pocket to known structures.
Experimental Protocol: MIC Reduction Assay with an Efflux Pump Inhibitor
Objective: To functionally validate the contribution of a specific RND efflux pump to antibiotic resistance.
Methodology:
- Bacterial Strains: Test strain (wild-type), isogenic mutant (pump knockout), and a complemented mutant.
- Antibiotics & Reagents: Serial dilutions of target antibiotics (e.g., fluoroquinolones, tetracyclines, β-lactams) and an EPI (e.g., Phe-Arg-β-naphthylamide (PaβN) for Gram-negative).
- Broth Microdilution:
- Prepare two sets of Mueller-Hinton broth in a 96-well plate with a 2-fold serial dilution of the antibiotic.
- To one set, add a sub-inhibitory concentration of the EPI (e.g., 20-50 µg/mL for PaβN).
- Inoculate each well with ~5 x 10^5 CFU/mL of the standardized bacterial suspension.
- Incubate at 35°C for 16-20 hours.
- Analysis: The MIC is the lowest concentration that inhibits visible growth. A ≥4-fold decrease in MIC in the presence of the EPI confirms efflux-mediated resistance.
Data Presentation
Table 1: MIC Profiles (µg/mL) of A. baumannii Strains with and without Efflux Pump Inhibition
| Strain Description | Ciprofloxacin | Ciprofloxacin + PaβN | Tigecycline | Tigecycline + PaβN |
|---|---|---|---|---|
| Wild-type (ADE+) | 32 | 4 | 4 | 0.5 |
| adeB Knockout | 4 | 4 | 0.5 | 0.5 |
| Complemented Mutant | 16 | 2 | 2 | 0.5 |
Table 2: Key Genetic Markers for Differentiating RND Pump Subtypes in P. aeruginosa
| RND Pump | Subtype | Key Differentiating Amino Acid Motif (in NBD) | Associated MFP |
|---|---|---|---|
| MexAB-OprM | I | G-X-X-X-G-K-S/T (Walker A) | MexA |
| MexCD-OprJ | II | D-E-T-S (Substrate specificity loop) | MexC |
| MexXY-OprM | III | Unique Q-loop region (e.g., N-X-X-G-R) | MexX |
Visualizations
Title: Framework for Resolving Ambiguous RND Classification
Title: RND Efflux Pump Mechanism
The Scientist's Toolkit: Research Reagent Solutions
| Reagent/Material | Function in Experiment |
|---|---|
| Phe-Arg-β-naphthylamide (PaβN) | A broad-spectrum efflux pump inhibitor used in MIC assays to confirm efflux-mediated resistance. |
| Carbonyl Cyanide m-Chlorophenylhydrazone (CCCP) | A protonophore that dissipates the proton motive force, inhibiting RND pump activity in phenotypic assays. |
| Mueller-Hinton Broth (MHB) | The standardized growth medium for antimicrobial susceptibility testing (e.g., broth microdilution). |
| High-Fidelity DNA Polymerase (e.g., Q5, Phusion) | Used for accurate amplification of RND pump genes from genomic DNA for sequencing and cloning. |
| Cation-Adjusted MHB | Essential for testing P. aeruginosa susceptibility to aminoglycosides and other cations-influenced antibiotics. |
Conclusion
Resolving ambiguous ARG classification in RND efflux pumps is not merely an academic exercise but a prerequisite for developing effective countermeasures against multidrug resistance. A multi-faceted approach—integrating robust phylogenetics, structural insights, functional validation, and computational tools—is essential to overcome current limitations. Standardizing this framework will accelerate the identification of novel resistance determinants, clarify their ecological and clinical roles, and inform the rational design of next-generation efflux pump inhibitors. Future efforts must focus on creating curated, high-quality databases and developing accessible bioinformatics pipelines to make precise classification a standard practice in both clinical and research settings, ultimately preserving the efficacy of our existing antibiotic arsenal.
References
- 1. Resistance-nodulation-cell division superfamily [https://en.wikipedia.org/wiki/Resistance-nodulation-cell_division_superfamily]
- 2. RND transporters in the living world [https://www.sciencedirect.com/science/article/pii/S0923250818300445]
- 3. STRUCTURE AND MECHANISM OF RND-TYPE ... [https://pmc.ncbi.nlm.nih.gov/articles/PMC3122131/]
- 4. HME, NFE, and HAE-1 efflux pumps in Gram-negative bacteria [https://pmc.ncbi.nlm.nih.gov/articles/PMC10872679/]
- 5. Mechanisms of RND Multidrug Efflux Pumps - PubMed Central [https://pmc.ncbi.nlm.nih.gov/articles/PMC2696896/]
- 6. Tripartite efflux pumps of the RND superfamily - PubMed Central [https://pmc.ncbi.nlm.nih.gov/articles/PMC10191380/]
- 7. Exploring the HME and HAE1 efflux systems in the genus ... [https://bmcecolevol.biomedcentral.com/articles/10.1186/1471-2148-10-164]
- 8. Efflux pump-mediated resistance to new beta lactam ... [https://www.nature.com/articles/s43856-024-00591-y]
- 9. The ins and outs of RND efflux pumps in Escherichia coli - PMC [https://pmc.ncbi.nlm.nih.gov/articles/PMC4462101/]
- 10. Structural and functional analysis of the promiscuous AcrB ... [https://www.nature.com/articles/s41467-021-27146-2]
- 11. RND-type drug efflux pumps from Gram-negative bacteria [https://pmc.ncbi.nlm.nih.gov/articles/PMC4412071/]
- 12. RND multidrug efflux pumps: what are they good for? - PMC [https://pmc.ncbi.nlm.nih.gov/articles/PMC3564043/]
- 13. Evolutionary loss of an antibiotic efflux pump increases ... [https://www.nature.com/articles/s41467-025-63284-7]
- 14. Identification of binding residues between periplasmic adapter ... [https://journals.plos.org/plospathogens/article?id=10.1371/journal.ppat.1008101]
- 15. Deep analysis and optimization of CARD antibiotic resistance ... [https://bmcgenomics.biomedcentral.com/articles/10.1186/s12864-019-6318-5]
- 16. Tripartite assembly of RND multidrug efflux pumps [https://www.nature.com/articles/ncomms10731]
- 17. Structure of the Tripartite Multidrug Efflux Pump AcrAB- ... [https://www.sciencedirect.com/science/article/pii/S1016847823054146]
- 18. Operon [https://en.wikipedia.org/wiki/Operon]
- 19. Operons [https://old-ib.bioninja.com.au/higher-level/topic-7-nucleic-acids/72-transcription-and-gene/operons.html]
- 20. Horizontal Gene Transfer and the History of Life - PMC [https://pmc.ncbi.nlm.nih.gov/articles/PMC4817804/]
- 21. Operons - PMC [https://pmc.ncbi.nlm.nih.gov/articles/PMC2776167/]
- 22. RND-type Drug Efflux Pumps from Gram-negative bacteria [https://www.frontiersin.org/journals/microbiology/articles/10.3389/fmicb.2015.00377/full]
- 23. Deep analysis and optimization of CARD antibiotic ... [https://pmc.ncbi.nlm.nih.gov/articles/PMC6936150/]
- 24. Operon - an overview [https://www.sciencedirect.com/topics/biochemistry-genetics-and-molecular-biology/operon]
- 25. Structural phylogenetics unravels the evolutionary ... [https://www.nature.com/articles/s41594-025-01649-8]
- 26. Answers to your "Phylogenetic Tree" webinar questions [https://www.dnastar.com/blog/sequence-analysis/answers-to-your-phylogenetic-tree-webinar-questions/]
- 27. Identification of robust species-specific marker genes for the ... [https://pmc.ncbi.nlm.nih.gov/articles/PMC12623006/]
- 28. The development of cryo-EM into a mainstream structural ... [https://pmc.ncbi.nlm.nih.gov/articles/PMC4913480/]
- 29. Cryo-EM as a tool to study bacterial efflux systems and the ... [https://pmc.ncbi.nlm.nih.gov/articles/PMC7946387/]
- 30. Advancing time-resolved structural biology [https://www.nature.com/articles/s41592-025-02659-6]
- 31. Building Protein Atomic Models from Cryo-EM Density ... [https://pmc.ncbi.nlm.nih.gov/articles/PMC9496541/]
- 32. Cryo-EM model validation recommendations based on ... [https://www.nature.com/articles/s41592-020-01051-w]
- 33. Cryo-EM structure of the Pseudomonas aeruginosa MexY ... [https://pmc.ncbi.nlm.nih.gov/articles/PMC11980583/]
- 34. Crystal structures of multidrug efflux pump MexB bound ... [https://www.nature.com/articles/s41598-019-40232-2]
- 35. The role of RND -type efflux in multidrug-resistant mutants of... pumps [https://www.nature.com/articles/s41598-020-67820-x?error=cookies_not_supported&code=328f6215-08c2-41e3-ab88-e11cb09b5dc7]
- 36. Efflux-Mediated Resistance in Enterobacteriaceae [https://pmc.ncbi.nlm.nih.gov/articles/PMC12382670/]
- 37. Ever-Adapting RND in Gram-Negative... Efflux Pumps [https://pubmed.ncbi.nlm.nih.gov/34201908/]
- 38. Functional interplay between RND efflux pumps and GacS ... [https://pmc.ncbi.nlm.nih.gov/articles/PMC12442375/]
- 39. Genome-Wide Association Study of Nucleotide Variants ... [https://pmc.ncbi.nlm.nih.gov/articles/PMC9320666/]
- 40. Increased power from conditional bacterial genome-wide ... [https://www.nature.com/articles/s41467-020-19250-6]
- 41. Conformational plasticity across phylogenetic clusters of RND multidrug... [https://pubmed.ncbi.nlm.nih.gov/39605333/]
- 42. of the Substrate -Type Multidrug Specificity ... | Scilit RND Efflux Pumps [https://www.scilit.com/publications/7f937dabecce73d5f8677ea450ecece3]
- 43. ProtAlign-ARG: antibiotic resistance gene characterization ... [https://www.nature.com/articles/s41598-025-14545-4]
- 44. ARG-SHINE: improve antibiotic resistance class prediction ... [https://pmc.ncbi.nlm.nih.gov/articles/PMC8341004/]
- 45. Editorial: Machine learning for biological sequence analysis [https://pmc.ncbi.nlm.nih.gov/articles/PMC9936181/]
- 46. ARGNet: using deep neural networks for robust identification ... [https://microbiomejournal.biomedcentral.com/articles/10.1186/s40168-024-01805-0]
- 47. Troubleshoot database consistency errors reported [https://learn.microsoft.com/en-us/troubleshoot/sql/database-engine/database-file-operations/troubleshoot-dbcc-checkdb-errors]
- 48. Repository inconsistency - Magnolia Docs [https://docs.magnolia-cms.com/product-docs/Administration/Troubleshooting/Repository-inconsistency/]
- 49. Detecting and correcting misclassified sequences in the ... [https://pmc.ncbi.nlm.nih.gov/articles/PMC7821992/]
- 50. RND Efflux Pump Induction: A Crucial Network Unveiling ... [https://pmc.ncbi.nlm.nih.gov/articles/PMC11200565/]
- 51. Drug resistance and physiological roles of RND multidrug ... [https://pmc.ncbi.nlm.nih.gov/articles/PMC10333786/]
- 52. Evolution of RND efflux pumps in the development of a ... [https://www.sciencedirect.com/science/article/abs/pii/S1368764622001108]
- 53. Bacterial multidrug efflux pumps: Mechanisms, physiology ... [https://www.sciencedirect.com/science/article/pii/S0006291X14009711]
- 54. The ins and outs of RND efflux pumps in Escherichia coli [https://www.frontiersin.org/journals/microbiology/articles/10.3389/fmicb.2015.00587/full]
- 55. PCR Primer Design Tips - Behind the Bench [https://www.thermofisher.com/blog/behindthebench/pcr-primer-design-tips/]
- 56. Primer design guide - 5 tips for best PCR results [https://the-dna-universe.com/2022/09/05/primer-design-guide-the-top-5-factors-to-consider-for-optimum-performance/]
- 57. Design and Validation of Primer Sets for the Detection ... [https://pmc.ncbi.nlm.nih.gov/articles/PMC11096201/]
- 58. Highly efficient screening and optimal combination of ... [https://www.sciencedirect.com/science/article/abs/pii/S001393512202391X]
- 59. RND-Type Efflux Pumps in Multidrug-Resistant Clinical ... [https://pmc.ncbi.nlm.nih.gov/articles/PMC3697384/]
- 60. Optimization of a novel series of pyranopyridine RND efflux ... [https://pmc.ncbi.nlm.nih.gov/articles/PMC5069128/]
- 61. Mechanisms of Gene Duplication and Translocation ... [https://pmc.ncbi.nlm.nih.gov/articles/PMC3420103/]
- 62. Horizontal gene transfer [https://en.wikipedia.org/wiki/Horizontal_gene_transfer]
- 63. An alignment-free method to find and visualise ... [https://www.nature.com/articles/srep10203]
- 64. PCR Troubleshooting Guide & Solutions [https://www.bosterbio.com/protocol-and-troubleshooting/pcr-troubleshooting?srsltid=AfmBOoo2v5BKSEXln39qM2OT0NkJSoB5FRRNwtlKnN6KLSVTWKe5y_N6]
- 65. Troubleshooting Guide for Common CRISPR-Cas9 Editing ... [https://synapse.patsnap.com/article/troubleshooting-guide-for-common-crispr-cas9-editing-problems]
- 66. AcrAB−TolC, a major efflux pump in Gram negative bacteria [https://pmc.ncbi.nlm.nih.gov/articles/PMC10315565/]
- 67. Bacterial effluxome as a barrier against antimicrobial agents [https://pmc.ncbi.nlm.nih.gov/articles/PMC9621062/]
- 68. Structural and functional diversity of RND transporters - PMC [https://pmc.ncbi.nlm.nih.gov/articles/PMC8119314/]
- 69. Mutations in the TolC Periplasmic Domain Affect Substrate ... [https://www.frontiersin.org/journals/molecular-biosciences/articles/10.3389/fmolb.2020.00166/full]
- 70. RND Efflux Pump Induction: A Crucial Network Unveiling ... [https://www.mdpi.com/2079-6382/13/6/501]
- 71. Metagenomic insights into the ecological risks of multiple ... [https://www.sciencedirect.com/science/article/pii/S0147651325013934]
- 72. A quantitative sequencing framework for absolute ... [https://www.nature.com/articles/s41467-020-16224-6]
- 73. Ecological connectivity of genomic markers of antimicrobial ... [https://www.nature.com/articles/s41467-025-62455-w]
- 74. Types and Mechanisms of Efflux Pump Systems and the ... [https://www.mdpi.com/2076-0817/13/3/197]
- 75. Antimicrobial efflux and biofilms: an interplay leading to ... [https://www.sciencedirect.com/science/article/pii/S0966842X25001234]
- 76. ARGs-OAP v3.0: Antibiotic-Resistance Gene Database ... [https://www.sciencedirect.com/science/article/pii/S2095809922008062]