Unveiling the Environmental Resistome: Global Diversity, Surveillance Methods, and Clinical Implications of Antibiotic Resistance Genes
Antibiotic resistance genes (ARGs) in environmental reservoirs—the environmental resistome—pose a critical threat to global health.
Unveiling the Environmental Resistome: Global Diversity, Surveillance Methods, and Clinical Implications of Antibiotic Resistance Genes
Abstract
Antibiotic resistance genes (ARGs) in environmental reservoirs—the environmental resistome—pose a critical threat to global health. This article synthesizes current research on the prevalence, diversity, and drivers of ARGs across key habitats like wastewater treatment plants, agricultural settings, and the atmosphere. It explores advanced metagenomic tools for resistome surveillance and analysis, addressing technical challenges and innovative solutions. The review also examines comparative risk assessments and the validation of ARG mobility and clinical relevance. Finally, it discusses the proactive application of resistome data in drug development and public health, offering a comprehensive One Health perspective for researchers, scientists, and drug development professionals aiming to mitigate the antibiotic resistance crisis.
The Global Environmental Resistome: Diversity, Hotspots, and Drivers
The resistome encompasses the complete collection of all antibiotic resistance genes (ARGs) and their precursors in both pathogenic and non-pathogenic bacteria, residing in humans, animals, and environmental settings [1]. This concept is central to understanding the antimicrobial resistance (AMR) crisis, as it frames resistance not merely as a clinical aberration but as a vast, ancient, and interconnected natural feature of microbial ecosystems. ARGs are ancient; they have been identified in 30,000-year-old permafrost, demonstrating that resistance predates the modern clinical use of antibiotics [1]. The contemporary crisis stems from the rapid selection and global dissemination of these genes from environmental reservoirs into human pathogens, driven by anthropogenic selective pressures.
This mobilization of resistance is a quintessential One Health challenge, emphasizing the interconnectedness of human, animal, and environmental health [2]. The flow of bacteria and genes between these domains is facilitated by human activities, including the overuse of antibiotics in healthcare and agriculture, and the release of antibiotic-polluted waste into the environment [3] [1]. Quantifying the pathways and identifying the drivers and bottlenecks for the environmental evolution and transmission of antibiotic resistance are therefore critical for managing the resistance crisis as a whole [1]. This review details the composition and prevalence of ARGs across key environmental reservoirs, examines the mechanisms of their mobilization and transfer into clinical threats, and outlines the advanced methodologies required for resistome research within the context of environmental AMR studies.
The Environmental Resistome: Diversity and Key Reservoirs
Environmental compartments act as immense reservoirs and mixing pots for ARGs. The diversity and abundance of resistomes vary significantly across different habitats, shaped by local selective pressures and microbial community structures.
Table 1: Prevalence of Key Antibiotic Resistance Genes Across Major Environmental Reservoirs
| Environment | Most Abundant ARGs/Mechanisms | Key Bacterial Hosts/Carriers | Noteworthy Findings |
|---|---|---|---|
| Wastewater Treatment Plants (WWTPs) [4] | Tetracycline efflux pumps (e.g., Tet MFS), Beta-lactamase (Class B), Glycopeptide (vanG) | Chloroflexi, Acidobacteria, Deltaproteobacteria | A core set of 20 ARGs found in all 142 globally distributed WWTPs studied. |
| Hospital Wastewater [5] | Carbapenemase genes (e.g., blaKPC, blaNDM), mecA (methicillin resistance), vanA (vancomycin resistance) | Carbapenem-resistant Enterobacterales, Klebsiella spp., E. coli | ARG levels are significantly higher than in urban wastewater; a critical hotspot for clinically relevant ARGs. |
| Wild Rodent Gut Microbiota [6] | Elfamycin resistance, Multidrug resistance, Tetracycline (e.g., tet(Q), tet(W)) | Escherichia coli, Enterococcus faecalis, Citrobacter braakii | 8,119 ARGs identified; a strong correlation exists between ARGs, virulence factors, and mobile genetic elements. |
| Livestock Manure [7] | ARGs conferring multidrug, tetracycline, and macrolide resistance | Not specified in detail | Chickens and swine show the highest ARG diversity and abundance, with risk scores highest in South America, Africa, and Asia. |
| Baltic Sea Sediments [8] | ARGs against 26 drug classes | Benthic microbial communities | Resistome diversity is shaped by salinity, temperature, and nutrient gradients; higher in northern regions. |
A 2025 global survey of 142 wastewater treatment plants (WWTPs) across six continents confirmed that these facilities are significant ARG reservoirs, finding a core set of 20 ARGs present in every plant analyzed [4]. The ARG composition in activated sludge was distinct from that of the human gut and oceans but similar to sewage and soil, underscoring the environmental interconnectivity [4]. Among these reservoirs, hospital wastewater is a particularly critical hotspot. Despite contributing less than 2% of total wastewater volume, it carries a disproportionately high load of clinically critical ARGs, such as carbapenemase genes (blaKPC, blaNDM), which are often found at significantly higher levels than in community wastewater [5].
Beyond human-influenced sites, natural and wildlife-associated reservoirs also contribute to the global resistome. A comprehensive analysis of 12,255 gut-derived bacterial genomes from wild rodents identified 8,119 ARGs, with organisms like Escherichia coli and Enterococcus faecalis acting as major carriers [6]. Similarly, global analysis of livestock manure reveals that animal production systems are substantial reservoirs, with ARG prevalence and risk scores following a hierarchy of chickens > pigs >> cattle [7]. Even seemingly pristine environments are not exempt; the resistome of Baltic Sea benthic sediments is structured by environmental gradients like salinity and temperature, demonstrating how natural physicochemical factors can shape ARG distribution [8].
From Environment to Clinic: Mobilization and Transmission Pathways
The presence of ARGs in environmental bacteria poses a limited direct threat; the peril arises when these genes transfer into human pathogens. This mobilization is a multi-stage process governed by genetic elements, selective pressures, and ecological interactions.
The Role of Mobile Genetic Elements (MGEs)
Horizontal Gene Transfer (HGT) via MGEs is the primary engine driving the dissemination of ARGs from environmental reservoirs to clinical pathogens. Key MGEs include plasmids, transposons, and integrons, which can shuttle genes between distantly related bacterial species [2]. In the wild rodent gut microbiota, a strong correlation was observed between the presence of MGEs, ARGs, and virulence factor genes (VFGs), highlighting the potential for co-selection and mobilization of resistance and virulence traits [6]. In global WWTPs, 57% of the recovered high-quality bacterial genomes contained putatively mobile ARGs, and ARG abundance positively correlated with the presence of MGEs, confirming WWTPs as spawning grounds for resistance evolution [4].
Eco-Evolutionary Dynamics and Selection
The transfer and fixation of ARGs are influenced by complex eco-evolutionary interactions:
- Fitness Costs and Compensatory Evolution: Carrying MGEs with ARGs often imposes a fitness cost, potentially leading to the loss of resistance when antibiotic selection pressure is absent. However, compensatory mutations can alleviate these costs, allowing resistant bacteria to persist long after antibiotic exposure has ceased [2].
- Community-Level Interactions: In polymicrobial settings, resistant cells can protect susceptible neighbors through mechanisms like the extracellular secretion of β-lactamase enzymes, a form of collective resistance [2]. Biofilms provide another structured environment that protects sensitive cells and facilitates HGT, enhancing community-wide resilience [2].
- Co-selection: Heavy metals and biocides can co-select for antibiotic resistance, as the genes conferring resistance to these different stressors are often linked on the same MGEs [8]. This means that even in the absence of antibiotics, pollution can enrich for environmental resistomes.
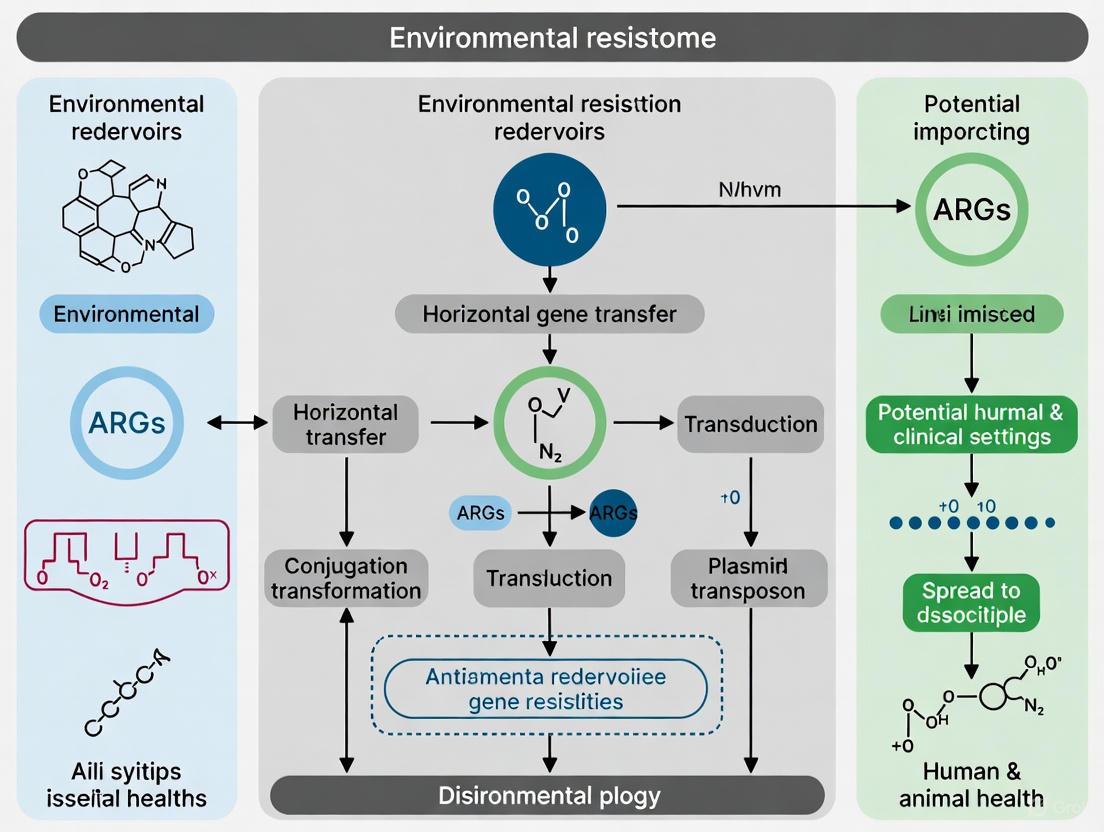
The following diagram illustrates the pathways through which ARGs originate in environmental gene pools and ultimately become mobilized into human pathogens.
Methodologies for Resistome Analysis in Environmental Research
Characterizing the resistome requires a suite of culture-dependent and, more importantly, advanced culture-independent molecular techniques that allow for the comprehensive profiling of ARGs in complex microbial communities.
Key Experimental Workflows
The standard workflow for metagenomic resistome analysis involves sample collection, DNA extraction, high-throughput sequencing, and bioinformatic analysis. The following diagram outlines the primary pathways for targeted and untargeted ARG detection.
- Culture-Based Methods: Traditional techniques involve isolating bacteria on antibiotic-supplemented agar followed by antibiotic susceptibility testing (e.g., disk diffusion) to determine resistance profiles. A major limitation is that most environmental bacteria cannot be cultured in the laboratory [5].
- Molecular Detection (qPCR/dPCR): Quantitative PCR (qPCR) and digital PCR (dPCR) are used for sensitive, absolute quantification of specific, pre-defined ARGs in environmental samples. qPCR is widely used for monitoring key clinical ARGs (e.g., blaNDM-1, mcr-1) in hotspots like hospital wastewater [5].
- Shotgun Metagenomics: This is the most powerful, culture-independent approach for resistome research. It involves sequencing all the DNA in a sample, followed by computational assembly and annotation of sequences against specialized databases like the Comprehensive Antibiotic Resistance Database (CARD) [5] [4]. This method allows for the discovery of novel ARGs, provides information on the genetic context (linkage to MGEs), and enables the linkage of ARGs to their bacterial hosts through metagenome-assembled genomes (MAGs) [6] [4].
Table 2: Key Reagents and Resources for Resistome Analysis
| Item/Resource | Function/Description | Application Example |
|---|---|---|
| Selective Culture Media | Agar supplemented with antibiotics for isolating specific antibiotic-resistant bacteria (ARB). | Isolating ESBL-producing Enterobacteriaceae using MacConkey agar with cefotaxime [5]. |
| CARD (Comprehensive Antibiotic Resistance Database) | A curated database containing ARGs, their products, and associated antibiotics. | Reference database for annotating putative ARGs from metagenomic sequencing data [6]. |
| ARGs-OAP (Online Analysis Pipeline) | A bioinformatic pipeline and database for the quantification and risk ranking of ARGs from metagenomic data. | Used in global livestock study to compute ARG risk scores based on mobility, host, and clinical relevance [7]. |
| Prodigal | A software tool for predicting protein-coding genes in prokaryotic genomes and metagenomic assemblies. | Used to identify open reading frames (ORFs) in assembled contigs from wild rodent gut metagenomes [6]. |
| MEGAHIT | A metagenome assembler for assembling large and complex sequencing data. | Used for de novo assembly of contigs from WWTP metagenomes in the global survey [4] [8]. |
| Kraken2 | A system for assigning taxonomic labels to metagenomic DNA sequences. | Used for taxonomic profiling and removing contaminant (e.g., human) sequences from environmental metagenomes [8]. |
Discussion and Future Perspectives
The study of the resistome has fundamentally shifted our understanding of antimicrobial resistance from a solely clinical problem to an ecological and evolutionary one. Evidence from diverse environments—from the guts of wild rodents to global wastewater systems—consistently shows that ARGs are ubiquitous, diverse, and highly mobile [6] [4] [7]. The convergence of resistance and virulence genes in pathogens, facilitated by MGEs, is a particularly troubling trend identified in these environmental studies [6].
A critical challenge in resistome research is moving beyond mere cataloging to risk assessment. Not all ARGs in the environment pose an equal threat to human health. A key framework involves ranking ARG risk based on their mobility (association with MGEs), clinical relevance (known presence in human pathogens), and the host (whether they are found in pathogens) [7]. This allows researchers to prioritize which environmental ARGs require the most urgent monitoring and mitigation efforts.
Future research must focus on closing significant knowledge gaps. There is a pressing need for more direct measurements of antimicrobial use and resistome sampling in under-represented regions, particularly in Africa and parts of Asia [7]. Furthermore, understanding the precise environmental concentrations of antibiotics and other selective agents that promote HGT and enrich for resistant bacteria is crucial for informing environmental policy and waste treatment regulations [1]. Integrating resistome surveillance into a unified One Health monitoring system, which tracks ARGs in humans, animals, and the environment simultaneously, represents the most promising strategy for mitigating the global spread of antimicrobial resistance.
Antibiotic resistance genes (ARGs) represent a class of emerging contaminants posing significant threats to global public and environmental health. The antibiotic resistome encompasses all types of ARGs, including acquired and intrinsic resistance genes, their precursors, and potential resistance mechanisms within microbial communities that may require evolution or altered expression contexts to confer resistance [9]. Understanding the prevalence, diversity, and distribution of ARGs within environmental reservoirs is crucial for mitigating their transmission to pathogenic bacteria.
From a One-Health perspective, ARGs circulate continuously among the microbiomes of humans, animals, and the environment [9]. Environmental compartments serve as both natural reservoirs and hotspots for the evolution and dissemination of ARGs, with human activities significantly amplifying their abundance and mobility. This technical review examines the major environmental reservoirs of ARGs, with particular focus on wastewater treatment plants and agricultural systems, to provide researchers and drug development professionals with a comprehensive analysis of ARG prevalence in environmental resistome research.
Wastewater Treatment Plants as Critical ARG Hotspots
Prevalence and Diversity of ARGs in WWTPs
Wastewater treatment plants (WWTPs) are recognized as significant reservoirs and dissemination points for antibiotic resistance due to their role as convergence points for antibiotics, antibiotic-resistant bacteria (ARB), and ARGs from various anthropogenic sources [10]. A comprehensive global analysis of 226 activated sludge samples from 142 WWTPs across six continents revealed a core set of 20 ARGs present in all facilities, accounting for 83.8% of the total ARG abundance [4]. The most abundant ARGs identified were:
- TetracyclineResistanceMFSEffluxPump (15.2%)
- ClassB (13.5%, conferring beta-lactam resistance)
- vanT gene in the vanG cluster (11.4%, conferring glycopeptide resistance)
When aggregated by resistance mechanism, ARGs encoding antibiotic inactivation were most prevalent (55.7%), followed by antibiotic-target alteration (25.9%) and efflux pumps (15.8%). By drug class, resistance genes for beta-lactams (46.5%), glycopeptides (24.5%), and tetracyclines (16.2%) dominated the WWTP resistome [4].
Table 1: Dominant ARG Classes and Mechanisms in Global WWTPs
| ARG Classification | Specific Type | Relative Abundance (%) | Notes |
|---|---|---|---|
| By Mechanism | Antibiotic Inactivation | 55.7 | Primary resistance mechanism |
| Antibiotic-target Alteration | 25.9 | ||
| Efflux Pumps | 15.8 | ||
| By Drug Class | Beta-lactam | 46.5 | Highest prevalence |
| Glycopeptide | 24.5 | ||
| Tetracycline | 16.2 | ||
| Core Resistome | 20 universal genes | 83.8 (of total ARG abundance) | Present in all WWTPs sampled |
Global Distribution and Variation
The global distribution of ARGs in WWTPs shows distinct patterns. While total ARG abundance demonstrated no significant differences across continents, ARG richness and Shannon's H index were significantly higher in Asia than in other continents except Africa [4]. The composition of resistomes varied significantly across continents, with principal coordinate analysis revealing strong regional separation at the gene level [4].
Comparative analysis of resistomes across different habitats shows that WWTP resistomes are more similar to sewage and soil resistomes than to ocean or human gut resistomes [4]. This similarity likely results from direct interconnections between these environments, as sewage serves as WWTP influent, and soil components enter through combined sewer systems that collect both domestic sewage and stormwater.
Microbial Hosts and Transmission Dynamics
In WWTP environments, ARG composition strongly correlates with bacterial taxonomic composition, with Chloroflexi, Acidobacteria, and Deltaproteobacteria identified as major ARG carriers [4]. The abundance of ARGs positively correlates with the presence of mobile genetic elements (MGEs), with 57% of 1,112 recovered high-quality genomes containing putatively mobile ARGs [4].
WWTPs provide ideal conditions for horizontal gene transfer (HGT) due to high bacterial density and stress conditions. A functional resistome study examining municipal WWTPs found that antibiotic-resistant bacterial metagenome-assembled genomes (ARBMAGs) carried diverse virulence factor genes, with human-associated ARBMAGs exhibiting higher virulence and ARG diversity [11]. This highlights the role of WWTPs in maintaining ARGs with potential public health implications.
Agricultural Environments as ARG Reservoirs
Aquaculture Systems
Aquaculture represents a significant ARG reservoir due to the extensive use of antibiotics for disease control and growth promotion. The persistent existence, migration, and spread of ARGs in aquaculture environments can cause genetic pollution, disrupt ecological balance, and pose risks to human health [12]. Key factors influencing ARG propagation in aquaculture include:
- Long-term antibiotic abuse inducing ARB carrying ARGs in aquatic organisms
- Correlations between ARGs and antibiotics, microbial communities, and environmental factors
- Vertical and horizontal gene transfer mechanisms facilitating ARG dissemination
The impact of aquaculture extends to surrounding environments through water exchange and sediment deposition, making it a critical intervention point for controlling ARG spread.
Agricultural Soils
Agricultural soils receiving organic amendments represent substantial ARG reservoirs. Soils are particularly significant as they contain both intrinsic ARGs and externally introduced resistance genes. Research has detected up to 166 different ARGs and 9 MGEs in paddy soils, primarily including multidrug resistance, macrolide-lincosamide-streptogramin B (MLSB), and beta-lactam resistance genes [13].
Table 2: ARG Diversity in Agricultural Settings
| Agricultural Setting | ARG Diversity | Predominant ARG Types | Key Influencing Factors |
|---|---|---|---|
| Aquaculture | Not specified | Multiple classes | Antibiotic usage, water quality, microbial community |
| Paddy Soils | 166 different ARGs | Multidrug, MLSB, β-lactam | Manure application, flooding management |
| Vegetable Soils | Not specified | Tetracycline, sulfonamide, class I integrons | Fertilizer history, crop rotation |
| Orchard Soils | 46 ARGs, 6 MGEs | Sulfonamides, tetracyclines | Pest management, soil composition |
The application of manure and organic fertilizers represents a major ARG input pathway to agricultural soils. Animal manure has been identified as a repository for high levels of antibiotics, heavy metals, ARB, ARGs, and MGEs [13]. Despite regulations limiting antibiotic use in livestock production, historical application continues to influence soil resistomes due to the persistence of ARGs.
Impact of Organic Amendments
Plant-based organic materials (e.g., crop straw, biochar, coconut shell) applied to agricultural soils can significantly influence ARG abundance and dissemination. These materials affect ARG dynamics through multiple mechanisms:
- Biochar exhibits high adsorption capacity, reducing bioavailability of selective agents and creating physical barriers to HGT
- Coconut shell biochar demonstrates particularly strong ARG suppression due to microporous structures enhancing microbial spatial segregation
- Straw amendments may have variable effects, potentially reducing certain ARGs (e.g., vanR) while increasing others (e.g., bacA, rosB, mexF) [13]
The impact of organic amendments depends on material characteristics, application rates, soil properties, and local microbial communities, highlighting the context-dependent nature of ARG management strategies.
Methodologies for ARG Analysis in Environmental Reservoirs
Sampling and Processing Protocols
Standardized sampling approaches are critical for comparative resistome analysis. For WWTPs, sampling should encompass multiple treatment stages (influent, primary sludge, biologically treated sludge, anaerobically treated sludge, and effluent) to track ARG fate [11]. For agricultural settings, composite soil samples from various depths and spatial arrangements provide comprehensive coverage.
DNA extraction should use standardized commercial kits (e.g., Power Soil DNA Isolation Kit) with rigorous quality controls. For WWTP samples with high inhibitor content, additional purification steps may be necessary. DNA concentration and purity should be verified using spectrophotometric (NanoDrop) and fluorometric methods [14].
ARG Detection and Quantification Methods
Figure 1: Experimental Workflow for Environmental Resistome Analysis
Multiple methodological approaches are employed for ARG detection and quantification, each with distinct advantages and limitations:
Quantitative PCR (qPCR) and High-Throughput qPCR (HT-qPCR)
- Principle: Targeted amplification of specific ARG sequences using primer sets
- Application: HT-qPCR platforms (e.g., WaferGen SmartChip) can simultaneously screen 285 ARGs and 10 MGEs [14]
- Normalization: ARG abundance normalized to 16S rRNA gene copies for cross-comparison
- Advantages: High sensitivity, precise quantification, standardized protocols
- Limitations: Primer-dependent, limited to known ARGs, potential amplification bias
Metagenomic Sequencing
- Principle: Shotgun sequencing of total community DNA followed by bioinformatic identification of ARGs in silico
- Application: Reveals both known and novel ARGs, provides contextual data on hosts and MGEs [4]
- Bioinformatic Tools: ARG annotation using databases such as CARD, ARDB
- Advantages: Comprehensive, non-targeted, provides genomic context
- Limitations: Computational intensity, database dependency, higher cost
Culture-Based Methods
- Principle: Isolation of ARB on selective media containing antibiotics
- Application: Provides living isolates for functional characterization and pathogen identification [10]
- Advantages: Confirms functional resistance, enables further experimentation
- Limitations: Captures <1% of environmental bacteria, misses extracellular ARGs
Data Analysis and Visualization
Bioinformatic analysis of resistome data includes:
- Alpha diversity: Richness (number of unique ARGs) and Shannon index
- Beta diversity: PCoA and PERMANOVA to compare resistome structures
- Co-occurrence network analysis: Identifies relationships between ARGs, MGEs, and microbial taxa [14]
- Statistical correlation: Links environmental factors with ARG abundance
Research Reagent Solutions for Resistome Studies
Table 3: Essential Research Reagents and Tools for Environmental Resistome Analysis
| Category | Specific Product/Kit | Application | Key Features |
|---|---|---|---|
| DNA Extraction | Power Soil DNA Isolation Kit (MoBio) | Environmental DNA extraction | Effective for difficult soils/sludge, inhibitor removal |
| qPCR Reagents | LightCycler 480 SYBR Green I Master | HT-qPCR reactions | Uniform amplification, compatible with automated systems |
| Sequencing | Illumina MiSeq/HiSeq platforms | Metagenomic sequencing | High throughput, appropriate read lengths for ARG assembly |
| Primer Panels | Custom HT-qPCR arrays (e.g., 296 primers) | Simultaneous ARG/MGE detection | Comprehensive coverage of major ARG classes |
| Bioinformatics | CARD, ARDB databases | ARG annotation | Curated resistance gene references |
| Culture Media | Antibiotic-supplemented agars | ARB isolation | Selective pressure for functional resistance |
Cross-Environmental Comparison and One-Health Interconnections
The transmission of ARGs across environmental compartments follows complex pathways within the One-Health framework. Wastewater discharge significantly impacts receiving environments, with studies demonstrating that effluent-receiving coastal areas contain significantly higher ARG diversity and abundance compared to reference sites [14]. Key interconnection pathways include:
- WWTP effluent → aquatic environments: Continuous discharge disseminates ARGs to rivers, lakes, and coastal waters
- Manure application → agricultural soils: Direct transfer of ARGs from animal microbiota to soil systems
- Agricultural runoff → water bodies: Transport of soil-borne ARGs to aquatic ecosystems
- Aerosolization → atmospheric transport: Dispersion of ARGs from land-applied biosolids and wastewater irrigation
Network analyses have identified specific bacterial genera as potential ARG transmission mediators, including Psychrobacter, Pseudomonas, Sulfitobacter, Pseudoalteromonas, and Bacillus [14]. These taxa demonstrate strong co-occurrence with diverse ARGs and MGEs across multiple environments, suggesting their role as potential vectors for ARG dissemination.
Figure 2: ARG Transmission Pathways in One-Health Context
Environmental reservoirs, particularly WWTPs and agricultural systems, represent critical control points for managing the global spread of antibiotic resistance. WWTPs contain diverse, abundant resistomes with a core set of universally present ARGs, while agricultural systems serve as amplification sites where ARGs enter food chains and surrounding ecosystems.
Future research priorities should include:
- Standardized methodologies for cross-study comparability
- ARG ranking systems prioritizing human health risk
- Quantitative tracking of ARG transmission at environmental interfaces
- Advanced treatment technologies specifically targeting ARG removal
Understanding the complex dynamics of environmental resistomes from a One-Health perspective is essential for developing effective interventions against the global spread of antibiotic resistance.
Core ARGs and Dominant Resistance Mechanisms Across Continents
Antibiotic resistance poses an increasingly urgent global public health challenge, with many bacterial pathogens developing resistance to major antibiotics and causing untreatable infections [4]. The aggregate collection of resistance genes in commensal microbiomes, known as the resistome, provides critical information for understanding ARG diversity and health risks in the environment [4]. Wastewater treatment plants (WWTPs) serve as particularly important reservoirs and potential spawning grounds for antibiotic resistance evolution because they receive wastewater from homes, hospitals, and pharmaceutical manufacturing facilities [4]. This technical guide synthesizes current research on core ARGs and their dominant resistance mechanisms across continents, providing a comprehensive analysis for researchers, scientists, and drug development professionals working in environmental resistome research.
Global Diversity and Distribution of ARGs
Continental Patterns in ARG Abundance and Diversity
A comprehensive global analysis of 226 activated sludge samples from 142 WWTPs across six continents has revealed that while ARGs are similarly abundant worldwide, their composition shows significant regional variation [4]. The total ARG abundance demonstrated no significant difference across the six continents (p = 0.78, Kruskal-Wallis test) [4]. However, mean ARG richness was significantly higher in Asia than in other continents except Africa [4]. When comparing ARG abundance across countries, samples from Chile (2.87 ± 0.40) and Canada (3.10 ± 0.35) showed the lowest mean ARG abundance, while samples from Switzerland (4.30 ± 0.20) and Colombia (4.26 ± 0.86) showed the highest [4].
Table 1: Global Distribution of Antibiotic Resistance Genes in Wastewater Treatment Plants
| Continent | Total ARG Abundance | ARG Richness | Noteworthy Patterns |
|---|---|---|---|
| Asia | Not significantly different | Significantly higher than other continents except Africa | Highest diversity of ARG subtypes |
| Africa | Not significantly different | Not significantly different from Asia | Limited sampling in some regions |
| Europe | Not significantly different | Lower than Asia | Country-specific variations (e.g., Switzerland high) |
| North America | Not significantly different | Lower than Asia | Canada shows low abundance |
| South America | Not significantly different | Lower than Asia | Colombia shows high abundance |
| Oceania | Not significantly different | Lower than Asia | Limited data available |
The resistome composition differs significantly across continents, with PERMANOVA showing all pairwise continental comparisons were significantly different (p < 0.05) [4]. Principal coordinate analysis (PCoA) and clustering analysis at the gene level showed a strong regional separation [4]. This geographic patterning suggests that both local environmental factors and anthropogenic influences shape the development of distinct resistomes in different regions.
Core ARGs in Global Wastewater Treatment Plants
Despite the geographical variations in resistome composition, a core set of 20 ARGs was found to be present in all WWTPs analyzed across six continents [4]. These core ARGs accounted for 83.8% of the total ARG abundance across all samples, indicating that a relatively small number of resistance genes dominate global wastewater resistomes [4].
Table 2: Core Antibiotic Resistance Genes Found in All WWTPs Across Six Continents
| Rank | ARG Name | Relative Abundance | Resistance Mechanism | Drug Class Targeted |
|---|---|---|---|---|
| 1 | TetracyclineResistanceMFSEffluxPump | 15.2% | Efflux pump | Tetracycline |
| 2 | ClassB | 13.5% | Antibiotic inactivation | Beta-lactam |
| 3 | vanT gene in the vanG cluster | 11.4% | Antibiotic target alteration | Glycopeptide |
| 4-20 | Various ARGs | 43.7% | Mixed mechanisms | Multiple classes |
When ARGs were aggregated by resistance mechanisms, those encoding antibiotic inactivation were the most abundant, accounting for approximately 55.7% of the total ARG abundance [4]. This was followed by ARGs for antibiotic-target alteration (25.9%) and efflux pumps (15.8%) [4]. When classified by drug class, ARGs conferring resistance to Beta-lactam (46.5%), Glycopeptide (24.5%), and Tetracycline (16.2%) were the most abundant [4]. The relative abundances of ARGs encoding major resistance mechanisms or drug classes were relatively consistent across samples from different geographic regions [4].
Comparative Analysis of Resistomes Across Habitats
Comparative analysis of resistomes across different environments reveals that WWTP resistomes are distinct from those found in other habitats [4]. PCoA analysis demonstrates that activated sludge resistomes are much more similar to sewage and soil resistomes than to ocean or human gut resistomes [4]. This similar ARG composition among activated sludge, sewage, and soil could be due to the interconnection of these environments, as sewage is the influent of WWTPs, and soils could also be an important source of the influent's composition, especially in combined sewer systems that collect both domestic sewage and stormwater [4].
Beyond wastewater treatment plants, other environments also show distinct resistome profiles. Analysis of 4,017 livestock manure metagenomes from 26 countries revealed that livestock and humans share similar resistome patterns, while soil, sediment, and water share a different set of similar resistome patterns, with sewage spanning the gap between these groupings [7]. Within livestock, there is a strong hierarchy in both diversity and abundance of ARGs: chicken > pig >> cattle [7].
Research Methodologies for ARG Profiling
Standardized Global Sampling and Metagenomic Analysis
The Global Water Microbiome Consortium (GWMC) has established a systematic global campaign for the collection, sequencing, and analysis of activated sludge samples using identical protocols [4]. This methodological consistency is crucial for meaningful cross-continental comparisons, as previous studies with non-unified protocols exhibited limited concordance [4].
Sample Collection and Sequencing: The global analysis involved community DNA from 226 samples sequenced to obtain a total of 2.8 terabases (Tb), with an average of 12.3 ± 3.9 Gb per sample [4]. Rarefaction analysis of the sequencing reads mapping to bacterial 16S rRNA genes and ARGs showed that the sequencing depth was sufficient to represent the diversity of AS microbiomes and resistomes [4].
Bioinformatic Processing: Overall, 36,147,212 contigs longer than 1 kb were assembled from all filtered metagenomic reads, and 34,860,381 non-redundant open reading frames (ORFs) were predicted [4]. Of these ORFs, 37,029 (0.11%) were annotated as ARG sequences using a consistent pipeline [4]. To assess geographical distribution, ARG abundance was normalized to the ARG copy number per bacterial cell [4].
Advanced Methodologies for Species-Resolved ARG Profiling
Current short-read-based ARG profiling methods are limited in their ability to provide detailed host information, which is indispensable for tracking the transmission and assessing the risk of ARGs [15]. To address this limitation, novel approaches like Argo have been developed that leverage long-read overlapping to rapidly identify and quantify ARGs in complex environmental metagenomes at the species level [15].
The Argo workflow involves:
- ARG Identification: Reads carrying at least one ARG are identified using DIAMOND's frameshift-aware DNA-to-protein alignment against a curated database called SARG+ [15].
- Taxonomic Classification: ARG-containing reads undergo two major steps for taxonomic classification: mapping to a reference taxonomy database using minimap2's base-level alignment, and overlapping with each other to build an overlap graph [15].
- Read Clustering: The overlap graph is segmented into components using the Markov Cluster (MCL) algorithm, with reads originating from the same genomic region tending to cluster together [15].
This approach significantly enhances the resolution of ARG detection by assigning taxonomic labels collectively to clusters of reads, rather than to individual reads, overcoming limitations of traditional metagenomic profiling strategies [15].
Diagram 1: Argo workflow for species-resolved ARG profiling
Experimental Evolution Protocols
Experimental evolution serves as a powerful complementary approach to study the emergence and dynamics of antibiotic resistance under controlled laboratory conditions [16]. This method allows researchers to dissect pathogen adaptation to antibiotics during the evolutionary process in real-time [16].
Various evolution methods utilize different population sizes, selection strengths, and bottlenecks [17]. Key experimental setups include:
- Drug Gradient Evolution: Bacteria are evolved in increasing drug gradients that guarantee high-level antibiotic resistance, promising to identify the most potent resistance-conferring mutations [17].
- Increment Evolution: Bacteria are exposed to a daily relative increase of drug concentration (e.g., 25%, 50%, or 100% increase per day), applying different selection pressures [17].
These approaches have revealed that despite utilizing different selection regimens, key mutations that confer antibiotic resistance as well as phenotypic changes like collateral sensitivity and cross-resistance emerge independently of the selection regime [17]. However, lineages that underwent evolution under mild selection displayed a growth advantage independently of the acquired level of antibiotic resistance compared to lineages adapted under maximal selection in a drug gradient [17].
Diagram 2: Experimental evolution approaches for studying antibiotic resistance
The Scientist's Toolkit: Essential Research Reagents and Materials
Table 3: Essential Research Reagents and Materials for ARG Studies
| Category | Item | Function/Application | Key Features |
|---|---|---|---|
| Sequencing Technologies | Illumina short-read platforms | High-throughput ARG profiling | High accuracy, cost-effective for large samples |
| Oxford Nanopore Technologies | Long-read sequencing for host attribution | Real-time sequencing, long reads for context | |
| PacBio SMRT sequencing | Long-read sequencing for complete ARG context | High accuracy long reads | |
| Reference Databases | CARD (Comprehensive Antibiotic Resistance Database) | Reference for ARG identification | Curated collection of resistance elements |
| SARG (Structured ARG Database) | Reference for ARG identification | Environment-focused ARG collection | |
| GTDB (Genome Taxonomy Database) | Taxonomic classification | Quality-controlled taxonomic framework | |
| NDARO (National Database of Antibiotic Resistant Organisms) | Reference for clinically relevant ARGs | Clinically focused resistance database | |
| Bioinformatic Tools | DIAMOND | DNA-to-protein alignment for ARG identification | Frameshift-aware, high sensitivity |
| minimap2 | Read mapping and overlap detection | Efficient long-read alignment | |
| MCL (Markov Cluster) algorithm | Read clustering for host attribution | Graph-based clustering of overlapping reads | |
| Argo | Species-resolved ARG profiling | Integrated long-read analysis pipeline | |
| Laboratory Evolution Materials | Mueller-Hinton broth II | Standardized medium for evolution experiments | Consistent growth conditions |
| 96-deep-well dishes | High-throughput evolution experiments | Parallel processing of multiple lineages | |
| Antibiotic stock solutions | Selective pressure in evolution experiments | Controlled concentration gradients |
Drivers and Dynamics of ARG Distribution
Relationship Between Resistomes and Microbiomes
Strong associations exist between WWTP bacterial community structure and their resistomes [4]. Procrustes analysis yielded a matrix-matrix correlation coefficient of 0.74 for metagenome 16S-based bacterial community structure, and a coefficient of 0.70 for 16S amplicon-based bacterial community structure (protest, p < 0.001) [4]. This indicates that variations in the resistome are closely tied to the overall microbial community composition.
Major bacterial taxa serving as ARG carriers in WWTPs include Chloroflexi, Acidobacteria and Deltaproteobacteria [4]. The abundance of ARGs positively correlates with the presence of mobile genetic elements, with 57% of the 1,112 recovered high-quality genomes possessing putatively mobile ARGs [4]. This highlights the importance of horizontal gene transfer in the dissemination of antibiotic resistance.
Interactions Between Different Resistance Mechanisms
Important constraints govern the interactions between different resistance mechanisms, which may allow better prediction and control of antibiotic resistance evolution [18]. Research assessing the fitness of 144 mutant-ARG combinations in Escherichia coli subjected to eight different antibiotics at 11 different concentrations revealed that while most interactions are neutral, significant interactions occur for 12% of the mutant-ARG combinations [18].
The ability of most ARGs to confer high-level resistance at a low fitness cost shields the selective dynamics of mutants at low drug concentrations [18]. This means that high-fitness mutants are often selected regardless of their resistance level [18]. Additionally, strong negative epistasis can occur between unrelated resistance mechanisms, such as between the tetA tetracycline resistance gene and loss-of-function nuo mutations involved in aminoglycoside tolerance [18].
Environmental and Anthropogenic Factors
Resistome variations appear to be driven by a complex combination of stochastic processes and deterministic abiotic factors [4]. Previous studies have investigated how environmental variables such as temperature, pH, gross domestic product (GDP), and population density affect the aggregate collection of resistance genes [4].
The role of different environments as reservoirs of clinically relevant ARGs is increasingly recognized. Studies of shrimp aquaculture operations in Ecuador revealed that 73% of sequenced isolates contained at least one ARG, with an average of two ARGs per isolate [19]. Among these, ARGs conferring resistance to the β-lactam class of antibiotics were observed in 65% of the sequenced isolates from water and 54% of the isolates from shrimp [19]. Many ARGs were shared across diverse bacterial species, underscoring the risk of horizontal gene transfer in these environments [19].
The identification of a core set of 20 ARGs present in WWTPs across six continents, accounting for the majority of resistance genes in these environments, provides critical insights for monitoring and potentially mitigating the spread of antibiotic resistance. The predominance of antibiotic inactivation as a resistance mechanism (55.7% of ARG abundance) highlights the importance of focusing on this resistance pathway in drug development efforts. The strong association between bacterial community composition and resistome structure, coupled with the positive correlation between ARG abundance and mobile genetic elements, underscores the complex ecological dynamics driving resistance dissemination. As research methodologies advance, particularly with the development of species-resolved profiling techniques like Argo and sophisticated experimental evolution protocols, our ability to track, understand, and ultimately combat the global spread of antibiotic resistance will continue to improve, contributing to the broader framework of One Health initiatives addressing this critical public health challenge.
Antibiotic resistance genes (ARGs) are recognized as emerging environmental contaminants, posing a significant threat to global public health and ecosystem functioning. The collection of ARGs within a microbial community, known as the resistome, represents a dynamic reservoir of resistance determinants that can be transferred between environmental bacteria and clinical pathogens. Understanding the factors that shape the prevalence and distribution of ARGs in environmental resistomes constitutes a critical research frontier in the One Health framework. This technical guide examines the complex interplay between biotic drivers (microbial carriers and community interactions) and abiotic drivers (environmental selective pressures) in controlling the environmental dissemination of ARGs. Through a synthesis of current research and experimental approaches, we provide researchers with methodological frameworks and analytical tools for investigating these relationships across diverse habitat types.
Contrasting Drivers in Different Environmental Habitats
Distinct Drivers Shape Phyllosphere vs. Soil Resistomes
Comparative studies across habitat types reveal that biotic and abiotic factors exert distinct influences depending on environmental context. A large-scale investigation of resistomes across a >4,000 km transect in natural ecosystems of Australia demonstrated that the phyllosphere (plant aerial surfaces) and soil habitats exhibit contrasting biogeographic patterns driven by different mechanisms [20].
Table 1: Contrasting Drivers of Phyllosphere and Soil Resistomes
| Parameter | Phyllosphere | Soil |
|---|---|---|
| Primary Drivers | Biotic factors | Abiotic factors |
| Main Correlates | Bacterial, fungal, and protistan community composition | Mean annual temperature, precipitation, soil total carbon and nitrogen |
| Distance-Decay Relationship | Not significant | Significant (though weak effect size) |
| Dominant ARG Classes | Multidrug, beta-lactamase (85.26% combined) | Multidrug (54.25% of total abundance) |
| Microbial Diversity | Lower | Significantly higher |
The phyllosphere resistome was primarily correlated with the composition of co-occurring bacterial, fungal, and protistan communities, indicating that biotic interactions are the main drivers shaping resistance patterns in this habitat. In contrast, soil ARG abundance was mainly associated with abiotic factors including climatic variables (mean annual temperature and precipitation) and edaphic properties (soil total carbon and nitrogen) [20]. This fundamental distinction highlights the importance of habitat characteristics in determining the relative importance of different drivers.
Microbial Diversity as a Natural Barrier to ARG Establishment
The diversity of environmental microbiomes can serve as a natural barrier to the establishment and persistence of ARGs, particularly in structured environments. A pan-European study of forest soils and riverbed environments found that in soils, higher diversity, evenness, and richness were significantly negatively correlated with the relative abundance of >85% of ARGs [21].
The number of detected ARGs per sample was inversely correlated with diversity in soil environments, which represent structured, stationary habitats where long-term, diversity-based resilience against immigration can evolve. This barrier effect was attributed to more complete niche occupation in high-diversity communities, reducing opportunities for invading ARBs to establish. However, this effect was not observed in the more dynamic riverbed environments, suggesting that environmental stability moderates the protective effect of diversity [21].
Figure 1: Microbial Diversity as a Barrier to ARG Establishment
Major Abiotic Drivers and Selective Pressures
Non-Antibiotic Environmental Contaminants
While antibiotics represent obvious selective pressures for ARG enrichment, numerous non-antibiotic contaminants have been demonstrated to accelerate the spread of resistance genes through various mechanisms [22]:
- Metallic nanoparticles (e.g., Al₂O₃, Ag, CuO, ZnO) can promote horizontal gene transfer of ARGs
- Microplastics provide stable surfaces for biofilm formation and concentrated gene transfer
- Other environmental pollutants including disinfectants, non-antibiotic pharmaceuticals, and pesticides
These non-antibiotic chemicals can exert selective pressure through co-selection mechanisms, where genetic elements carrying resistance to metals also harbor ARGs, or through direct stimulation of horizontal gene transfer processes [22].
Climatic and Edaphic Factors
Abiotic environmental parameters significantly influence ARG abundance and distribution patterns. In soil environments, climatic factors including mean annual temperature and precipitation emerge as key drivers of resistome composition [20]. Additionally, soil chemical properties, particularly total carbon and nitrogen content, correlate strongly with ARG patterns [20].
In aquatic systems, salinity plays a crucial role in shaping resistome profiles. Studies of saline groundwater have revealed significant variations in the abundance of bacitracin and sulfonamide ARGs across salinity gradients [23]. Salinity influences resistome composition both directly through physiological effects on microbial cells and indirectly by shaping the composition of the microbial community [23].
Table 2: Key Abiotic Drivers of Environmental Resistomes
| Driver Category | Specific Factors | Observed Effects on ARGs | Primary Mechanisms |
|---|---|---|---|
| Climate | Mean annual temperature | Correlation with soil ARG abundance | Temperature-dependent microbial growth and gene transfer |
| Precipitation | Correlation with soil ARG abundance | Moisture-mediated microbial dispersal and activity | |
| Soil Chemistry | Total carbon | Positive correlation with ARG abundance | Nutrient availability supporting host bacteria |
| Total nitrogen | Positive correlation with ARG abundance | Nutrient enrichment stimulating microbial growth | |
| Water Quality | Salinity | Alters resistome composition across gradients | Osmoregulatory stress and community shifts |
| pH | Influences conjugative transfer frequency | Cellular physiology and membrane permeability | |
| Pollutants | Metal nanoparticles | Promotes HGT of ARGs | Oxidative stress inducing SOS response |
| Microplastics | Acts as ARG transfer hotspot | Biofilm formation and close cell proximity |
Biotic Drivers and Microbial Carriers
Microbial Host Communities as ARG Reservoirs
The composition and structure of microbial communities fundamentally determine the diversity and abundance of ARGs in environmental resistomes. Different bacterial phyla exhibit varying capacities for carrying and transferring ARGs:
- Proteobacteria demonstrate the highest propensity for carrying ARGs, with proportions 9-20 times greater than other microorganisms [24]
- Actinobacteria and Bacteroidetes also serve as significant ARG reservoirs in various environments
- The relative abundance of these bacterial groups directly influences the resistome profile of a habitat
In the phyllosphere, the dominance of Proteobacteria (79.38% of sequences) coincides with a resistome dominated by multidrug and beta-lactamase resistance genes [20]. In contrast, soil environments with more diverse microbial communities dominated by Actinobacteria (37.73%) exhibit different ARG profiles [20].
Inter-kingdom Interactions and Horizontal Gene Transfer
Complex interactions between different microbial kingdoms significantly influence ARG dynamics in environmental resistomes:
- Antagonism between bacterial and fungal communities can lead to production of antibiotics, exerting selection pressure for the evolution of ARGs [20]
- Protistan predation creates selective pressures that may favor resistant bacteria
- Mobile genetic elements (MGEs) including plasmids, transposons, and integrons facilitate the horizontal transfer of ARGs between diverse microbial hosts
The abundance of MGEs strongly correlates with ARG prevalence across environments, with studies showing that integrase genes and transposase genes are widely detected in various habitats including air, sediment, and water [25]. The close association between MGEs and ARGs enables the rapid dissemination of resistance determinants across taxonomic boundaries.
Experimental Approaches and Methodologies
Standardized Protocols for Resistome Analysis
Sample Collection and Preservation
Proper sample handling is critical for accurate resistome characterization:
- Soil samples: Collect from top 20 cm after removing plant residue and stones; multiple soil cores should be taken, gathered, and mixed at each sampling site [25]
- Water samples: Aseptically collect from 10-20 cm below water surface using sterilized containers [25]
- Particulate matter: Collect using portable atmospheric particulate matter samplers with appropriate fractionating inlets; enrich on quartz microfiber filters [25]
- Preservation: Promptly freeze samples, transport to laboratory, and store at 4°C or -20°C until processing [25]
DNA Extraction and Quality Control
Standardized DNA extraction protocols ensure comparable results across studies:
- Use commercial DNA extraction kits (e.g., PowerSoil DNA isolation kit) following manufacturer's instructions [24] [26]
- For stool samples, apply Human Microbiome Project protocol with modifications: suspend subsamples in lysis buffer, shake, centrifuge, incubate at 65°C for 10 min followed by 95°C for 10 min with shaking [26]
- Quantify DNA using fluorometric methods (e.g., Qubit analyzer) [26]
- Verify DNA quality through gel electrophoresis and spectrophotometric ratios
High-Throughput Quantitative PCR (HT-qPCR)
HT-qPCR provides sensitive, quantitative detection of ARGs and MGEs:
- Utilize SmartChip Real-time PCR system with 414 primer pairs targeting 290 ARG subtypes, 30 MGEs, and 16S rRNA gene [25]
- Perform thermal cycling: initial denaturation at 95°C for 10 min, followed by 40 cycles of denaturation at 95°C for 30 s and annealing at 60°C for 30 s [25]
- Include non-template negative controls and perform PCR reactions in triplicate [25]
- Set detection limit at threshold cycle (Ct) lower than 31; consider data positive only with ≥2 technical replicates above detection limit [25]
Figure 2: Experimental Workflow for Resistome Analysis
Metagenomic Sequencing and Analysis
Shotgun metagenomics provides comprehensive resistome profiling:
- Perform library construction with 1 μg qualified DNA, fragmented to 350 bp for Illumina sequencing [24]
- Conduct sequencing on Illumina platforms (NovaSeq, HiSeq 2000) using paired-end approaches [24] [26]
- Process raw reads: quality control (FastQC), trimming (FASTX-Toolkit), removal of human sequences [26]
- Perform metagenomic assembly using Ray Meta or SOAPdenovo with appropriate k-mer lengths [24] [26]
- Predict open reading frames using MetaGeneMark and remove short sequences (<140 amino acids) [26]
- Annotate ARGs by comparing to resistance databases (CARD, ARDB) using BLAST
Data Processing and Normalization
Accurate quantification requires appropriate normalization strategies:
- Calculate gene copy number: ( \text{Gene copy number} = 10^{(31-Ct)/(10/3)} ) [25]
- Determine relative abundance: ( \text{Relative abundance} = \frac{\text{Gene copy number}}{16S rRNA \text{ gene copy number}} ) [25]
- Calculate absolute abundance: ( \text{Absolute abundance} = \text{Relative abundance} \times 16S rRNA \text{ gene absolute copies} ) [25]
- For metagenomic data, normalize as hits per million reads or fragments per kilobase per million
The Scientist's Toolkit: Essential Research Reagents and Materials
Table 3: Essential Research Reagents and Materials for Resistome Studies
| Category | Specific Items | Function/Application | Examples/Specifications |
|---|---|---|---|
| Sampling Equipment | Portable particulate matter samplers | Collection of airborne ARGs | Models with PM₂.₅/PM₁₀ fractionating inlets [25] |
| Sterile containers | Preservation of sample integrity | Pre-sterilized plastic devices for water/soil [25] | |
| Soil corers | Standardized soil collection | Devices for top 20 cm soil sampling [25] | |
| DNA Processing | DNA extraction kits | Nucleic acid isolation | PowerSoil DNA isolation kit, soil genomic DNA extraction kits [24] [26] [25] |
| Fluorometric quantitation | DNA concentration measurement | Qubit analyzer with dsDNA assays [26] | |
| Quality control instruments | DNA purity assessment | Agilent 2100 Bioanalyzer, spectrophotometers [24] | |
| Molecular Analysis | HT-qPCR systems | High-throughput ARG quantification | SmartChip Real-time PCR system [25] |
| Sequencing platforms | Metagenomic resistome profiling | Illumina NovaSeq, HiSeq 2000 [24] [26] | |
| PCR reagents | Amplification of target genes | SYBR green jump start mixes, specific primers [26] | |
| Bioinformatic Tools | Quality control software | Sequence data assessment | FastQC, FASTX-Toolkit [26] |
| Assembly programs | Metagenome reconstruction | Ray Meta, SOAPdenovo [24] [26] | |
| Gene prediction tools | ORF identification | MetaGeneMark [24] [26] | |
| ARG databases | Reference for annotation | CARD, ARDB, SARG [25] |
The complex interplay between biotic and abiotic drivers fundamentally shapes the distribution, abundance, and dynamics of antibiotic resistance genes in environmental resistomes. Key findings from current research indicate:
- The relative importance of biotic versus abiotic factors is highly habitat-dependent, with phyllosphere resistomes driven mainly by microbial community composition, while soil resistomes respond more strongly to abiotic conditions [20]
- Microbial diversity serves as a significant barrier to ARG establishment in structured environments, though this effect diminishes in dynamic habitats [21]
- Non-antibiotic factors including metals, microplastics, and environmental parameters can drive ARG propagation through co-selection and direct stimulation of gene transfer [22]
Future research directions should focus on: (1) developing standardized frameworks for assessing ARG health risks across different environmental matrices; (2) elucidating the mechanisms by which non-antibiotic factors promote horizontal gene transfer; (3) exploring interventions that enhance microbial community resilience against ARG invasion; and (4) integrating molecular data with ecological modeling to predict ARG dissemination patterns under changing environmental conditions.
The methodological approaches outlined in this technical guide provide researchers with robust tools for investigating these complex relationships, ultimately contributing to improved risk assessment and management strategies for environmental antibiotic resistance.
Antimicrobial resistance (AMR) presents a critical global health challenge, driven by the complex interconnectedness of human, animal, and environmental health systems. The "One Health" framework integrates these domains to comprehensively address AMR at its roots [27]. Central to this approach is the study of resistomes—the comprehensive collection of antibiotic resistance genes (ARGs) within microbial communities—which transcend individual ecosystems and circulate freely among humans, animals, and the environment [28]. This biological connectivity forms what is increasingly recognized as the "One Health Microbiome," where bacterial strains and their resistance genes are extensively shared across domains through mechanisms of dispersal and ecological filtering [28].
The environmental dimension plays a particularly crucial yet underappreciated role in AMR dissemination. Environmental resistomes present in soil, water, air, and waste act as significant reservoirs and transmission vectors for ARGs via horizontal gene transfer, mobile genetic elements, and co-selectors like heavy metals and biocides [27]. Understanding these transmission pathways is essential, as resistomes from different compartments exhibit distinct yet interconnected profiles. For instance, activated sludge from wastewater treatment plants (WWTPs) shows resistome compositions more similar to sewage and soil than to human gut or ocean environments [4]. This interconnection underscores why effective AMR mitigation requires surveillance and intervention strategies that span all One Health compartments, moving beyond traditional clinical-focused approaches to include environmental and animal reservoirs.
Quantitative Comparison of Resistomes Across One Health Compartments
Distribution and Diversity of ARGs Across Ecosystems
Comprehensive comparative analyses reveal distinct patterns in the abundance, diversity, and composition of resistomes across different ecosystems. A global study of 226 activated sludge samples from 142 wastewater treatment plants across six continents identified a core set of 20 ARGs present in all facilities, accounting for 83.8% of the total ARG abundance [4]. The most abundant resistance mechanisms detected were antibiotic inactivation (55.7%), antibiotic-target alteration (25.9%), and efflux pumps (15.8%) [4]. When categorized by drug class, resistance genes for Beta-lactam (46.5%), Glycopeptide (24.5%), and Tetracycline (16.2%) antibiotics were predominant in wastewater environments [4].
In agricultural systems, analysis of 4,017 livestock manure metagenomes from 26 countries demonstrated a clear hierarchy in ARG abundance and diversity: chicken > pig >> cattle [7]. This pattern aligns with the intensity of antimicrobial use in these livestock sectors. Notably, comparative analysis showed that livestock and human resistomes share similar patterns, while soil, sediment, and water environments share a different set of resistome profiles, with sewage representing an intermediate between these groupings [7].
Table 1: Comparison of Key Resistome Characteristics Across One Health Compartments
| Compartment | Dominant ARG Classes | Key Bacterial Hosts | Noteworthy Characteristics |
|---|---|---|---|
| Wastewater | Beta-lactam (46.5%), Glycopeptide (24.5%), Tetracycline (16.2%) | Chloroflexi, Acidobacteria, Deltaproteobacteria | 57% of high-quality genomes contain putatively mobile ARGs; Core set of 20 ARGs universal across global plants |
| Livestock Manure | Varies by animal; Tetracycline, MLS predominating | Specialist gut adapted communities | Clear hierarchy: chicken > pig >> cattle in both diversity and abundance |
| Raw Milk | Beta-lactams, Tetracyclines, Aminoglycosides, Chloramphenicol | Actinobacteria, Firmicutes | Abundance up to 3.70×10⁵ copies/g; Distribution driven by physicochemical properties, MGEs, and microbial communities |
| Bamboo Phyllosphere | Tetracycline, MLS, Glycopeptides, Peptides | Pseudomonas, Sphingomonas | First evidence of ARGs in endangered species' food source; Composition varies significantly by plant species |
Drivers of Resistome Diversity and Abundance
Multiple studies have identified the complex interplay of factors shaping resistome profiles across ecosystems. In wastewater treatment systems, resistome variations appear to be driven by a complex combination of stochastic processes and deterministic abiotic factors [4]. A strong correlation exists between ARG abundance and the presence of mobile genetic elements, with 57% of 1,112 recovered high-quality genomes possessing putatively mobile ARGs [4].
In raw milk from northwest Xinjiang, variance partitioning analysis revealed that ARG distribution was primarily driven by three factors: the combined effect of physicochemical properties and mobile genetic elements (33.5%), the interplay between physicochemical parameters and microbial communities (31.8%), and the independent contribution of physicochemical factors (20.7%) [29]. This highlights how local environmental conditions and microbial community structure jointly shape resistome profiles in food systems.
Globally, significant differences in ARG composition are observed across geographic regions. In wastewater treatment plants, ARG composition differs significantly across continents and is distinct from that of the human gut and oceans [4]. Principal coordinate analysis demonstrates strong regional separation at the gene level, with PERMANOVA confirming significantly different resistomes between all pairwise continent comparisons [4].
Table 2: Methodological Approaches for Resistome Analysis Across One Health Compartments
| Method Category | Specific Techniques | Key Applications in One Health | Strengths | Limitations |
|---|---|---|---|---|
| Sequence-Based Detection | High-throughput qPCR, Illumina sequencing (16S rRNA), Shotgun metagenomics | Broad profiling of ARG diversity and abundance; Bacterial community characterization | High sensitivity for qPCR; Comprehensive coverage for metagenomics | qPCR: limited to predefined targets; Metagenomics: limited sensitivity (~1 gene copy/103 genomes) |
| Long-Read Technologies | Nanopore, PacBio sequencing, L-ARRAP pipeline | Resolving ARG genomic context, mobility potential, and host associations | Resolves complete genetic context of ARGs; Identifies ARG-MGE linkages | Higher error rates; More complex data analysis; Higher cost |
| Mobility Assessment | Exogenous plasmid capture, inverse PCR, epicPCR, contig-based analysis | Direct assessment of ARG transfer potential; Linking ARGs to MGEs | Provides direct evidence of mobility; Functional validation | Low throughput; Technically challenging; Not suitable for large-scale surveillance |
| Risk Ranking | ARG risk indices (e.g., L-ARRI), QMRA frameworks, SARG database | Prioritizing high-risk ARG combinations for intervention | Integrates mobility, pathogenicity, clinical relevance | Often based on historical worst-case contexts rather than actual risk in sample |
Methodologies for One Health Resistome Surveillance
Sample Collection and Processing Protocols
Standardized protocols for sample collection and processing are fundamental for robust cross-compartmental resistome analysis. In a global wastewater surveillance study, 226 activated sludge samples from 142 wastewater treatment plants across six continents were collected using identical protocols to ensure comparability [4]. For raw milk analysis, researchers employed aseptic collection techniques, transferring samples into 200-milliliter sterile plastic containers, flash-freezing on dry ice within 15 minutes of collection, and maintaining continuous cryogenic conditions (-20°C) during transport, with final storage at -80°C until DNA extraction [29].
DNA extraction methods must be optimized for specific sample matrices. For raw milk samples, a modified CTAB protocol optimized for liquid substrates has been successfully employed, where microbial cells are centrifuged and lysed with lysozyme and protease K [29]. DNA purity should be verified (A260/A280 >1.8) using spectrophotometry, and extraction blanks should be included to monitor potential contamination [29].
Molecular Detection and Quantification Methods
Various molecular techniques enable the detection and quantification of ARGs across different One Health compartments:
High-throughput quantitative PCR (HT-qPCR) using systems like the WaferGen SmartChip Real-time PCR platform allows simultaneous screening of hundreds of ARG targets. This approach typically employs 348 primer pairs targeting 330 ARGs, 17 mobile genetic elements, and one 16S rRNA gene as an internal reference [29]. Detection requires amplification in all technical replicates with a cycle threshold (CT) set at 35, and gene quantification utilizes the formula 10^(35 − CT)/(10/3) for relative copy number calculation [29].
Metagenomic sequencing provides comprehensive resistome profiling without primer bias. For Illumina-based approaches, the hypervariable V3–V4 regions of the bacterial 16S rRNA gene are amplified using barcoded primers, with libraries constructed using the TruSeq DNA PCR-Free Sample Preparation Kit and sequenced on platforms like Illumina NovaSeq6000 [29]. For more contextual information, long-read sequencing technologies (Nanopore, PacBio) enable complete assembly of ARG contexts, including association with mobile genetic elements.
Diagram 1: Experimental workflow for One Health resistome analysis, showing parallel pathways from sample collection to integrated risk assessment.
Bioinformatic Analysis and Risk Assessment Pipelines
Advanced bioinformatic tools are essential for interpreting resistome data within a One Health context. The Long-read based Antibiotic Resistome Risk Assessment Pipeline (L-ARRAP) calculates the Long-read based Antibiotic Resistome Risk Index (L-ARRI) to quantify antibiotic resistome risks by leveraging long-read sequencing advantages to concurrently identify ARGs, mobile genetic elements, and human bacterial pathogens, integrating their interactions for risk scoring [30].
For short-read data, contig-based assembly and analysis pipelines can reconstruct ARG contexts, while co-occurrence network analysis identifies potential host-ARG relationships. Procrustes analysis has been successfully used to reveal correlations between microbial community structure and ARG profiles, demonstrating that bacterial community composition is a strong determinant of resistome structure [4] [29].
Mobility and Risk Assessment of Environmental ARGs
Frameworks for Evaluating ARG Risk Potential
Translating environmental ARG detection into meaningful risk assessment remains challenging. A prominent framework proposed by Zhang et al. utilizes four key indicators to rank individual ARGs: (1) Circulation - whether the ARG is shared between different One Health settings with increased abundance due to human activities; (2) Mobility - association with mobile genetic elements that increase likelihood of transfer to pathogens; (3) Pathogenicity - detection in human or animal pathogens; and (4) Clinical relevance - association with worsened treatment outcomes [31].
These factors allow assigning risk ranks to ARGs, with the abundance of high-risk ARGs then quantified through surveillance methods. However, this approach has limitations as it doesn't consider the actual genetic and bacterial host context in surveyed samples, potentially overestimating risks when ARGs appear chromosomally in non-pathogenic, non-colonizing bacteria [31]. More nuanced approaches are emerging that integrate actual ARG-host and ARG-MGE associations from surveillance data rather than relying on historical worst-case scenarios.
Integrating Mobility into Risk Assessment
ARG mobility plays a crucial role in determining epidemiological risk, particularly in environmental compartments. While clinical and veterinary surveillance should prioritize ARG-host associations (as ARGs in pathogens can directly cause treatment failure), environmental surveillance should prioritize ARG-MGE associations because ARGs in the environment may undergo multiple bacterial host transitions before reaching pathogenic hosts [31].
The association of ARGs with plasmids as the main drivers of ARG transfer is particularly important, as plasmids facilitate transfer across phylogenetically diverse bacterial species, increasing the risk of ARGs ending up in human or animal pathogens [31]. Methodological advances now enable more precise assessment of ARG mobility, including:
- Contig-based analysis of metagenomic assemblies to identify ARG-MGE linkages
- Long-read sequencing to resolve complete genetic contexts
- PCR-based genotype association assays that link ARGs to specific MGEs
- Exogenous plasmid capture for functional validation of mobility
Diagram 2: One Health risk assessment framework integrating circulation, mobility, pathogenicity, and clinical relevance factors for ARG prioritization.
Quantitative Microbial Risk Assessment (QMRA) Integration
Quantitative Microbial Risk Assessment (QMRA) frameworks provide structured approaches to quantify AMR risks by integrating hazard identification, exposure assessment, dose-response analysis, and risk characterization [31]. These frameworks are particularly valuable for evaluating risks against established benchmarks and informing management decisions. For AMR, QMRA should integrate data on:
- ARG abundance and diversity in exposure sources
- ARG mobility potential based on MGE associations
- Exposure routes and frequencies for different populations
- Host susceptibility factors affecting colonization resistance
- Dose-response relationships for specific ARG-pathogen combinations
Strengthening these assessments requires genotypic AMR detection, composite and longitudinal sampling, and integration with clinical datasets [32]. Global standardization of WBE protocols, together with ARG risk-ranking frameworks and watchlists of emerging ARGs, can enhance comparability, prioritization, and diagnostic development [32].
Research Reagent Solutions for One Health Resistome Studies
Table 3: Essential Research Reagents and Platforms for One Health Resistome Analysis
| Category | Specific Product/Platform | Application in Resistome Research |
|---|---|---|
| DNA Extraction Kits | FastDNA SPIN Kit for soil (MPbio), Modified CTAB protocol | Optimized DNA extraction from complex matrices (soil, manure, sludge); Effective cell lysis and inhibitor removal |
| qPCR Systems | WaferGen SmartChip Real-time PCR system, High-throughput qPCR arrays | Simultaneous screening of 300+ ARG targets; High-sensitivity detection of low-abundance targets |
| Sequencing Platforms | Illumina NovaSeq6000, Nanopore, PacBio | Metagenomic characterization; Short-read for depth, long-read for ARG context and mobility |
| Bioinformatic Tools | L-ARRAP pipeline, SARG database, ARGs-OAP v3.0 | Risk index calculation; ARG annotation and classification; Standardized analysis workflows |
| Microbial Analysis | 16S rRNA primers (V3-V4), FLASH, QIIME2, Mothur | Bacterial community profiling; Identification of potential ARG hosts |
The One Health framework provides an essential paradigm for understanding and addressing the global challenge of antimicrobial resistance. Evidence consistently demonstrates extensive connectivity between human, animal, and environmental resistomes, with strain-sharing following ecological principles of dispersion and environmental filtering [28]. Wastewater treatment plants, livestock operations, and agricultural systems represent significant ARG reservoirs and hotspots for gene exchange, with mobility between compartments facilitated by mobile genetic elements.
Future advances in One Health resistome research will depend on several key developments: First, integrated surveillance systems that combine complementary methodological approaches to balance throughput with contextual insight about ARG mobility and host associations [31]. Second, improved risk assessment frameworks that incorporate temporal dynamics, quantitative transfer rates, and actual rather than theoretical genetic contexts [31]. Third, artificial intelligence and machine learning approaches that can integrate diverse datasets to predict resistance emergence and transmission patterns across One Health compartments [33].
Ultimately, effectively addressing AMR within the One Health framework will require not only scientific advances but also policy reforms, cross-sectoral collaboration, and investment in surveillance infrastructure, particularly in under-resourced regions [27]. By recognizing the fundamental interconnectedness of resistomes across human, animal, and environmental domains, we can develop more effective strategies for preserving antibiotic efficacy and protecting global health.
Cutting-Edge Metagenomics and AI for Resistome Surveillance and Analysis
The pervasive challenge of antimicrobial resistance (AMR) is intrinsically linked to the environmental resistome—the comprehensive collection of all antibiotic resistance genes (ARGs) and their precursors in both pathogenic and non-pathogenic microorganisms [34] [8]. Traditional microbiology, reliant on culturing, has historically limited our understanding of this vast genetic reservoir, as an estimated 99% of environmental bacteria resist laboratory cultivation [35]. Metagenomic sequencing has emerged as a transformative tool that bypasses this limitation, enabling direct genetic analysis of entire microbial communities from environmental samples and revolutionizing our capacity to monitor and understand the prevalence and transmission of ARGs.
This technical guide explores how metagenomic approaches are elucidating the complex dynamics of ARGs within diverse environmental niches. From the gut microbiota of wild rodents to pristine Antarctic soils and anthropogenically impacted aquatic systems, metagenomics provides an unprecedented lens through which to view the intricate interplay between microbial communities, mobile genetic elements (MGEs), and environmental selection pressures that drive the evolution and dissemination of resistance traits [6] [36] [8].
Core Metagenomic Methodologies for Resistome Profiling
Metagenomic analysis of environmental resistomes employs either sequence-based or function-based approaches, each with distinct advantages for ARG detection and characterization [34].
Sequence-Based Resistome Analysis
Sequence-based methods involve direct sequencing and computational analysis of DNA extracted from environmental samples, followed by comparison against curated ARG databases.
Table 1: Key Databases for Sequence-Based Resistome Analysis
| Database Name | Primary Function | Application in Resistome Studies |
|---|---|---|
| CARD (Comprehensive Antibiotic Resistance Database) | ARG annotation and classification | Primary reference database for identifying ARG subtypes and their resistance mechanisms [6] [36] |
| SARG | ARG identification and quantification | Used for annotating ARGs from metagenomic reads with optimized identity/coverage cutoffs (e.g., >75% identity, >90% coverage) [37] |
| MobileOG-db | Mobile genetic element annotation | Identifies MGEs that facilitate horizontal transfer of ARGs [37] |
| PlasFlow | Plasmid sequence identification | Predicts plasmid-derived sequences that may carry ARGs [36] |
| ICEberg | Integrative and conjugative elements database | Annotates ICEs that can carry and transfer ARGs between bacteria [36] |
The standard workflow for sequence-based resistome analysis typically includes: (1) DNA extraction from environmental samples (soil, water, sediment, feces); (2) high-throughput sequencing using either short-read (Illumina) or long-read (Nanopore, PacBio) platforms; (3) quality control and assembly of sequencing reads; (4) gene prediction and annotation against ARG and MGE databases; and (5) taxonomic binning to identify potential ARG hosts [6] [37] [8].
Functional Metagenomic Analysis
Functional metagenomics takes a phenotype-driven approach, involving cloning of environmental DNA into host bacteria followed by screening for resistance phenotypes. This method is particularly valuable for discovering novel ARGs without prior sequence knowledge, as it relies on expressed functions rather than sequence similarity to known genes [35]. The key advantage is its ability to identify entirely new resistance mechanisms, including those with low sequence similarity to previously characterized ARGs.
Analytical Frameworks and Tools for Resistome Data
The complexity of metagenomic datasets demands specialized bioinformatic tools for comprehensive resistome analysis. Recent advancements have produced sophisticated pipelines that address various aspects of resistome characterization.
Resistome Risk Assessment Frameworks
Novel pipelines have been developed specifically for assessing the public health risk associated with environmental resistomes. The Long-read based Antibiotic Resistome Risk Assessment Pipeline (L-ARRAP) represents a significant methodological advancement, calculating a Long-read based Antibiotic Resistome Risk Index (L-ARRI) that integrates ARG abundance, mobility potential, and association with human bacterial pathogens [37]. This framework is particularly valuable for monitoring ARG risks across different environmental niches, including wastewater, lakes, and human feces.
Visualization and Statistical Analysis Platforms
ResistoXplorer has emerged as a comprehensive web-based tool that addresses the bottleneck in downstream resistome data analysis [38]. This platform integrates recent advancements in statistics and visualization with extensive functional annotations, enabling researchers to perform composition profiling, functional profiling, comparative analysis, and integrative analysis of resistome and microbiome data without requiring extensive computational expertise.
Table 2: Analytical Pipelines for Metagenomic Resistome Studies
| Tool/Pipeline | Sequencing Platform | Key Features | Application Examples |
|---|---|---|---|
| L-ARRAP | Long-read (Nanopore, PacBio) | Quantifies ARG risk by integrating abundance, mobility, and pathogenic hosts | Hospital wastewater monitoring, lake and fecal sample analysis [37] |
| ResistoXplorer | Short-read and long-read | Visual analytics, statistical comparison, ARG-microbe association networks | Exploratory analysis of resistome profiles from diverse metagenomic studies [38] |
| MetaWRAP | Primarily short-read | Metagenomic assembly, binning, and annotation | Analysis of ARG distribution in Antarctic soils [36] |
Diagram 1: Comprehensive workflow for metagenomic analysis of environmental resistomes, encompassing sample processing, bioinformatic analysis, and data interpretation stages.
Key Research Applications and Findings
Wildlife as Reservoirs of Antimicrobial Resistance
Metagenomic analysis of wild rodent gut microbiota has revealed their significance as reservoirs of ARGs. A comprehensive study of 12,255 gut-derived bacterial genomes from wild rodents identified 8,119 ARGs and 7,626 virulence factor genes (VFGs), with the most prevalent ARGs conferring resistance to elfamycin and multiple drug classes [6]. Members of Enterobacteriaceae, particularly Escherichia coli, harbored the highest numbers of ARGs and VFGs. Critically, a strong correlation was observed between the presence of mobile genetic elements, ARGs, and VFGs, highlighting the potential for co-selection and mobilization of resistance and virulence traits between wildlife, humans, and domestic animals [6].
Anthropogenic Impact on Environmental Resistomes
Comparative metagenomic studies across contamination gradients have demonstrated significant anthropogenic influence on environmental resistomes. Analysis of soils from various locations in Tamil Nadu, India revealed higher prevalence of multidrug resistance genes (MexD, MexC, MexE, MexF, MexT, CmeB, MdtB, MdtC, OprN) in sites affected by industrial, agricultural, and hospital waste [39]. Similarly, studies of the Baltic Sea benthic sediments demonstrated that spatial variation in resistome diversity correlated with environmental gradients, with higher diversity in northern regions and declines in oxygen-depleted dead zones and southern areas [8]. Salinity and temperature were identified as primary environmental factors influencing resistome composition, with nutrient availability further shaping these patterns.
Pristine Environments as Baselines for Natural Resistomes
Analysis of minimally impacted environments provides crucial baseline data on the natural resistome. Research on Antarctic soils from different latitude regions revealed distinct ARG distribution patterns, with high-latitude regions exhibiting lower ARG abundance (0.28% of all genes) compared to low-latitude regions (1.93%) [36]. A total of 406 ARGs belonging to 25 types were identified, with multidrug, tetracycline, and aminoglycoside resistance genes being most common. The study also demonstrated that plasmids and integrative and conjugative elements (ICEs) facilitated ARG migration among α-, β- and γ-proteobacteria, even in these remote environments.
Table 3: ARG Distribution Across Environmental Niches
| Environment | Dominant ARG Types | Key Findings | Reference |
|---|---|---|---|
| Wild Rodent Gut | Elfamycin, multidrug, tetracycline | 8,119 ARGs identified; strong correlation between MGEs and ARGs; Enterobacteriaceae primary hosts [6] | [6] |
| Antarctic Soils | Multidrug, tetracycline, aminoglycoside | 406 ARGs across 25 types; significant difference between high and low latitude regions; 17% of ARGs plasmid-associated [36] | [36] |
| Polluted Soils (India) | Multidrug efflux pumps (Mex, Mdt, Cme) | Efflux mechanisms (42%) dominant followed by antibiotic inactivation (23%); correlation with heavy metal contamination [39] | [39] |
| Baltic Sea Sediments | 26 antibiotic classes represented | Resistome diversity shaped by salinity, temperature gradients and nutrient availability; decline in oxygen-depleted zones [8] | [8] |
Table 4: Essential Research Reagents and Computational Tools for Metagenomic Resistome Studies
| Category | Specific Tools/Reagents | Function | Considerations |
|---|---|---|---|
| Sequencing Platforms | Illumina, Nanopore, PacBio | DNA sequence generation | Long-read platforms better for assembly; short-read for depth [37] |
| DNA Extraction Kits | Soil DNA extraction kits, Fecal DNA kits | High-quality DNA extraction from complex matrices | Optimization needed for different sample types [6] |
| ARG Databases | CARD, SARG | Reference databases for ARG annotation | Database choice influences ARG profiling results [6] [37] |
| MGE Databases | MobileOG-db, PlasFlow, ICEberg | Identification of mobile genetic elements | Crucial for assessing ARG mobility potential [37] [36] |
| Quality Control Tools | fastp, Chopper | Read filtering and quality processing | Parameters must be optimized for specific data types [37] [8] |
| Assembly Tools | MEGAHIT, metaSPAdes | Metagenome assembly from sequencing reads | Choice affects contiguity of assembled genomes [8] |
| Gene Prediction | Prodigal | Identification of protein-coding genes | Essential for ORF-based resistome analysis [8] |
| Taxonomic Profiling | Centrifuge, Kraken2 | Microbiome composition analysis | Links ARGs to potential bacterial hosts [37] |
Diagram 2: Conceptual framework of environmental drivers influencing resistome dynamics and public health risks, highlighting the interconnected roles of environmental factors, microbial communities, and mobile genetic elements.
Metagenomic sequencing has fundamentally transformed our approach to understanding the uncultured microbiome and its role in the global antimicrobial resistance crisis. By providing culture-independent access to the vast genetic diversity of environmental microorganisms, this technology has revealed the astonishing breadth and complexity of natural resistomes and their mobilization pathways. The integration of metagenomic data with advanced computational tools and risk assessment frameworks now enables researchers to identify critical transmission pathways and intervention points for curbing the spread of resistant pathogens.
As metagenomic technologies continue to evolve, several frontiers promise to further advance environmental resistome research. The growing adoption of long-read sequencing will enhance our ability to resolve complete ARG contexts within mobile genetic elements and bacterial genomes [37]. Meanwhile, the integration of functional metagenomics with sequence-based approaches will facilitate discovery of novel resistance mechanisms [35]. Standardization of resistome risk assessment metrics across studies will enable more meaningful comparisons and meta-analyses [38] [37]. Most importantly, the continued application of these tools within a One Health framework—recognizing the interconnectedness of human, animal, and environmental reservoirs—will be essential for developing effective strategies to mitigate the global threat of antimicrobial resistance.
Antibiotic resistance genes (ARGs) in environmental reservoirs represent a critical component of the global antimicrobial resistance (AMR) crisis. Understanding their prevalence, however, is no longer sufficient. The accurate assessment of risk within the environmental resistome hinges on determining the mobility potential of ARGs—their likelihood of being transferred from environmental bacteria to human pathogens via mobile genetic elements (MGEs) such as plasmids, transposons, and integrons [40] [31]. The convergence of advanced sequencing technologies and sophisticated bioinformatic pipelines now enables researchers to move beyond mere gene quantification to a contextual understanding of ARG dissemination. This technical guide outlines the core methodologies and pipelines for identifying ARGs and their associated MGEs, framing the analysis within a risk assessment framework essential for One Health surveillance.
Core Analytical Workflow: From Raw Data to Contextual Insight
The general bioinformatic workflow for ARG and MGE analysis progresses from data generation through to risk interpretation, with each stage critical for adding a layer of contextual information.
The following diagram illustrates the primary steps in a comprehensive analysis pipeline, from processing raw sequencing data to the final risk assessment.
Sequencing Technologies: Choosing the Right Tool
The choice of sequencing technology fundamentally shapes the analytical approach and the depth of contextual information that can be recovered.
- Short-Read Sequencing (Illumina): Provides high accuracy and depth at a lower cost, making it suitable for quantifying ARG and MGE abundance in complex communities [29]. However, its limited read length struggles to resolve repetitive MGE regions and confidently link ARGs to their genetic context.
- Long-Read Sequencing (Nanopore, PacBio): Essential for resolving the complete context of ARGs. Long reads can span entire MGEs, allowing for the unambiguous determination of whether an ARG is located on a chromosome or a plasmid, and what other resistance or virulence genes are in its immediate vicinity [41]. A key application is tracking the fate of ARGs through environments like wastewater treatment plants, where long-read metagenomics revealed a 75-90% decrease in ARG abundance from influent sewage to activated sludge, and precisely quantified the proportion of plasmid-associated ARGs [41].
Bioinformatics Pipelines and Tools for Annotation
A suite of specialized bioinformatic tools has been developed to process sequencing data and annotate the resistome and mobilome.
Specialized Analysis Pipelines
- ARGem: A user-friendly, full-service metagenomic pipeline that takes raw DNA short reads through to the final visualization of results. It includes comprehensive ARG and MGE databases and integrates statistical and network analysis tools, including Cytoscape visualization for co-occurrence networks [42].
- MobileElementFinder: This tool predicts a wide range of MGEs, including insertion sequences (IS), transposons (Tn), and integrative and conjugative elements (ICE) from assembled contigs. An updated version includes an expanded database of 1,686 IS and 70 Tn, improving detection accuracy [43].
Database-Dependent Annotation
Most pipelines rely on alignment to curated reference databases.
- ARG Databases: The Comprehensive Antibiotic Resistance Database (CARD) is a widely used, manually curated resource for ARG annotation [41] [44].
- MGE Databases: Specialized databases include ACLAME, ICEberg 2.0 (for integrative and conjugative elements), ISfinder (for insertion sequences), and mobileOG-db [45].
Deep Learning for Enhanced MGE Detection
The repetitive nature of MGEs makes them particularly challenging to identify in complex metagenomes. DeepMobilome is a novel deep learning approach that uses a convolutional neural network (CNN) trained on read alignment data to accurately identify target MGE sequences. It significantly outperforms traditional tools like MGEfinder and ISMapper, achieving an F1-score of 0.935 in single-genome tests and successfully identifying ARG-carrying MGEs in real microbiome data [45].
Key Experimental Protocols and Methodologies
High-Throughput qPCR for Targeted Resistome Profiling
This method is ideal for the sensitive, quantitative screening of a predefined set of ARGs across many samples [29].
- Protocol Summary:
- DNA Extraction: Use a modified CTAB protocol for microbial cell lysis. Verify DNA purity (A260/A280 >1.8) and integrity [29].
- Primer Design: Utilize pre-validated primer sets targeting hundreds of ARGs and MGEs simultaneously. For example, one study used 348 primer pairs (330 for ARGs, 17 for MGEs, and one for 16S rRNA) [29].
- Amplification: Employ a high-throughput qPCR system (e.g., WaferGen SmartChip). Run samples in triplicate with a cycle threshold (CT) set at 35 to define the detection limit [29].
- Data Analysis: Calculate relative gene copy numbers using the formula
10(35 − CT)/(10/3). Normalize ARG abundance to the 16S rRNA gene copy number to estimate copies per gram of sample or per bacterial cell [29].
Metagenomic Sequencing for Comprehensive Profiling
This shotgun approach provides an untargeted view of all genetic material, enabling the discovery of novel ARGs and MGEs.
- Protocol Summary (Illumina-based):
- Library Preparation & Sequencing: Fragment purified DNA and prepare libraries using kits compatible with the Illumina platform (e.g., TruSeq DNA PCR-Free). Sequence on platforms like the Illumina NovaSeq6000 to generate short reads [29].
- Read Processing: Merge paired-end reads using FLASH (v1.2.7) and filter for quality, removing adapters and chimeric sequences [29].
- Assembly & Clustering: Perform de novo assembly of high-quality reads into contigs using assemblers like Spades. Cluster sequences into Operational Taxonomic Units (OTUs) at 97% similarity [29].
- ARG & MGE Annotation: Align contigs and/or unassembled reads against ARG (e.g., CARD) and MGE databases using tools like BLAST or within integrated pipelines like ARGem [42].
Long-Read Metagenomics for Contextual Resolution
This protocol is critical for linking ARGs to their MGEs and hosts.
- Protocol Summary (Nanopore-based):
- Sample Prep & Sequencing: Extract high molecular weight DNA. Prepare libraries with a ligation kit (e.g., Oxford Nanopore SQK-LSK108) without an amplification step. Sequence on a MinION device using R9.4 or later flow cells [41].
- Base Calling & QC: Convert raw signals to base sequences using Albacore or Guppy. No multiplexing is used if each library is run on a separate flow cell [41].
- Contextual Analysis: Use pipelines like the Antimicrobial Resistance Mapping Application (ARMA) or custom workflows. ARGs are identified with thresholds (>75% identity, >40% coverage), and their context (plasmid/chromosome) is determined by analyzing the long read on which they are found [41].
| Category | Item / Tool | Function / Application |
|---|---|---|
| Wet Lab | FastDNA SPIN Kit for Soil (MP Biomedicals) | DNA extraction from complex environmental samples (soil, sludge, manure) [29] [41]. |
| Zymo genomic DNA clean kit (Zymo Research) | Purification and concentration of DNA post-extraction to ensure sequencing compatibility [41]. | |
| 1D native barcoding genomic DNA kit (Oxford Nanopore) | Library preparation for long-read sequencing on Nanopore platforms [41]. | |
| Bioinformatics | ARGem Pipeline | Full-service analysis from short reads to ARG/MGE annotation, statistics, and visualization [42]. |
| DeepMobilome | Deep learning model for highly accurate identification of target MGEs in microbiome data [45]. | |
| MobileElementFinder | In-silico prediction of a wide variety of MGEs (IS, Tn, ICE) from assembled contigs [43]. | |
| Databases | CARD (Comprehensive Antibiotic Resistance Database) | Curated resource for reference sequences and ontology for ARG annotation [41] [44]. |
| ACLAME, ICEberg 2.0, mobileOG-db | Specialized databases for annotating plasmids, phages, integrative conjugative elements, and other MGEs [45]. |
Quantitative Data and Performance Metrics
A critical step in evaluating pipelines and methods is the comparison of their quantitative outputs and performance benchmarks.
Performance of Analytical Tools
Table 1: Performance metrics of bioinformatic tools for MGE identification in single-genome tests (adapted from [45])
| Tool | Methodology | F1-Score | Precision | Recall |
|---|---|---|---|---|
| DeepMobilome | Deep Learning (CNN) on read alignment | 0.935 | 0.929 | 0.942 |
| MGEfinder | Read mapping & de novo assembly | 0.755 | - | - |
| ISMapper | Direct read mapping to MGE databases | 0.670 | - | - |
Environmental ARG Abundance and Mobility
Table 2: Quantifying ARG abundance and mobility potential in environmental samples (data synthesized from [29] [41])
| Sample Type | Location / Context | Total ARG Abundance | Plasmid-Associated ARGs | Key ARG Classes Identified |
|---|---|---|---|---|
| Raw Milk | Northwest Xinjiang Farms | Up to 3.70 × 10⁵ copies/gram | Not specified | β-lactams, Tetracyclines, Aminoglycosides, Chloramphenicols [29] |
| Influent Sewage | Five WWTPs (Global) | 192 - 605 gc/Gb* | 40% - 73% | Multidrug, Glycopeptide, β-lactam [41] |
| Activated Sludge | Five WWTPs (Global) | 31 - 62 gc/Gb* | 31% - 68% | Multidrug, Glycopeptide, β-lactam [41] |
*gc/Gb: gene copies per gigabase of sequencing data.
From Identification to Risk: Integrating Mobility into Assessment
Identifying ARGs and MGEs is an intermediate step; the ultimate goal is to translate this data into an assessment of public health risk. The following diagram illustrates how bioinformatic data feeds into a mobility-informed risk assessment framework.
Current frameworks propose ranking ARG risk based on indicators such as circulation across One Health settings, proven mobility, presence in pathogens, and clinical relevance [31]. The next frontier is integrating this ranked information, particularly ARG-MGE associations, into Quantitative Microbial Risk Assessment (QMRA) models. This allows for a more realistic estimation of the probability that an environmental ARG will ultimately lead to a clinical treatment failure, moving environmental AMR surveillance from descriptive studies towards predictive risk management [31].
The Role of Mobile Genetic Elements (MGEs) in Horizontal Gene Transfer
Mobile Genetic Elements (MGEs) are discrete DNA sequences capable of moving within and between genomes, acting as primary engines of horizontal gene transfer (HGT) in microbial populations [46]. In the context of environmental resistome research, understanding MGEs is paramount as they facilitate the dissemination of antibiotic resistance genes (ARGs) across diverse bacterial communities, connecting environmental, animal, and human health through the One Health continuum [31] [47]. The dynamic interplay between MGEs and their host genomes results in complex evolutionary processes where the source of selection for maintaining a function is often unclear, making MGEs central to microbial adaptation and functional diversification [46]. This review provides an in-depth technical analysis of the mechanisms by which MGEs drive HGT, their ecological impacts, and the advanced methodologies used to study their role in the proliferation of environmental antibiotic resistance.
Classification and Mechanisms of Mobile Genetic Elements
MGEs encompass a diverse array of genetic entities that drive horizontal gene transfer through distinct mechanisms. Their autonomous nature means they can proliferate even with potential negative impacts on host fitness, shaping gene flow in microbial populations largely outside the control of recipient cells [46].
Major MGE Categories and Transfer Mechanisms
Table 1: Classification of Major Mobile Genetic Elements and Their Transfer Mechanisms
| MGE Type | Autonomous Transfer | Key Transfer Mechanism | Primary DNA Transferred | Host Range Considerations |
|---|---|---|---|---|
| Conjugative Plasmids | Yes | Conjugation via type IV secretion system and relaxase | Entire plasmid and mobilizable elements | Broad host range common, transfer across genera |
| Integrative Conjugative Elements (ICEs) | Yes | Excision from chromosome, conjugation, reintegration | Flanking chromosomal genes | Varies, can be broad |
| Transposons (Tn) | No (mobilizable) | Transposition within cell; hitchhiking on other MGEs | Often carry ARGs and other accessory genes | Limited by mobilization opportunity |
| Bacteriophages (Temperate) | Yes (via particles) | Transduction (generalized, specialized, lateral) | Host DNA fragments near integration site | Specific to bacterial strains/species |
| Phage Satellites | No (hijacker) | Hijack structural components of helper phages | Satellite DNA and adjacent host genes | Limited by helper phage specificity |
| Insertion Sequences (IS) | No (mobilizable) | Transposition within genome | Can mobilize flanking genes | Limited by mobilization opportunity |
Horizontal Gene Transfer Pathways
MGEs facilitate genetic exchange through four principal HGT pathways, each with distinct mechanisms and ecological implications for ARG dissemination [48]:
Conjugation: Requires direct cell-to-cell contact mediated by a conjugative pilus, enabling transfer of conjugative plasmids and integrative conjugative elements (ICEs). This process involves a relaxase that nicks and attaches to a single strand of DNA, with the nucleoprotein filament transferred between physically close cells via a type IV secretion system [46]. Conjugative transfer frequencies can be 10⁴ times higher in biofilms compared to suspended states due to more stable physical contact conditions [48].
Transformation: Involves uptake and integration of free environmental DNA by competent bacterial cells. Unlike conjugation, this process doesn't require physical contact between cells but depends on the recipient's genetic capacity for DNA uptake [48]. Over 80 bacterial species have been identified as naturally competent, though many potentially transformative species in environmental settings remain undiscovered [48].
Transduction: Mediated by bacteriophages that erroneously package host bacterial DNA into viral capsids during infection cycles. Generalized transduction randomly packages any bacterial DNA, while specialized transduction transfers genes adjacent to prophage integration sites [46] [48]. Lateral transduction can transfer extensive chromosomal regions and has been estimated that a single phage lysate can encode up to 20,000 copies of an entire bacterial chromosome in transduction particles [46].
Vesiduction: A recently discovered mechanism involving outer membrane vesicles (OMVs) - double-membrane spherical nanostructures (50-500 nm) generated during bacterial growth. These vesicles can protect DNA from degradation and facilitate rapid gene transfer within three hours of contact [48]. OMVs have been found to contain plasmids, chromosomal DNA fragments, and phage DNA fragments, though their exact mechanisms and influencing factors remain poorly understood [48].
Diagram 1: Mechanisms of Horizontal Gene Transfer. The diagram illustrates the four primary pathways through which mobile genetic elements facilitate the movement of DNA between bacterial cells: conjugation (direct cell contact), transformation (free DNA uptake), transduction (phage-mediated), and vesiduction (membrane vesicle transfer).
Ecological Drivers and MGE Interactions in Environmental Resistomes
The transfer and persistence of MGEs in environmental resistomes are influenced by complex ecological interactions between microbial communities, environmental factors, and the MGEs themselves.
Environmental Factors Influencing MGE Dynamics
Studies of urban rivers have demonstrated that seasonal variations significantly impact the composition, diversity, and abundance of ARGs and their associated MGEs [49]. Parameters such as dissolved oxygen, temperature, electrical conductivity, total organic carbon, and total phosphorus fluctuate seasonally and correlate with changes in resistome profiles [49]. In raw milk systems, Variance Partitioning Analysis revealed that ARG distribution was primarily driven by three factors: the combined effect of physicochemical properties and MGEs (33.5%), the interplay between physicochemical parameters and microbial communities (31.8%), and the independent contribution of physicochemical factors (20.7%) [29].
Inter-MGE Interactions and Networks
MGEs establish complex multi-layered ecological networks involving both conflicts and alliances. Phage satellites, such as P4-like elements in Escherichia coli and Phage-Inducible Chromosomal Islands (PICIs) in Firmicutes, parasitize helper phages by hijacking their viral particles for transfer [46]. Some phage-inducible chromosomal island-like elements (PLEs) in Vibrio spp. can completely abolish phage reproduction, while others like P4 have a more modest impact on phage fitness under certain conditions [46]. These satellites can themselves be mobilized by "parasites of parasites," creating intricate dependency networks [46].
Prophages interact not only with satellites but also with other MGEs, with conjugative elements sometimes encoding anti-phage defenses or being mobilized by phages [46]. Additionally, MGEs exchange genetic material with hosts and each other through transposable elements and recombination mechanisms, as demonstrated by the transfer of a carbapenem resistance gene from a conjugative plasmid to the Pseudomonas aeruginosa chromosome mediated by transposases [46].
Methodological Approaches for Studying MGEs and HGT
Advancements in detection technologies have enabled more precise characterization of MGEs and their association with ARGs in complex environmental matrices.
Examining Methods for HGT Studies
Table 2: Methodologies for Investigating Horizontal Gene Transfer
| Method Category | Specific Techniques | Obtainable Information | Sensitivity | Throughput | Key Limitations |
|---|---|---|---|---|---|
| Traditional Culture | Flask/well plate mating assays | Transfer frequency, donor/recipient efficiency | High (1 gene copy/10⁵-10⁷ genomes) | Low | Limited to cultivable bacteria, artificial conditions |
| Molecular Quantification | HT-qPCR (High-throughput qPCR) | Absolute/relative abundance of known ARGs/MGEs | High (1 gene copy/10⁵-10⁷ genomes) | Medium | Targeted approach, primer dependency |
| Sequence-Based Analysis | Metagenomics (short-read) | ARG/MGE diversity, correlation analysis | Low (1 gene copy/10³ genomes) | High | Limited to abundant genes, assembly challenges |
| Single-Cell Spatial Mapping | MGE-FISH with rRNA-FISH | Spatial distribution, physical host association | Variable (protocol-dependent) | Low | Technically challenging, low throughput |
| Long-Read Technologies | Nanopore, PacBio sequencing | Complete MGE structures, ARG context | Medium | Medium | Higher error rate, cost |
| Exogenous Capture | Plasmid capture, epicPCR | MGE-host associations, mobility potential | Low | Low | Nontrivial analyst training required |
Spatial Mapping of MGEs in Complex Communities
Single-molecule DNA fluorescence in situ hybridization (FISH) combined with multiplexed ribosomal RNA-FISH enables simultaneous visualization of MGEs and their bacterial hosts within structured microbial communities while preserving spatial context [50]. The optimized MGE-FISH protocol involves:
- Sample fixation and permeabilization to preserve spatial structure while allowing probe access
- DNA denaturation using heat treatment to expose target sequences
- Split hybridization chain reaction (HCR) with helper probes to enhance specificity and signal amplification
- Gel embedding and clearing to reduce autofluorescence in complex samples like biofilms
- Confocal microscopy with spectral detection for three-dimensional visualization in dense communities
- Semi-automated image analysis to detect MGE spots and segment bacterial cells [50]
This approach has revealed that AMR plasmids and prophages form distinct clusters (10-100 μm) within human oral biofilms, coinciding with densely packed regions of host bacteria, suggesting limited microscale regions of HGT or clonal expansion [50].
Diagram 2: Spatial Mapping Workflow for MGE-Host Associations. The experimental pipeline for single-molecule DNA FISH combined with multiplexed rRNA FISH enables visualization of mobile genetic elements and their bacterial hosts within complex structured microbiomes while preserving spatial context.
The Scientist's Toolkit: Essential Research Reagents and Materials
Table 3: Key Research Reagent Solutions for MGE Studies
| Reagent/Material | Primary Function | Application Examples | Technical Considerations |
|---|---|---|---|
| SmartChip Real-time PCR System | High-throughput quantification of ARGs/MGEs | Absolute quantification of 290+ ARG subtypes in environmental samples [25] | Requires specific primer validation; detection limit: Ct <31 |
| Split HCR Probes with Helper Oligos | Signal amplification for DNA-FISH | Enhancing specificity in MGE-FISH; reducing background in complex samples [50] | Stabilizes DNA secondary structure; improves target accessibility |
| Polyacrylamide Gel Embedding Matrix | Tissue clearing and autofluorescence reduction | Enabling MGE visualization in dense oral biofilms [50] | Covalently anchors nucleic acids while clearing proteins/lipids |
| CTAB-based DNA Extraction Kits | Nucleic acid isolation from complex matrices | Optimal for liquid substrates like raw milk; improves yield from Gram-positive bacteria [29] | Includes lysozyme and proteinase K treatment for complete lysis |
| Plasmid Capture Systems | Exogenous isolation of mobile elements | Investigating plasmid host range and transfer mechanisms [31] | Low throughput but provides functional mobility data |
| VITEK2 System with AST Cards | Automated antibiotic susceptibility testing | Phenotypic confirmation of resistance patterns in clinical isolates [47] | Standardized per CLSI guidelines; uses McFarland standard |
MGEs as Vectors for Antibiotic Resistance Dissemination
The role of MGEs in propagating antimicrobial resistance is evident across diverse environments, from clinical settings to agricultural and natural ecosystems.
MGE-Associated ARGs in Clinical and Environmental Settings
Comprehensive genomic analysis of clinical pathogens reveals extensive associations between ARGs and MGEs. In a global collection of clinical isolates, specific MGE types showed strong associations with particular resistance genes: insertion sequences (IS) with aminoglycoside resistance genes like aac(6')-Ie-aph(2'')-Ia; transposons (Tn) with tetracycline resistance genes like tet(K); and integrons with beta-lactam resistance genes like blaOXA-48 [43]. These associations facilitate the rapid dissemination of resistance across pathogen populations.
Environmental surveillance demonstrates similar patterns, with MGEs playing crucial roles in ARG persistence and transfer. In urban rivers, the abundance of ARGs showed strong correlations with mobile genetic elements across seasonal variations, with MGEs explaining a significant portion of ARG distribution patterns [49]. A comprehensive database of ARG occurrence in China from 2013-2020, encompassing 291,870 records from aquatic, edaphic, sedimentary, dusty, and atmospheric environments, confirmed the widespread co-occurrence of ARGs with MGEs across diverse habitats [25].
Risk Assessment Frameworks Incorporating MGE Mobility
Current approaches to environmental AMR risk assessment are evolving to incorporate MGE mobility as a key parameter. Zhang et al. proposed four indicators to rank ARG risk: circulation (sharing between One Health settings), mobility (association with MGEs), pathogenicity (presence in human/animal pathogens), and clinical relevance (association with treatment failure) [31]. However, this approach has limitations as it assesses risk based on historical worst-case genetic contexts rather than actual ARG mobility in surveyed samples [31].
Novel frameworks propose integrating ARG mobility directly into Quantitative Microbial Risk Assessment (QMRA), which includes hazard identification, exposure assessment, dose-response analysis, and risk characterization [31]. For environmental surveillance, prioritizing ARG-MGE associations may be more informative than ARG-host associations, as ARGs in environmental settings often persist across extended time frames and undergo multiple bacterial host transitions before reaching pathogenic hosts capable of infecting humans or animals [31].
Mobile Genetic Elements serve as fundamental drivers of horizontal gene transfer, playing indispensable roles in the dissemination of antibiotic resistance genes within environmental resistomes. Their diverse mechanisms—conjugation, transformation, transduction, and vesiduction—enable rapid adaptation and functional diversification of microbial communities across interconnected One Health compartments. Advanced methodological approaches, particularly spatial mapping technologies and high-throughput quantification methods, are revealing the complex ecological dynamics of MGE-mediated gene flow in structured environments. The integration of MGE mobility into risk assessment frameworks represents a critical advancement for accurately evaluating the public health threats posed by environmental antibiotic resistance. As research continues to unravel the intricate networks of conflict and alliance between MGEs and their hosts, targeted strategies for mitigating ARG dissemination will emerge, ultimately supporting efforts to preserve antibiotic efficacy and protect global health.
Artificial Intelligence and Machine Learning in ARG Discovery and Risk Prediction
Antibiotic resistance genes (ARGs) present a critical global health challenge, with drug-resistant infections causing an estimated 1.27 million deaths annually worldwide [51]. The environmental resistome—the comprehensive collection of ARGs in environmental settings—serves as a significant reservoir for these genes, facilitating their transfer to pathogenic bacteria through horizontal gene transfer (HGT) [52]. Aquatic environments, soils, and wastewater treatment plants function as key conduits where anthropogenic inputs interact with resident microbes, creating a feedback loop that ultimately affects human health through drinking water, recreational water, and food sources [53]. The One Health framework emphasizes the interconnectedness of human, animal, and environmental health in understanding and mitigating antibiotic resistance [52].
Traditional, culture-based methods for detecting antimicrobial resistance (AMR) provide limited representation of the full resistome, while molecular techniques like quantitative polymerase chain reaction (qPCR) require prior selection of targets and may overlook novel ARGs [53]. Shotgun metagenomic sequencing has emerged as a powerful tool that can reveal the broad spectrum of ARGs present in clinical and environmental samples without prior target selection [54] [53]. However, the analysis of metagenomic data presents substantial challenges due to its vastness and complexity, creating an pressing need for advanced computational approaches [55]. Artificial intelligence (AI) and machine learning (ML) now provide efficient and accurate tools to autonomously process and analyze these high-throughput datasets, offering transformative potential for ARG discovery, risk prediction, and the development of effective management strategies [55] [52].
Machine Learning Approaches for ARG Discovery
Beyond Homology-Based Detection
Traditional bioinformatic tools for ARG annotation in metagenomic datasets primarily rely on sequence similarity to predefined gene databases, limiting their discovery potential to current, incomplete ARG knowledge bases [56]. Machine learning models overcome this limitation by predicting new ARGs with no sequence similarity to known resistance genes or any annotated gene, significantly expanding our capacity to identify novel resistance determinants [56].
The DRAMMA (Deep Reasoning and Meta-learning for Microbial Antimicrobial resistance) algorithm exemplifies this advanced approach. DRAMMA utilizes a Random Forest model trained on global-scale metagenomic data with 512 tailored features encompassing protein biochemical properties, genomic context, and evolutionary patterns [56]. This model demonstrated robust predictive performance both in cross-validation and on an external validation set annotated by an empirical ARG database, successfully identifying novel ARG candidates significantly enriched within the Bacteroidetes/Chlorobi and Betaproteobacteria taxonomic groups [56].
Feature Engineering for ARG Prediction
ML models for ARG discovery incorporate diverse biological features that extend beyond simple sequence alignment:
- Amino acid properties: Including gene and contig length, physical and chemical attributes of the protein, amino acid composition, and averages of amino acid indices representing various physicochemical and biochemical characteristics [56]
- Amino acid patterns: Incorporating 8-mers of hydrophilic/hydrophobic residues, Helix Turn Helix (HTH) domains, DNA binding domains, and transmembrane domains [56]
- Horizontal gene transfer signals: Utilizing GC content differences between the gene and its contig, distance between DNA k-mer distribution vectors, and distribution of genes across diverse taxonomic groups [56]
- Genomic context: Analyzing the presence of known ARGs and mobile genetic elements in the genomic region surrounding the target gene [56]
The following Dot script illustrates the DRAMMA feature extraction workflow:
Figure 1: DRAMMA Feature Extraction and Prediction Workflow
Ensemble Methods for Discriminatory ARG Identification
The Extremely Randomized Tree (ERT) algorithm represents another powerful ML approach for identifying discriminatory ARGs among environmental resistomes. This ensemble method uses a similar approach to random forests but with two key distinctions: it employs full datasets to grow decision trees rather than bagging features, and node splits are chosen randomly rather than selecting optimal splits within random subsets [53].
The ERT algorithm has demonstrated particular effectiveness in:
- Handling highly correlated variables common in genomic data
- Managing complex multi-dimensional metagenomic datasets
- Identifying characteristic ARG occurrence patterns specific to different environments
- Ranking features by variable importance measures to improve differentiation between sample classes [53]
When combined with Bayesian optimization techniques for parameter tuning, ERT can effectively identify discriminatory ARGs that differentiate various aquatic habitats (e.g., rivers, wastewater influent, hospital effluent, and dairy farm effluent) based on their resistome profiles [53].
ML Applications in Environmental ARG Risk Prediction
Predicting ARG Abundance in Engineered Ecosystems
Machine learning algorithms have demonstrated significant potential for predicting the changes in abundance of ARGs and mobile genetic elements (MGEs) in engineered environmental systems such as anaerobic digestion (AD) processes. Comparative studies have evaluated multiple ML regression algorithms, including Random Forest (RF), eXtreme Gradient Boosting (XGBoost), and Artificial Neural Networks (ANN) for predicting ARG/MGE abundances based on operational parameters [57].
Table 1: Performance Comparison of ML Algorithms for Predicting ARG Abundance in Anaerobic Digestion
| Machine Learning Algorithm | Prediction Accuracy (R²) Training | Prediction Accuracy (R²) Validation | Key Advantage | Limitation |
|---|---|---|---|---|
| Artificial Neural Network (ANN) | >80% | >75% | Superior prediction accuracy for ARG abundance | Requires larger datasets for optimal performance |
| Random Forest (RF) | >80% | ~70% | Handles non-linear relationships well | Lower accuracy for MGE prediction |
| eXtreme Gradient Boosting (XGBoost) | >80% | ~70% | Effective with heterogeneous features | Sensitive to parameter tuning |
Feature importance analysis from these models reveals that digester temperature represents the most critical operational parameter influencing ARG abundance, followed by solid retention time and additive presence [57]. This information provides valuable insights for optimizing process parameters to minimize ARG transmission risks during land application of digestate.
Ecological Process Determination and Risk Characterization
ML approaches integrate with null-model-based statistical frameworks to quantify the ecological processes controlling ARG profiles in environmental samples. Research on urban lake sediments in China has demonstrated that stochastic processes frequently contribute more significantly to ARG community assembly than deterministic processes, particularly in polluted environments [58].
The novel null-model-based stochasticity ratio approach applied in these studies revealed:
- Homogenizing dispersal dominated in Lake Baiyang (40%), followed by homogeneous selection (32%) and ecological drift (15%)
- Ecological drift (33%) and homogenizing dispersal (31%) were the dominant processes in Lake Tai
- Human sewage-associated sources represented the largest contributor (~62%) of ARGs in these environments [58]
Metagenomic assembly and binning approaches have tracked numerous potential pathogenic antibiotic-resistant bacteria, identifying co-occurrence of ARGs, mobile genetic elements, and human bacterial pathogens in approximately 50% of sediment samples, indicating substantial resistome risk [58].
Source Tracking and Forensic Applications
Machine learning algorithms enable sophisticated source tracking of ARGs in environmental samples, with significant implications for forensic microbiology. By combining classification and regression models with microbial succession patterns, ML approaches can accurately predict contamination sources and temporal patterns [55].
Random Forest regression models based on 18 important bacterial genera have demonstrated excellent predictive performance for postmortem interval estimation with a mean absolute error of 1.27 ± 0.18 days within a 36-day decomposition process [55]. Double-layer models that first discriminate between time groups using Random Forest, Support Vector Machine, Multi-layer Perceptron, and Logistic Regression methods, followed by RF regression for precise prediction, further enhance temporal forecasting capabilities [55].
Experimental Protocols and Methodologies
Metagenomic Sequencing Workflow for ARG Detection
Comprehensive ARG detection in environmental samples relies on a standardized metagenomic sequencing workflow:
Table 2: Metagenomic Sequencing Workflow for Environmental ARG Detection
| Step | Procedure | Key Considerations | Quality Control |
|---|---|---|---|
| Sample Collection | Collect environmental samples (water, sediment, soil) in sterile containers | Immediate preservation at -80°C or using DNA stabilization solutions | Document sampling location, time, and environmental parameters |
| DNA Extraction | Use commercial kits optimized for environmental samples | Maximize DNA yield and purity; minimize inhibitors | Quantify DNA using fluorometric methods; assess purity via A260/A280 ratio |
| Library Preparation | Fragment DNA, repair ends, add adapters, and amplify | Input DNA quantity: 1-1000ng; fragment size: 200-500bp | Validate library size distribution using bioanalyzer |
| Sequencing | Perform shotgun metagenomic sequencing on Illumina, Oxford Nanopore, or PacBio platforms | Minimum 10 million reads per sample for adequate coverage | Assess sequencing quality scores (Q30 > 80%) |
| Bioinformatics Analysis | Quality filtering, assembly, gene prediction, ARG annotation | Customize parameters based on sequencing technology | Remove host DNA if applicable; check for contamination |
Next-generation sequencing (NGS) technologies, particularly shotgun metagenomic sequencing, enable comprehensive profiling of resistomes without prior target selection [54] [59]. Compared to first-generation Sanger sequencing, NGS offers dramatically higher throughput, reduced costs, and the ability to detect low-abundance ARGs [54].
Data Processing and ARG Annotation Pipeline
Raw sequencing data undergoes extensive bioinformatic processing before ARG annotation:
Quality Control and Preprocessing
- Trim adapters and low-quality bases using Trimmomatic or Cutadapt
- Remove host DNA sequences using reference-based alignment
- Assess read quality using FastQC
Assembly and Gene Prediction
- Perform de novo assembly using metaSPAdes or MEGAHIT
- Predict open reading frames using Prodigal or MetaGeneMark
- Cluster predicted proteins at 90% identity using CD-HIT
ARG Annotation and Quantification
- Annotate ARGs using database-based tools (CARD, ResFinder, MEGARES)
- Apply ML-based tools (DRAMMA, HMD-ARG, PLM-ARG) for novel ARG discovery
- Normalize ARG abundance by reads per kilobase per million (RPKM)
The following Dot script illustrates the comprehensive experimental workflow for ML-based ARG discovery:
Figure 2: Comprehensive Workflow for ML-Based ARG Discovery from Environmental Samples
Table 3: Essential Research Reagents and Computational Tools for ML-Based ARG Research
| Category | Tool/Reagent | Specific Function | Application in ARG Research |
|---|---|---|---|
| Wet Lab Reagents | DNeasy PowerSoil Pro Kit | Environmental DNA extraction | Optimal recovery of microbial DNA from complex matrices |
| Illumina DNA Prep Kit | Library preparation for NGS | Fragmentation, adapter ligation, and amplification of DNA | |
| Qubit dsDNA HS Assay Kit | Accurate DNA quantification | Precise measurement of low-concentration DNA samples | |
| Sequencing Platforms | Illumina NovaSeq Series | High-throughput sequencing | Massively parallel sequencing for deep metagenomic coverage |
| Oxford Nanopore MinION | Real-time long-read sequencing | Detection of structural variants and complete ARG contexts | |
| Bioinformatics Tools | Trimmomatic | Read quality control | Removal of adapter sequences and low-quality bases |
| metaSPAdes | Metagenomic assembly | De novo assembly of complex microbial communities | |
| Prodigal | Gene prediction | Identification of protein-coding sequences in metagenomes | |
| ARG Databases | CARD (Comprehensive Antibiotic Resistance Database) | Reference ARG database | Homology-based ARG annotation and classification |
| ResFinder | Detection of acquired ARGs | Identification of horizontally transferred resistance genes | |
| ML Algorithms | DRAMMA | Novel ARG prediction | Random Forest-based discovery of non-homologous ARGs |
| Extremely Randomized Trees (ERT) | Discriminatory ARG identification | Feature ranking and identification of environment-specific ARGs | |
| Random Forest Regression | ARG abundance prediction | Modeling relationships between operational parameters and ARG levels |
Future Perspectives and Challenges
Despite significant advances in AI and ML applications for ARG discovery, several challenges remain for the widespread adoption of these technologies in front-line public health settings. Current limitations include:
- Data quality and standardization: Inconsistent metadata annotation and sequencing protocols across studies complicate model generalization [51]
- Interpretability and explainability: The "black box" nature of complex ML models requires development of explainable AI approaches to build trust among end-users [51]
- Computational resource requirements: Large-scale metagenomic analysis demands significant computational infrastructure, limiting accessibility for some research groups [56]
- Rapidly evolving resistance mechanisms: ML models require continuous retraining as new resistance variants emerge in clinical and environmental settings [52]
Future developments will likely focus on multi-optic integration (combining genomics, transcriptomics, and proteomics data), transfer learning approaches to adapt models across different environments, and real-time surveillance systems for early warning of emerging resistance threats [55] [52]. As ML methodologies continue to evolve, they hold immense promise for transforming how we monitor, predict, and mitigate the global spread of antibiotic resistance through environmental pathways.
The integration of AI and ML into environmental resistome research represents a paradigm shift from reactive to proactive resistance management, potentially enabling early detection of emerging threats before they reach clinical settings. By bridging ecological microbiology, molecular biology, and computational science, these approaches offer a comprehensive framework for addressing one of the most pressing public health challenges of our time [52].
The global rise of antimicrobial resistance (AMR) represents one of the most severe threats to modern public health, with drug-resistant infections already responsible for millions of deaths annually [60]. Central to this crisis is the environmental antibiotic resistome—the comprehensive collection of all antibiotic resistance genes (ARGs) and their precursors in both environmental and pathogenic bacteria [58]. Understanding the prevalence, flow, and specific health risks of ARGs across environments is paramount for developing effective mitigation strategies. This guide provides researchers and drug development professionals with advanced technical methodologies for tracking the sources of ARGs and quantitatively assessing their risk to human health, framing these techniques within the broader context of environmental resistome research. The interconnectedness of human, animal, and environmental health—the One Health paradigm—is critical, as ARGs can transfer from environmental bacteria to human pathogens via mobile genetic elements (MGEs), confounding clinical treatments [61] [60]. A quantitative, risk-based framework is essential to prioritize the most dangerous ARGs and identify their primary environmental reservoirs.
Methodological Approaches for Source Tracking
Source tracking aims to identify the origins of ARGs and trace their movement from environmental reservoirs to human pathogens. This requires a combination of metagenomic sequencing, sophisticated bioinformatics, and statistical models.
Metagenomic Sequencing and Assembly
The foundation of modern source tracking is shotgun metagenomics, which allows for the untargeted sequencing of all genetic material in a sample. The general workflow begins with high-throughput DNA extraction from diverse matrices (water, sediment, soil, feces). Following sequencing, quality-filtered reads are assembled into longer contiguous sequences (contigs). For more accurate gene identification and host assignment, it is recommended to perform metagenomic assembly rather than relying solely on short reads [42]. Advanced pipelines like ARGem facilitate this process, providing integrated workflows from raw reads to annotated ARGs and MGEs [42]. A key subsequent step is metagenomic binning, which groups contigs into Metagenome-Assembled Genomes (MAGs). This allows for the linkage of ARGs to specific bacterial hosts and the identification of Pathogenic Antibiotic-Resistant Bacteria (PARB) [58]. Strict quality control is imperative; one effective method is to only consider ARGs located on contigs longer than 10 kb where the taxonomic affiliation of all genes on the contig agrees with the overall MAG taxonomy [62].
Bioinformatics and Annotation
Assembled contigs and/or unassembled reads are annotated against curated ARG databases. To ensure high-confidence identifications, it is recommended to use multiple databases such as the Comprehensive Antibiotic Research Database (CARD), ARG-ANNOT, and RESFAMS [63]. Conservative BLAST parameters (e.g., e-value ≤ 10-5, amino acid identity ≥ 90%, bit-score ≥ 70) should be applied to minimize false positives [63]. Concurrently, sequences must be annotated for Mobile Genetic Elements (MGEs)—including plasmids, integrons, and transposons—and Virulence Factor (VF) genes to assess the mobility potential and pathogenicity of the hosting bacteria [58] [60]. The co-localization of ARGs, MGEs, and VF genes on the same contig is a strong indicator of a high-risk genetic element with significant potential for horizontal transfer into pathogens.
Microbial Source Tracking and Statistical Models
Microbial Source Tracking (MST) models use Bayesian algorithms to apportion the origins of ARGs detected in a given environment. A prominent tool, SourceTracker, can quantify the proportion of ARGs in an environmental sample (e.g., a lake sediment) that originates from various source categories, such as human sewage, agricultural runoff, or wildlife [58]. Studies have shown that human sewage-associated sources can be the dominant contributor (>60%) of ARGs in impacted aquatic environments [58]. Furthermore, network co-occurrence analysis can reveal statistically significant associations between specific ARGs, bacterial taxa, and MGEs, helping to identify key vectors for resistance dissemination [42].
Table 1: Key Bioinformatic Tools and Databases for ARG Source Tracking
| Tool/Database | Type | Primary Function | Application in Source Tracking |
|---|---|---|---|
| ARGem Pipeline [42] | Bioinformatics Pipeline | End-to-end analysis of metagenomic data for ARGs. | Integrates assembly, annotation, statistical analysis, and visualization; includes co-occurrence networks. |
| CARD [62] [63] | ARG Database | Curated repository of ARGs and their ontology. | Reference database for annotating and characterizing identified resistance genes. |
| SourceTracker [58] | Statistical Model | Bayesian approach to source apportionment. | Quantifies the contribution of known sources (e.g., sewage) to the ARG profile of a sink sample. |
| MetaPhlAn [60] | Taxonomic Profiler | Identifies microbial taxa from metagenomic data. | Profiles the bacterial community to identify potential hosts of ARGs. |
Quantitative Framework for Risk Assessment
Not all environmentally detected ARGs pose an equal threat to human health. A robust, multi-factor risk assessment framework is necessary to identify ARGs that are most likely to compromise clinical treatment. A leading approach integrates four key indicators [62].
Human Accessibility
This indicator measures the likelihood that an ARG will be found in the human microbiome, representing the first barrier to clinical relevance. It is calculated based on the abundance and prevalence of an ARG in metagenomes from human body sites (e.g., gut, skin, oral cavity). Of 2,561 ARGs identified across global habitats, only 1,714 (67%) were detected in human-associated samples, with most showing low abundance and prevalence [62]. Genes like tetQ (conferring tetracycline resistance) demonstrate high human accessibility [62].
Mobility
The mobility of an ARG is its potential for Horizontal Gene Transfer (HGT). This is assessed by the co-occurrence of ARGs with MGEs, such as plasmids, integrons, and transposons. The presence of an ARG on a contig with an MGE, or a strong statistical correlation with MGE abundance, signifies high mobility and a greater risk of transfer to pathogens [58] [61].
Human Pathogenicity
This factor evaluates whether an ARG is hosted by a human pathogen. By analyzing MAGs, researchers can determine if an ARG is located within a known pathogenic bacterial genome. The presence of ARGs in pathogens like Escherichia coli, Klebsiella pneumoniae, or Staphylococcus aureus dramatically increases the associated health risk [62].
Clinical Availability
Clinical availability accounts for the current use of the antibiotic to which the ARG confers resistance. ARGs that confer resistance to last-resort or widely used antibiotics (e.g., carbapenems, third-generation cephalosporins, fluoroquinolones) pose a higher health risk than those for which the antibiotic is rarely deployed in modern medicine [62].
Integration into a Risk Score
These four indicators can be integrated into a quantitative health risk score for each ARG. An analysis of 2,561 environmental ARGs found that only 23.78% were classified as posing a health risk, with multidrug resistance genes being disproportionately represented among high-risk ARGs [62]. This demonstrates the utility of a quantitative framework in focusing management and research efforts on the most threatening resistance genes.
Table 2: Quantitative Health Risk Indicators for Antibiotic Resistance Genes (ARGs)
| Risk Indicator | Definition | Measurement Approach | High-Risk Example |
|---|---|---|---|
| Human Accessibility | Potential for ARG to be present in the human microbiota. | Abundance & prevalence in human microbiome metagenomes (e.g., HMP data [63]). | tetQ gene, found in the human gut with high abundance and prevalence [62]. |
| Mobility | Potential for horizontal gene transfer to other bacteria. | Co-localization with or proximity to MGEs (plasmids, integrons, transposons) on contigs. | ARGs found on contigs containing integron-integrase genes or plasmid replication genes [58] [61]. |
| Human Pathogenicity | Association of the ARG with a human bacterial pathogen. | Identification of ARG within a Metagenome-Assembled Genome (MAG) of a pathogenic species. | blaKPC gene hosted in a Klebsiella pneumoniae MAG [62]. |
| Clinical Availability | Relevance of the antibiotic to modern clinical practice. | Correlation with a drug class that is widely used or is a last-resort treatment. | Genes conferring resistance to carbapenems or fluoroquinolones [62]. |
Visualization of Workflows and Pathways
The following diagrams illustrate the core technical workflows and logical relationships described in this guide.
Integrated ARG Source Tracking and Risk Assessment Workflow
Environmental Cycle and Horizontal Gene Transfer of ARGs
The Researcher's Toolkit: Essential Reagents and Materials
Successful implementation of the described protocols requires a suite of specialized reagents and computational resources.
Table 3: Essential Research Reagents and Solutions for ARG Studies
| Reagent / Material | Function / Application | Example Product / Specification |
|---|---|---|
| PowerSoil DNA Isolation Kit | High-yield DNA extraction from complex environmental matrices like soil, sediment, and sludge. | MO BIO Laboratories Inc. [60] |
| QIAamp Fast DNA Stool Mini Kit | Optimized DNA extraction from human and animal fecal samples. | Qiagen [60] |
| RNAlater Stabilization Solution | Preserves RNA and DNA integrity in biological samples immediately upon collection. | Thermo Fisher Scientific [60] |
| Illumina DNA Prep Kits | Library preparation for shotgun metagenomic sequencing on Illumina platforms. | Illumina MiSeq Nextera XT DNA Library Prep Kit [60] |
| CARD & ARG-ANNOT Databases | Curated reference databases for high-confidence annotation of ARGs from sequence data. | Comprehensive Antibiotic Research Database [62] [63] |
| ARGem Pipeline | Integrated bioinformatics workflow for ARG analysis from raw reads to visualization. | Freely available on GitHub [42] |
| MetaPhlAn | Profiling microbial community composition from metagenomic shotgun sequencing data. | Version 3.0+ [60] |
The interconnected challenges of environmental antibiotic resistance demand sophisticated tools for source tracking and risk assessment. By employing the integrated methodologies outlined in this guide—ranging from advanced metagenomics and bioinformatics to quantitative risk scoring—researchers can move beyond mere detection of ARGs towards a nuanced understanding of their origins, pathways, and ultimate threat to public health. This evidence-based, risk-prioritized approach is fundamental for informing interventions, guiding antibiotic development, and crafting policy within the essential framework of the One Health initiative.
Overcoming Technical Challenges in Resistome Characterization
The accurate characterization of environmental antibiotic resistance genes (ARGs) is fundamental to the "One Health" approach against antimicrobial resistance. However, research in low-biomass environments—such as air, drinking water, and oligotrophic aquatic systems—presents unique methodological challenges. Standard molecular techniques often fail to provide reliable data due to limited DNA yield, potential contamination, and biases in molecular processing. These limitations directly impact our understanding of the prevalence and risk of environmental resistomes, as low-biomass niches can still serve as significant reservoirs and pathways for ARG dissemination [64] [21]. This guide details advanced techniques for overcoming these hurdles, enabling robust surveillance of ARGs in these critical environmental compartments.
Core Challenge: Biases in Low-Biomass Analysis and the Need for Quantification
In low-biomass samples, standard next-generation sequencing (NGS) data, which provides only relative abundance, is particularly misleading. An increase in the relative abundance of one microbial taxon or ARG does not necessarily indicate its actual proliferation but may instead reflect the decrease of others. This compositional nature of sequencing data can lead to severe misinterpretations of the environmental resistome dynamics [65].
Furthermore, the standard practice of rarefying sequences to the lowest sampling depth discards a significant amount of data, which is especially detrimental when the total number of sequences is already low. Therefore, moving from relative to absolute abundance is a critical paradigm shift for low-biomass research, as it is essential for performing accurate Quantitative Microbial Risk Assessments (QMRA) [65].
Advanced Strategy I: Quantitative Microbiome and Resistome Profiling
Integrated Workflow for Absolute Quantification
To overcome the limitations of relative abundance data, Quantitative Microbiome Profiling (QMP) and absolute resistome profiling should be employed. This integrated method combines different molecular and bioinformatic techniques to quantify the absolute number of bacterial cells and gene copies in a sample [65].
The following workflow illustrates the parallel processes for obtaining absolute abundances of both microbial taxa and resistance genes:
Key Experimental Protocols
A. Sample Collection and DNA Extraction
- Air Samples: Particulate matter (PM~2.5~ and PM~10~) should be collected using portable samplers with fractionating inlets, enriching microbes onto quartz microfiber filters. Dust samples from indoor/outdoor settings are collected using a sterile brush [25].
- Water Samples: Aseptically collect water from below the surface using sterilized containers. Filter a known volume (e.g., 80-250 mL for river water) onto 0.22 μm cellulose-nitrate filters to capture biomass [25] [65].
- DNA Extraction: Use commercial kits (e.g., FastDNA SPIN kit for soil). Include inhibition controls during qPCR. DNA quality and quantity should be measured via NanoDrop and fluorescent assays (e.g., Qubit dsDNA HS assay) [65].
B. 16S rRNA qPCR for Cell Concentration
- Primers: 1055f-1392r [65].
- Reaction: Perform in triplicate with SsoAdvanced Universal SYBR Green Supermix.
- Thermocycle: (i) 2 min at 98°C; 40 cycles of (ii) 5 s at 98°C, and (iii) 5 s at 60°C.
- Standard Curve: Construct using plasmid clones of the target sequence (10^2^ to 10^8^ copies).
- Calculation: Estimate cell concentration by dividing the measured 16S rRNA concentration by 4.1 (the estimated average 16S rRNA gene copy number per bacterium) [65].
C. High-Throughput qPCR (HT-qPCR) for Absolute Resistome
- Technology: Utilize systems like the SmartChip Real-Time PCR.
- Targets: A broad panel of primer sets (e.g., 296 for 283 ARGs and 12 Mobile Genetic Elements (MGEs)).
- Quality Control: Amplification efficiency must be 90%-110%; only genes positive in all technical replicates are confirmed.
- Calculation: Absolute ARG copy number = Relative ARG copy number × 16S rRNA concentration [25] [65].
D. Bioinformatics and Diversity Analysis
- From Relative to Absolute (QMP): Rarefy sequencing data to the lowest sampling depth (defined as sequencing depth divided by cell counts). Then, multiply the rarefied taxon abundance by the estimated cell counts to obtain absolute abundances [65].
- Hill Numbers: Use this unified framework for diversity analysis. Hill numbers (^q^D) are more intuitive than traditional indices, where the parameter
qreflects sensitivity to species abundance (q=0: species richness; q=1: Shannon exponent; q=2: Simpson reciprocal) [65].
Table 1: Key Quantitative Reagents and Their Functions
| Research Reagent / Tool | Primary Function in Low-Biomass Analysis |
|---|---|
| SmartChip Real-Time PCR | High-throughput qPCR platform for simultaneously quantifying hundreds of ARGs and MGEs from minimal sample input [25] [65]. |
| 16S rRNA qPCR Assay | Estimates total bacterial cell concentration from environmental samples, serving as the cornerstone for converting relative data to absolute abundances [65]. |
| Hill Numbers Framework | A unified set of diversity indices that provides an unambiguous and scalable measure of community diversity for robust cross-study comparisons [65]. |
| MobileOG-db Database | Protein database used to identify and characterize Mobile Genetic Elements (MGEs) from sequencing reads, crucial for assessing ARG horizontal transfer potential [37]. |
Advanced Strategy II: Leveraging Long-Read Sequencing for Resistome Risk Assessment
Overcoming Short-Read Limitations in Low-Biomass Contexts
Short-read sequencing often produces fragmented assemblies, making it challenging to determine if an ARG is located on a mobile genetic element (MGE) or within a pathogenic host—a key factor for risk assessment. Long-read sequencing (Nanopore, PacBio) solves this by providing long contiguous sequences, enabling more accurate linkage of ARGs to their genetic context, even in complex low-biomass samples [37].
The L-ARRAP Pipeline for Risk Quantification
The Long-read based Antibiotic Resistome Risk Assessment Pipeline (L-ARRAP) is specifically designed to quantify resistome risk from long-read metagenomic data.
Workflow Overview:
- Quality Control: Use tools like Chopper to filter reads (e.g., length > 500 bp, quality Q > 10).
- ARG/MGE Identification: Align reads to the SARG database (for ARGs) and MobileOG-db (for MGEs) using Minimap2 and LAST, respectively. Apply cut-offs of >75% identity and >90% coverage.
- Pathogen Identification: Annotate taxonomy using Centrifuge and identify reads belonging to Human Bacterial Pathogens (HBPs) from a curated database (WHO priority list & ESKAPE pathogens).
- Risk Index Calculation: The pipeline calculates the Long-read based Antibiotic Resistome Risk Index (L-ARRI), which integrates ARG abundance, their mobility potential (linkage to MGEs), and their association with pathogenic hosts [37].
Comparative Analysis of Techniques and Data Presentation
Presenting quantitative data clearly is vital for interpreting low-biomass resistome studies. The following table summarizes the detection capabilities of a large-scale HT-qPCR platform.
Table 2: Quantitative Profile of ARGs and MGEs Detectable via HT-qPCR. Data sourced from a database of 1,403 environmental samples [25].
| Gene Category | Number of Target Subtypes | Major Antibiotic Classes or Functions Covered | Average Detection Rate Across Habitats |
|---|---|---|---|
| Antibiotic Resistance Genes (ARGs) | 290 | Aminoglycoside, Beta-lactam, MLSB, Tetracycline, Multidrug, etc. | 198 subtypes per sample (on average) |
| Mobile Genetic Elements (MGEs) | 30 | Transposases (16), Plasmids (6), Insertion Sequences (5), Integrases (3) | Varies significantly by habitat (e.g., highest in dust) |
Furthermore, different environmental habitats present unique challenges and detection patterns. The next table contrasts two distinct environments studied in low-ARG-biomass contexts.
Table 3: Methodological Considerations for Structured vs. Dynamic Low-Biomass Habitats
| Parameter | Structured, Stable Habitat (e.g., Forest Soil) | Dynamic Habitat (e.g., Riverbed Sediments/Biofilms) |
|---|---|---|
| Typical Alpha-Diversity (Pielou Evenness) | High (0.95 ± 0.02) [21] | Lower (0.89 ± 0.08) [21] |
| Correlation between Diversity & ARG Abundance | Strong negative correlation; high diversity acts as a barrier to ARG establishment [21] | No significant correlation observed [21] |
| Key Methodological Insight | QMP is crucial to avoid bias from high, stable background diversity. | Focus on absolute quantification is key due to fluctuating community structure. |
| Recommended Primary Technique | QMP combined with Hill number diversity analysis. | L-ARRAP pipeline to track ARG mobility in dynamic communities. |
Accurately profiling the environmental resistome in low-biomass air and water samples demands a move beyond standard relative abundance measurements. The advanced techniques outlined in this guide—Quantitative Microbiome Profiling (QMP) for absolute quantification of taxa and genes, and long-read sequencing coupled with the L-ARRAP risk pipeline for contextual risk assessment—provide a powerful, integrated framework. By adopting these methods, researchers can generate robust, quantifiable data that is critical for understanding the true prevalence and health risk of antibiotic resistance in these critical environmental compartments, thereby informing effective public health actions within the "One Health" paradigm.
The environmental resistome, comprising all antibiotic resistance genes (ARGs) in a given environment, represents a significant reservoir for the emergence and dissemination of antimicrobial resistance. Accurately characterizing this resistome, particularly the mobility potential of ARGs, is essential for risk assessment and intervention strategies. This technical guide examines co-assembly as a powerful metagenomic strategy to overcome critical limitations in environmental resistome research. We demonstrate how co-assembly of multiple samples significantly enhances contig length and improves gene prediction compared to individual assembly methods, enabling more reliable identification of ARG hosts and their association with mobile genetic elements. Through quantitative comparisons, detailed methodologies, and practical implementation frameworks, this whitepaper provides researchers with the tools to advance assembly-based analysis in environmental ARG monitoring.
Antibiotic resistance poses a severe global health threat, with environmental reservoirs serving as crucial hubs for the evolution and dissemination of resistance determinants. The resistome—the collection of all ARGs in a given environment—extends across diverse habitats including wastewater, soil, rivers, and even the atmosphere [40]. A key challenge in environmental resistome research involves not only identifying ARGs but also determining their genomic context—specifically, whether they are located on mobile genetic elements (MGEs) like plasmids, transposons, and integrons that can facilitate transfer to pathogens [4].
Metagenomic sequencing has emerged as a powerful tool for comprehensive resistome characterization, yet short read lengths (typically 100-150 bp) present significant limitations for contextual analysis. Conventional assembly of these short reads often results in fragmented contigs that break around conserved regions such as ARGs and MGEs, obscuring their genetic associations [66]. This fragmentation impedes critical assessments of ARG mobility potential and host identification, which are essential for evaluating health risks and developing targeted interventions.
Co-assembly strategies, which pool and jointly assemble sequencing reads from multiple related samples, offer a promising solution to these challenges. By effectively increasing sequencing depth and coverage, co-assembly can produce longer, more complete contigs that preserve the linkage between ARGs and their genomic surroundings [67]. This technical guide explores the principles, implementation, and benefits of co-assembly for enhancing contig length and gene prediction in environmental resistome research, with particular emphasis on applications to ARG studies.
Co-assembly Versus Individual Assembly: A Quantitative Comparison
Assembly Quality Metrics
Comparative studies demonstrate that co-assembly consistently outperforms individual assembly across multiple quality metrics. In an analysis of 45 air samples grouped into six subgroups based on taxonomic and functional characteristics, co-assembly achieved superior results compared to individual assembly approaches [67].
Table 1: Comparative Performance of Co-assembly vs. Individual Assembly
| Quality Metric | Co-assembly | Individual Assembly | Improvement |
|---|---|---|---|
| Genome Fraction (%) | 4.94 ± 2.64 | 4.83 ± 2.71 | +2.3% |
| Duplication Ratio | 1.09 ± 0.06 | 1.23 ± 0.20 | -11.4% |
| Mismatches per 100 kbp | 4379.82 ± 339.23 | 4491.1 ± 344.46 | -2.5% |
| Number of Misassemblies | 277.67 ± 107.15 | 410.67 ± 257.66 | -32.4% |
The enhanced performance of co-assembly was statistically significant, with paired one-sided Wilcoxon signed-rank tests showing a large effect size (r ≥ 0.5) for reduction in both duplication ratio and misassemblies [67]. These improvements directly contribute to more accurate ARG detection and contextualization.
Contig Length and Gene Recovery
Perhaps the most significant advantage of co-assembly for resistome research is its ability to produce longer contigs, which are essential for determining ARG context and mobility potential.
Table 2: Contig Output Comparison (≥500 bp threshold)
| Output Metric | Co-assembly | Individual Assembly | Improvement |
|---|---|---|---|
| Number of Contigs | 762,369 | 455,333 | +67.4% |
| Total Contig Length | 555.79 million bp | 334.31 million bp | +66.2% |
Statistical analysis confirmed that co-assembly yielded significantly more contigs and greater total contig length than individual assembly (paired one-sided Wilcoxon signed-rank test, p < 0.05), with a large effect size (r ≥ 0.5) [67]. These longer contigs facilitate more reliable gene prediction and enable researchers to determine whether ARGs are located near MGEs—a key factor in assessing transmission risk.
The Co-assembly Workflow: Methodological Framework
Experimental Design and Sample Grouping
Effective co-assembly begins with strategic sample grouping. Samples should be grouped based on shared taxonomic and functional characteristics to maximize the benefits of pooling while maintaining biological relevance. In airborne resistome research, samples have been successfully grouped by:
- Environmental Conditions: Dust storm events versus clear weather periods [67]
- Geographical Origin: Air mass back-trajectory analysis [67]
- Taxonomic Profiles: Similar microbial community composition [49]
- Functional Potential: Shared metabolic capabilities or resistance profiles
Grouping strategies should balance sample similarity with the need for sufficient sequencing depth. Overly heterogeneous groups may introduce assembly challenges, while overly homogeneous groups may limit the power of co-assembly.
Computational Implementation
The co-assembly process involves pooling quality-controlled reads from multiple samples and processing them through specialized metagenomic assemblers:
- Read Pooling: Combine filtered reads from all samples within a group
- Assembly Execution: Process pooled reads using metagenome-optimized assemblers such as metaSPAdes, MEGAHIT, or Opera-MS [68] [42]
- Quality Assessment: Evaluate assembly quality using metrics in Table 1
- Contig Processing: Filter contigs by length and completeness
Different assemblers show varying performance for resistome characterization. Studies indicate that metaSPAdes and the transcriptomic assembler Trinity may outperform other tools in reconstructing longer contigs around ARGs, though performance depends on sample complexity and sequencing depth [66].
Impact of Sequencing Depth on Co-assembly Performance
Sequencing depth significantly influences co-assembly outcomes. Research shows that pooling air samples, each initially sequenced at an average depth of 4.29 ± 1.45 million paired-end reads after quality control, improves assembly metrics and increases genome fraction [67].
The relationship between sequencing depth and assembly quality follows complex trajectories. While genome fraction increases with sequencing depth, other metrics like duplication ratio and misassembled contig length initially increase but plateau once sequencing reaches approximately 30 million reads [67]. This saturation point indicates diminishing returns beyond certain sequencing depths, highlighting the importance of strategic resource allocation in co-assembly projects.
For ARG recovery specifically, deeper sequencing improves detection sensitivity for low-abundance resistance genes but may not necessarily improve contextualization if the additional reads do not span ARG-MGE junctions. Hybrid approaches combining short-read and long-read technologies have shown promise for enhancing ARG contextualization by providing longer continuous sequences that bridge repetitive regions around MGEs [68].
Applications in Environmental Resistome Research
Enhanced ARG and MGE Detection
Co-assembly significantly improves the detection and characterization of ARGs and their association with MGEs across diverse environments:
- Airborne Resistomes: Co-assembly of air samples during dust storms revealed resistance genes against clinically important antibiotics, including aminoglycosides, beta-lactams, fosfomycin, glycopeptides, quinolones, and tetracyclines [67]
- Wastewater Treatment Plants: Global analysis of activated sludge samples using assembly-based approaches identified a core set of 20 ARGs present in all wastewater treatment plants, with 57% of high-quality genomes containing putatively mobile ARGs [4]
- Urban Rivers: Continuous monitoring of river systems showed that assembly-based methods enabled tracking of ARG dynamics in response to seasonal variations and pollution inputs [49]
The longer contigs produced through co-assembly facilitate more reliable identification of ARG-carrying MGEs, which is crucial for assessing transmission risks between environmental bacteria and pathogens.
Resistance Gene Mobility Assessment
A primary advantage of co-assembly in resistome research is the enhanced ability to determine ARG mobility potential. Longer contigs enable researchers to:
- Identify Plasmid-Borne ARGs: Detect association between ARGs and plasmid replication genes
- Characterize Integron Systems: Recover complete integron structures with multiple gene cassettes
- Map Transposon Context: Identify insertion sequences and transposases flanking ARGs
- Assess Host Range: Determine the phylogenetic range of species carrying specific ARG-MGE combinations
Studies show that ARGs are particularly prone to assembly fragmentation due to their frequent location on MGEs and presence in multiple genomic contexts [66]. Co-assembly directly addresses this challenge by producing contigs long enough to span these problematic regions.
Practical Implementation: The Scientist's Toolkit
Research Reagent Solutions
Table 3: Essential Materials and Tools for Co-assembly based Resistome Research
| Category | Specific Tools/Reagents | Function in Co-assembly Workflow |
|---|---|---|
| DNA Extraction Kits | FastDNA SPIN Kit for Soil, CTAB protocol for liquids [29] [68] | High-yield DNA extraction from low-biomass environmental samples |
| Sequencing Technologies | Illumina (short-read), PacBio HiFi, Oxford Nanopore (long-read) [68] [69] | Generate sequencing reads for assembly; hybrid approaches enhance context |
| Quality Control Tools | FastQC, MultiQC, Trimmomatic | Assess read quality and perform adapter trimming |
| Metagenomic Assemblers | metaSPAdes, MEGAHIT, Opera-MS (hybrid) [66] [68] | Perform co-assembly of pooled reads from multiple samples |
| ARG Annotation Databases | CARD, DeepARG, ARGem pipeline [42] [40] | Identify and characterize antibiotic resistance genes in assembled contigs |
| MGE Detection Tools | MobileElementFinder, PlasFlow, ACLAME | Annotate mobile genetic elements and their association with ARGs |
| Binning & Classification | MetaBAT2, MaxBin2, CheckM | Recover metagenome-assembled genomes and assign taxonomic classification |
Bioinformatics Pipelines for ARG Monitoring
Specialized bioinformatics pipelines have been developed to support co-assembly and resistome characterization:
ARGem Pipeline: A user-friendly, locally deployable pipeline that provides full-service analysis from raw DNA reads to visualization of results [42]. Key features include:
- Integrated assembly using metaSPAdes or MEGAHIT
- Comprehensive ARG and MGE databases for annotation
- Statistical analysis and network visualization tools
- Support for metadata capture to facilitate cross-study comparisons
Hybrid Assembly Approaches: Tools like Opera-MS leverage both short-read and long-read technologies to resolve strain-level associations between ARGs and MGEs [68]. This approach combines the accuracy of short reads with the contextual length of long reads, particularly valuable for complex environmental samples.
Co-assembly represents a significant advancement in metagenomic analysis for environmental resistome research. By pooling reads from multiple samples, researchers can overcome critical limitations associated with individual assembly, particularly the fragmentation of contigs around ARGs and MGEs. The quantitative improvements in contig length and assembly metrics directly translate to enhanced ability to determine ARG mobility potential and host associations—key factors in risk assessment.
Future developments in co-assembly methodologies will likely focus on:
- Hybrid Assembly Optimization: Improved algorithms for integrating short-read and long-read data to maximize both accuracy and context [68]
- Single-Molecule Sequencing: Advances in long-read technologies that provide complete plasmid sequences without assembly [69]
- Machine Learning Applications: AI-driven approaches for predicting ARG mobility potential based on sequence features and genomic context [40]
- Standardized Frameworks: Harmonized protocols and metadata standards to enable cross-study comparisons and global monitoring initiatives [4] [42]
As antimicrobial resistance continues to pose grave threats to public health, co-assembly strategies will play an increasingly vital role in understanding and mitigating the environmental dimensions of this crisis. By enabling more accurate characterization of resistance gene mobility and dissemination pathways, co-assembly empowers researchers to identify critical control points and develop targeted interventions within a One Health framework.
The rapid global dissemination of antimicrobial resistance (AMR) represents one of the most critical challenges to modern public health, linked to an estimated 1.14 million deaths annually worldwide [70]. Antibiotic resistance genes (ARGs) spread primarily through mobile genetic elements (MGEs) such as plasmids, transposons, and integrons, which enable horizontal gene transfer (HGT) between bacterial species across diverse environments [71] [72]. Understanding the mechanisms and pathways through which ARGs mobilize and transfer between genetic vectors is fundamental to tracking and mitigating resistance spread, particularly within environmental reservoirs that serve as breeding grounds for novel resistance determinants.
Environmental resistomes—the comprehensive collection of ARGs in microbial communities—represent vast reservoirs of both known and novel resistance genes. While clinical settings have traditionally been the focus of AMR surveillance, research has demonstrated that environments including wastewater, soil, and agricultural systems harbor diverse ARGs that can transfer to pathogens [72] [73]. A comprehensive analysis of 864 metagenomes from humans, animals, and external environments revealed that external environments exhibit high taxonomic diversity linked to extensive variety in both biocide/metal resistance genes and MGEs [72]. This genetic mobility infrastructure creates ideal conditions for the emergence and dissemination of novel resistance combinations.
The mobility assessment of ARGs requires sophisticated methodological approaches that can simultaneously identify resistance genes, their genetic contexts, and their bacterial hosts. This technical guide provides researchers with current methodologies and frameworks for investigating ARG mobility, with particular emphasis on linking ARGs to their plasmid and other vector carriers. By establishing standardized approaches for mobility assessment, the scientific community can better identify high-risk environments and genetic elements that contribute most significantly to the global AMR crisis.
Current Methodologies for ARG Mobility Assessment
Computational and Sequencing-Based Approaches
Advanced bioinformatic pipelines now enable researchers to systematically investigate ARG mobility by combining long-read sequencing technologies with specialized computational tools. The Long-read based Antibiotic Resistome Risk Assessment Pipeline (L-ARRAP) represents a significant methodological advancement, specifically designed to quantify antibiotic resistome risks from Nanopore or PacBio sequencing data [37]. This pipeline concurrently identifies ARGs, MGEs, and human bacterial pathogens, integrating their interactions into a comprehensive risk scoring system through the Long-read based Antibiotic Resistome Risk Index (L-ARRI). The methodology employs stringent alignment criteria (≥75% identity and ≥90% coverage) against curated databases including SARG for ARGs and MobileOG-db for MGEs, followed by taxonomic classification using Centrifuge to identify pathogenic hosts [37].
For investigating specific transfer mechanisms, particularly inter-plasmid ARG recruitment, researchers have developed approaches to identify potentially recently transferred ARGs through comparative genomic analysis. This method involves identifying nearly identical full DNA sequences of ARGs (≥99% nucleotide identity and 100% coverage) present in distinct plasmids from different host bacteria, operational defined as recently transferred ARGs [71]. The approach further distinguishes genuine transfer events from plasmid inheritance by requiring that the broader plasmid sequences show limited similarity (<80% nucleotide identity and <80% coverage in pairwise alignment), ensuring the identified ARG transfers represent recruitment between genetically distinct vectors rather than vertical inheritance of entire plasmids [71].
Table 1: Key Bioinformatics Tools for ARG Mobility Assessment
| Tool Name | Primary Function | Sequence Platform | Key Databases | Advantages |
|---|---|---|---|---|
| L-ARRAP | ARG risk quantification | Nanopore/PacBio | SARG, MobileOG-db | Integrated risk scoring; no assembly required |
| ARGpore2 | ARG identification & context | Nanopore | SARG, ISFinder | Optimized for long reads |
| COPLA | Plasmid classification | Illumina | Plasmid MLST | Taxonomic units for plasmids |
| I-VIP | Integron identification | All platforms | Integron database | Comprehensive integron analysis |
Experimental Validation Methods
While bioinformatic analyses can predict ARG mobility, experimental validation remains essential for confirming transfer mechanisms and rates. Conjugation assays represent the gold standard for investigating plasmid-mediated ARG transfer, allowing researchers to quantify transfer frequencies between donor and recipient strains under controlled conditions [71]. These assays typically employ filter mating protocols where donor and recipient strains are mixed at specific ratios, incubated on solid surfaces to facilitate cell-to-cell contact, and then plated on selective media containing antibiotics that distinguish transconjugants (recipients that have acquired the plasmid) from both donor and recipient strains.
Experimental evolution provides another powerful approach for investigating ARG mobility dynamics over time. A recent study tracking the mobilization of the carbapenemase gene blaOXA-48 from plasmids to the chromosome in Escherichia coli employed a 28-day serial passage experiment with subinhibitory concentrations of meropenem to simulate clinical selection pressure [74]. This approach enabled researchers to observe the complete process of ARG integration, from initial plasmid cost through transposition to chromosomal stabilization, revealing the critical role of bacterial defense systems like the ApsAB antiplasmid system in driving this evolutionary pathway [74].
For investigating the environmental fate of ARGs, constructed wetland (CW) microcosms offer controlled systems for studying how natural treatment processes affect ARG persistence and transfer. These systems evaluate ARG removal efficiency through various mechanisms including substrate adsorption, plant uptake, and microbial degradation, with studies demonstrating removal rates ranging from 14.5% to 99.9% depending on wetland type and target ARGs [73]. By comparing ARG abundance and diversity in inflow versus outflow using high-throughput qPCR, researchers can quantify removal efficiencies and identify conditions that maximize ARG attenuation.
Key Experimental Protocols for ARG Mobility Assessment
L-ARRAP Pipeline for Long-Read Risk Assessment
The Long-read based Antibiotic Resistome Risk Assessment Pipeline (L-ARRAP) provides a standardized workflow for assessing ARG risk from long-read sequencing data, with particular utility for identifying ARG associations with MGEs and pathogenic hosts [37].
Sample Processing and Sequencing:
- DNA Extraction: Extract high-molecular-weight DNA using kits optimized for long-read sequencing (e.g., CTAB method with additional purification steps).
- Library Preparation: Prepare sequencing libraries according to platform-specific protocols (1D ligation for Nanopore or SMRTbell for PacBio).
- Sequencing: Conduct sequencing on Nanopore (MinION, GridION, or PromethION) or PacBio (Sequel IIe) platforms to generate long reads (>10 kb recommended).
Bioinformatic Analysis:
- Quality Control: Process raw reads using Chopper (v8.0.1) with parameters '-q 10 -l 500' to remove low-quality sequences and retain reads >500 bp.
- ARG Identification: Align reads to the SARG database (v2.0) using Minimap2 (v2.26) with platform-specific presets ('map-ont' for Nanopore, 'map-pb' for PacBio). Apply thresholds of ≥75% identity and ≥90% coverage for ARG identification.
- MGE Annotation: Align reads to the MobileOG-db (Version: Beatrix 1.6 v1) using LAST (v2.27.1) with parameters '-m 100 -D1e9 -K 1' and the same identity/coverage thresholds as ARG identification.
- Pathogen Identification: Annotate taxonomy using Centrifuge (v1.0.4) against the NCBI nucleotide database, then identify human bacterial pathogens by comparison to the WHO priority pathogens list and ESKAPE database.
- Risk Index Calculation: Compute the Long-read based Antibiotic Resistome Risk Index (L-ARRI) by integrating ARG abundance, MGE proximity, and pathogenic host associations using the published algorithm [37].
Identification of Inter-Plasmid ARG Transfer
This protocol enables systematic detection of ARG transfer events between plasmids through comparative genomic analysis, adapted from methodologies described in recent research [71].
Plasmid Genome Curation:
- Data Collection: Download complete plasmid genomes from NCBI RefSeq database. Extract metadata including host information and isolation source using custom Python scripts.
- Plasmid Classification: Classify plasmids as conjugative, mobilizable, or non-mobilizable based on the presence of transfer machinery (relaxase, T4CP, T4SS) using tools like MOB-suite. Further classify using COPLA for taxonomic assignment.
- Source Categorization: Categorize plasmids as clinical or environmental based on isolation source annotations, with clinical sources including human blood, urine, fecal swabs, and hospital environments.
ARG and MGE Annotation:
- Open Reading Frame Prediction: Predict ORFs using Prodigal (v2.6.3) with default parameters.
- ARG Identification: Annotate ARGs by aligning ORFs to the SARG database using BLASTp with E-value ≤1e-5, ≥90% similarity, and ≥80% query coverage.
- MGE Identification: Identify integrons using the Integron Visualization and Identification Pipeline (I-VIP) with default settings. Detect insertion sequences (IS) by BLASTn against the ISFinder database with E-value ≤1e-10, ≥80% similarity, and ≥80% coverage.
Transfer Event Detection:
- Recently Transferred ARG Identification: Identify ARGs with ≥99% nucleotide identity and 100% coverage present in distinct plasmids (sharing <80% nucleotide identity and <80% coverage in whole-plasmid alignment) from different host species.
- Context Analysis: Extract 5 kb flanking sequences upstream and downstream of transferred ARGs to identify associated MGEs and determine potential transfer mechanisms.
- Network Construction: Build multilevel networks connecting ARGs, plasmids, and bacterial hosts to visualize transfer pathways and identify hub elements facilitating cross-taxa ARG dissemination.
Visualization of ARG Mobility Pathways and Relationships
ARG Mobility Assessment Workflow
The complexity of ARG mobility assessment requires integrated workflows that combine wet-lab and computational approaches. The following diagram illustrates a comprehensive framework for investigating ARG transfer mechanisms, incorporating elements from multiple methodological approaches described in the literature [37] [71] [74].
Inter-Plasmid ARG Transfer Mechanisms
The transfer of ARGs between plasmids represents a crucial mechanism for the assembly of multidrug resistance constellations. The following diagram illustrates the primary pathways and genetic elements involved in inter-plasmid ARG recruitment, based on recent findings that over 88% of ARG transfers occur between compatible plasmids within the same bacterial cell [71].
Table 2: Key Research Reagent Solutions for ARG Mobility Studies
| Category | Specific Tool/Reagent | Function/Application | Key Features |
|---|---|---|---|
| Sequencing Platforms | Oxford Nanopore | Long-read sequencing for ARG context | Real-time sequencing; long reads (>20 kb) |
| PacBio HiFi | Long-read sequencing with high accuracy | Circular consensus sequencing; >99% accuracy | |
| Reference Databases | SARG (v2.0) | ARG identification and classification | Structured ARG database; hierarchical annotation |
| MobileOG-db | MGE identification and categorization | Protein-based MGE database; functional classification | |
| ISFinder | Insertion sequence annotation | Comprehensive IS database; family classification | |
| Bioinformatic Tools | Minimap2 | Sequence alignment for long reads | Optimized for noisy long reads; fast alignment |
| Centrifuge | Taxonomic classification | Memory-efficient; rapid classification | |
| COPLA | Plasmid classification | Taxonomic units for plasmids; avoids MGE bias | |
| Experimental Systems | Conjugation Assay | Horizontal transfer quantification | Direct measurement of transfer frequencies |
| Experimental Evolution | ARG mobility dynamics | Observes evolutionary trajectories over time | |
| Constructed Wetlands | Environmental ARG fate studies | Natural treatment system simulation |
Data Analysis and Interpretation Frameworks
Quantitative Assessment of ARG Transfer Networks
Network analysis has emerged as a powerful approach for identifying key actors and pathways in ARG dissemination. A comprehensive study of 2,420 clinical plasmids revealed that 87% of ARGs showed evidence of potential transfer among various plasmids, with IS26 facilitating 63.1% of these transfer events [71]. When analyzing network data, researchers should focus on identifying central hub elements—ARGs, MGEs, or plasmids—that display high connectivity and may therefore represent priority targets for intervention strategies.
For quantitative assessment of transfer frequency, calculate the horizontal gene transfer index as the number of between-bacterial host pairs (at species level) sharing at least one transferred ARG, divided by the total number of between-bacterial host pairs. This normalized metric enables comparison across studies and datasets. Additionally, researchers should quantify the mobility potential of specific ARGs by calculating the ratio of transferred copies to total detected copies across all analyzed samples, which helps prioritize ARGs with high dissemination capacity for further investigation.
Statistical Integration of Multiple Drivers
ARG mobility is influenced by complex interactions between multiple factors. Variance Partitioning Analysis (VPA) has proven valuable for quantifying the relative contributions of different driver categories. A study of raw milk resistomes found that the combined effect of physicochemical properties and MGEs explained 33.5% of ARG distribution, while the interplay between physicochemical parameters and microbial communities explained 31.8%, and physicochemical factors alone contributed 20.7% [29]. These findings highlight the importance of integrated approaches that consider multiple simultaneous drivers rather than focusing on single factors.
When interpreting mobility assessment results, researchers should employ multivariate statistical approaches including Procrustes analysis to test concordance between ARG profiles and microbial community structures, and Mantel tests to correlate genetic and environmental distance matrices. These analyses help determine whether ARG dissemination patterns follow microbial ecology principles or display independent dissemination patterns, which has important implications for understanding and predicting resistance spread.
The mobility assessment of antibiotic resistance genes represents a critical frontier in the global effort to combat antimicrobial resistance. By linking ARGs to their specific plasmid and other vector carriers, researchers can identify high-risk genetic elements that contribute disproportionately to resistance dissemination and prioritize targets for intervention. The methodologies outlined in this technical guide—from long-read sequencing pipelines to experimental validation approaches—provide a comprehensive toolkit for investigating the complex mobility pathways that enable ARGs to traverse species and environmental boundaries.
Future advances in ARG mobility assessment will likely focus on single-cell sequencing technologies that can directly link ARGs to their host genomes without assembly, CRISPR-based tracking systems for monitoring specific ARG variants in complex environments, and machine learning approaches for predicting mobility potential based on genetic features. Additionally, standardized mobility risk assessment frameworks similar to L-ARRI but incorporating more nuanced ecological and epidemiological parameters will enhance our ability to identify emerging threats before they achieve widespread dissemination.
As research continues to reveal the intricate networks connecting environmental resistomes to clinical resistance, the systematic assessment of ARG mobility will play an increasingly vital role in guiding evidence-based interventions to preserve antibiotic efficacy for future generations.
Navigating Database Limitations and Annotation Inconsistencies
The study of the environmental resistome—the comprehensive collection of all antibiotic resistance genes (ARGs) and their precursors in both pathogenic and non-pathogenic microorganisms—has become fundamental to understanding the global antimicrobial resistance (AMR) crisis. Environmental reservoirs, including wastewater treatment plants, agricultural soils, and aquaculture systems, act as silent incubators of resistance genes, with horizontal gene transfer and stress-induced mutagenesis fueling their evolution and dissemination [40]. This genetic reservoir exists as an expansive continuum across soil, water, animals, and commensal microbes, with clinical multidrug resistance often arising when selective pressures mobilize these ancient genes into human pathogens [40].
Within this context, reliable bioinformatic databases and annotation pipelines form the foundational infrastructure for resistome research. Accurate identification and characterization of ARGs in complex environmental metagenomes directly impact our understanding of resistance prevalence, transmission dynamics, and potential health risks. However, researchers face significant challenges stemming from database limitations and annotation inconsistencies that can compromise data comparability, reproducibility, and biological interpretation across studies. This technical guide examines these critical limitations, provides structured comparisons of available resources, and offers detailed methodologies to enhance reliability in environmental ARG research.
Landscape of Antibiotic Resistance Gene Databases
Major Database Platforms and Their Evolution
Several specialized databases have been developed to catalog ARGs, each with distinct architectures, curation philosophies, and application strengths. The first comprehensive database, the Antibiotic Resistance Genes Database (ARDB), established in 2009, contained 13,293 sequences affiliated with 257 antibiotics but has not been updated since 2009, meaning critically important ARGs discovered subsequently (such as NDM-1 and mcr-1) are absent [75]. The Comprehensive Antibiotic Resistance Database (CARD), rigorously constructed in 2013 and frequently updated, takes a quality-over-quantity approach with 2,498 carefully curated reference sequences but potentially limited coverage for certain environmental resistome studies [75].
The Structured Antibiotic Resistance Genes (SARG) database, built on sequences from ARDB and CARD, introduced a hierarchical structure by integrating ARG sequences, removing redundancies, and reselecting representative query sequences [75]. Specialized databases focusing on specific antibiotic classes also exist, such as the Lactamase Engineering Database (LacED) and the Lahey Database of β-lactamases, but these necessarily provide limited scope for comprehensive resistome profiling [75]. DeepARG-DB was designed to enhance quality through built-in models for deep learning approaches [75].
Quantitative Database Comparisons
Table 1: Comparative Analysis of Major ARG Database Characteristics
| Database | Initial Release | Last Update | Sequence Count | ARG Subtypes | Primary Focus | Key Limitations |
|---|---|---|---|---|---|---|
| ARDB | 2009 | 2009 (abandoned) | 13,293 | 180 | Broad resistance | No recent updates, missing novel ARGs |
| CARD | 2013 | Frequent updates | 2,498 | 338 | High-quality curation | Limited sequence coverage |
| SARG | 2016 | Periodically updated | 12,085 | 225 | Hierarchical structure | Moderate coverage |
| NRD | 2023 | 2023 | 18,619 | 444 | Non-redundant compilation | Derived database |
| NCRD | 2023 | 2023 | 710,231 | 444 | Comprehensive coverage | Computational burden |
Table 2: Performance Metrics in Environmental Metagenome Annotation
| Database | ARGs Identified in Wastewater | ARGs Identified in Agricultural Soil | Sensitivity (%) | Specificity (%) | Annotation Consistency |
|---|---|---|---|---|---|
| ARDB | 82.3 ± 6.7 | 45.2 ± 8.1 | 63.5 | 88.9 | Low |
| CARD | 95.1 ± 4.2 | 61.3 ± 7.5 | 78.2 | 95.7 | High |
| SARG | 108.7 ± 5.9 | 72.8 ± 6.9 | 85.6 | 92.3 | Medium |
| NCRD | 156.3 ± 8.4 | 98.5 ± 9.2 | 94.3 | 89.5 | High |
The Non-redundant Comprehensive antibiotic resistance genes Database (NCRD) represents a recent approach to overcoming individual database limitations. Constructed by consolidating sequences from ARDB, CARD, and SARG, then identifying homologous proteins from the Non-redundant Protein Database (NR) and Protein DataBank (PDB), NCRD clusters sequences at 100% (NCRD100) and 95% (NCRD95) similarity thresholds [75]. This approach significantly expands coverage to 710,231 protein sequences while maintaining 444 standardized ARG subtypes, dramatically increasing the detection potential for both known and novel resistance determinants in environmental samples [75].
Critical Limitations in Current ARG Annotation Pipelines
Database-Specific Annotation Inconsistencies
Studies comparing ARG annotation outputs from identical metagenomic datasets across different databases reveal substantial inconsistencies that complicate cross-study comparisons and meta-analyses. These inconsistencies arise from several fundamental differences in database construction and curation philosophies. The limited number of high-quality reference sequences in databases like CARD, while beneficial for annotation speed and specificity, comes at the cost of potentially missing divergent ARG variants prevalent in environmental microbes [75]. This is particularly problematic for environmental resistome studies where resistance determinants may differ substantially from those circulating in clinical pathogens.
Standardization challenges in gene nomenclature present another significant hurdle. Different databases may use varying naming conventions for the same ARG, or conversely, use identical names for genetically distinct elements. Research demonstrates that when analyzing the same dataset, different databases can identify non-overlapping sets of ARGs, with consistency rates as low as 62% for certain antibiotic classes [75]. This problem is exacerbated by the absence of standardized mechanisms for classifying and naming newly discovered resistance genes from environmental sources.
Specialized databases focusing on specific antibiotic classes (particularly β-lactamases) introduce annotation biases by providing comprehensive coverage for their target antibiotics while offering limited representation for other classes [75]. This creates significant blind spots when attempting comprehensive resistome characterization in environmental samples where resistance diversity is typically broad.
Impact on Environmental Resistome Profiling
The choice of database directly influences the biological conclusions drawn from environmental resistome studies. Research comparing wastewater, freshwater, and agricultural soil resistomes found that the relative abundance of total ARGs showed no statistically significant difference between raw and treated wastewater when annotated against a merged CARD-ResFinder database [76]. However, this conclusion might differ if alternative databases with different coverage characteristics were employed.
In wastewater treatment plants—critical hotspots for ARG exchange—global analyses have identified a core set of 20 ARGs present in all facilities worldwide, dominated by tetracycline, beta-lactam, and glycopeptide resistance genes [4]. The accurate quantification of these core resistome elements is highly database-dependent, potentially impacting risk assessments and interventional evaluations. Agricultural studies examining the effects of zinc oxide and antimicrobial prophylaxis removal from pig farming found significant differences in macrolide-lincosamide-streptogramin (MLS) and trimethoprim resistance determinants between treatment groups, but these findings might represent only a fraction of the actual biological differences due to database limitations [77].
Figure 1: Impact of Database Limitations on Environmental Resistome Research Workflow
Methodological Framework for Enhanced ARG Annotation
Integrated Multi-Database Annotation Protocol
To overcome the limitations of individual databases, researchers should implement a multi-database annotation approach followed by rigorous consistency filtering. The following protocol outlines a standardized workflow for enhanced ARG detection in environmental samples:
Step 1: Parallel Annotation Process quality-filtered metagenomic reads or assembled contigs through at least three complementary databases: CARD (for high-quality curation), SARG (for hierarchical classification), and NCRD (for comprehensive coverage). For studies focusing on specific antibiotic classes, include relevant specialized databases (e.g., LacED for β-lactamases).
Step 2: Result Consolidation Merge results from all databases, preserving database-of-origin information for each annotation. Apply length and similarity thresholds (recommended: >52 amino acids and >90% similarity) to minimize false positives while maintaining sensitivity [75].
Step 3: Nomenclature Standardization Implement a standardized gene naming protocol based on CARD nomenclature where possible, as this database maintains rigorous ontological consistency. For genes absent from CARD, adopt the most specific name provided by the source databases and document naming decisions.
Step 4: Confidence Scoring Assign confidence scores to each ARG identification based on:
- Database concordance (higher scores for ARGs identified by multiple databases)
- Sequence similarity to reference
- Alignment coverage
- Consistency with known resistance mechanisms
Step 5: Validation Where feasible, validate high-priority ARG annotations through targeted PCR amplification and sequencing, or functional screening approaches.
Quality Control and Standardization Procedures
Robust quality control measures are essential for reliable environmental resistome characterization. The following procedures should be implemented:
Sequence Quality Thresholds:
- Minimum length: 52 amino acids for protein-based searches [75]
- Minimum similarity: 90% for homologous sequences [75]
- Minimum coverage: 80% of reference sequence length
Negative Controls:
- Include negative controls during DNA extraction and sequencing
- Process blank samples through identical bioinformatic pipelines
- Subtract background signals from experimental samples
Positive Controls:
- Spike-in control sequences for quantification normalization
- Reference samples with known ARG composition
- Cross-validation with culture-based methods when possible
Normalization Approaches:
- Normalize ARG abundances to 16S rRNA gene copies or cell counts
- Account for sequencing depth variations
- Consider genomic copy number variations for accurate quantification
Table 3: Research Reagent Solutions for Environmental Resistome Analysis
| Reagent/Resource | Category | Function | Example Specifications |
|---|---|---|---|
| NCRD Database | Bioinformatics | Comprehensive ARG annotation | 710,231 protein sequences, 444 ARG subtypes [75] |
| CARD Database | Bioinformatics | Curated ARG reference | 2,498 reference sequences, ontology-based [75] |
| PathoFact Pipeline | Bioinformatics | ARG & MGE identification | Integrated meta-omic analysis [78] |
| DeepARG Tool | Bioinformatics | Deep learning-based detection | Companion to DeepARG-DB [75] |
| ZymoBIOMICS DNA Kit | Wet Lab | Community DNA extraction | Standardized for diverse environmental samples |
| Mock Community Standards | Quality Control | Sequencing normalization | Defined composition for process validation |
Case Study: Wastewater Treatment Plant Resistome Analysis
Multi-Database Comparison in WWTP Environments
Wastewater treatment plants represent critical interfaces between human activities and natural environments, receiving wastewater from diverse sources and serving as hotspots for ARG exchange. A comprehensive analysis of activated sludge samples from 142 WWTPs across six continents revealed a core set of 20 ARGs present in all facilities, dominated by tetracycline resistance MFS efflux pumps (15.2%), Class B beta-lactamases (13.5%), and vanT genes in the vanG cluster (11.4%) [4].
When comparing database performance for WWTP resistome annotation, significant variations emerge. The NCRD database identified 156.3 ± 8.4 ARGs per sample, substantially higher than CARD (95.1 ± 4.2) or SARG (108.7 ± 5.9) [75]. This enhanced detection capability is particularly valuable for identifying emerging resistance threats and understanding the full diversity of resistance determinants in these engineered ecosystems.
Longitudinal analysis of a biological wastewater treatment plant over 1.5 years revealed persistent core resistome elements, with 15 AMR categories consistently present across all timepoints [78]. This core resistome included aminoglycoside, beta-lactam, and multidrug resistance genes, while six additional categories (including aminocoumarin and elfamycin resistance) were prevalent (>75% of timepoints) [78]. The detection sensitivity for these persistent resistance elements varied significantly depending on the database employed, highlighting the importance of database selection for time-series analyses.
Mobilome-Driven Resistome Segmentation
Advanced meta-omic analyses demonstrate that mobile genetic elements (MGEs) differentially contribute to the dissemination of various AMR categories within WWTP microbial communities. Plasmids and bacteriophages show distinct preferences for specific resistance types, creating a segmented mobilization landscape [78].
Figure 2: Segmentation of AMR Dissemination by Mobile Genetic Elements in WWTPs [78]
This mobilome-driven segregation has profound implications for AMR dissemination risk assessment. Plasmid-mediated resistance (including aminoglycoside, bacitracin, MLS, and sulfonamide) may spread more readily through conjugation, while phage-mediated resistance (fosfomycin and peptide) follows different transmission pathways [78]. Accurate annotation of these associations requires databases with comprehensive coverage of both ARGs and MGEs, highlighting another dimension of database limitations in environmental resistome research.
Future Directions and Standardization Initiatives
Toward a Unified ARG Annotation Framework
The development of standardized protocols and benchmark datasets represents an urgent priority for the environmental resistome research community. Several initiatives show promise for addressing current challenges:
The NCRD approach demonstrates the value of integrating multiple database resources while implementing rigorous non-redundancy protocols [75]. This strategy balances comprehensive coverage with computational efficiency through similarity-based clustering at 95% and 100% identity thresholds.
Machine learning approaches, particularly deep learning models as implemented in DeepARG, offer potential for detecting divergent ARG variants that escape traditional similarity-based searches [75]. These methods can identify structural and functional patterns indicative of resistance potential even in sequences with low similarity to known ARGs.
The definition of environment-specific resistome signatures provides a framework for monitoring anthropogenic impacts on resistance gene flows. Research has identified 27 ARGs that form a wastewater-specific signature, present in ≥90% of wastewater metagenomes but infrequent in freshwater or agricultural soil resistomes [76]. These signature genes, targeting tetracyclines, macrolide-lincosamide-streptogramin B, aminoglycosides, beta-lactams, and other drug classes, enable targeted surveillance and source tracking.
Integration with One Health Surveillance Networks
The environmental dimension of AMR cannot be separated from human and animal health considerations, necessitating integrated One Health approaches. Wastewater-based epidemiology provides population-level resistance surveillance that complements clinical monitoring [4]. Standardized database frameworks are essential for comparing resistomes across humans, animals, and environments to identify transmission pathways and intervention points.
Longitudinal studies reveal that environmental resistomes maintain a persistent core despite interventional efforts. Research on pig farms that removed antimicrobial and zinc oxide prophylaxis for three years showed only limited reductions in AMR prevalence, suggesting entrenched resistance elements that persist despite selective pressure removal [77]. Accurate monitoring of such temporal patterns requires consistent database platforms and annotation standards throughout study durations.
Database limitations and annotation inconsistencies present significant challenges for environmental resistome research, potentially compromising the accuracy of risk assessments and the efficacy of interventional strategies. The divergent results produced by different databases for identical metagenomic datasets highlight the need for multi-database approaches, standardized nomenclature, and transparent reporting standards.
The development of comprehensive, non-redundant databases like NCRD represents significant progress, but further community-wide efforts are needed to establish benchmark datasets, standardized protocols, and quality control measures. As resistome research increasingly informs public health policies and clinical practices, ensuring the reliability and comparability of environmental ARG data becomes not merely a technical concern but an ethical imperative for addressing the global antimicrobial resistance crisis.
Researchers must carefully select database resources based on their specific study objectives, implement rigorous validation procedures, and clearly document methodological choices to enable proper interpretation and cross-study comparison. Through collaborative efforts toward standardization and enhanced bioinformatic resources, the scientific community can overcome current limitations and provide the reliable environmental resistome data needed to guide evidence-based interventions against antimicrobial resistance.
Optimizing Functional Metagenomics for Heterologous Expression of ARGs
The environmental resistome constitutes a vast and dynamic reservoir of antibiotic resistance genes (ARGs). These genes can be transferred from non-pathogenic environmental bacteria to human pathogens, primarily through horizontal gene transfer (HGT), presenting a severe threat to global public health [34]. The discharge of antibiotics from manufacturing and agricultural practices enriches these environmental reservoirs, selecting for resistant bacteria and facilitating the dissemination of ARGs [3] [79]. Functional metagenomics has emerged as a powerful, culture-independent approach for discovering novel ARGs by allowing for the heterologous expression of metagenomic DNA in surrogate hosts, such as Escherichia coli. This method is particularly valuable as it directly identifies genes that are functional in a new host, mimicking the natural HGT process [79] [34]. However, the functional compatibility of heterologous genes is not guaranteed. This guide details strategies to optimize functional metagenomic workflows to overcome barriers to ARG expression and more effectively mine the environmental resistome.
Key Factors Governing Heterologous Expression of ARGs
The successful functional expression of an ARG from an environmental source in a laboratory host is governed by more than just the presence of the gene sequence. A comprehensive study sampling 200 diverse ARGs revealed that traditional sequence-based barriers, such as GC content, codon usage (CAI), and mRNA-folding energy, were of minor importance for the functionality of mechanistically diverse gene products at moderate expression levels [80]. Instead, two major factors were identified:
- Phylogenetic Origin: The evolutionary relatedness between the source organism and the heterologous host is a critical determinant of functional compatibility [80].
- Resistance Mechanism and Host Physiology Dependence: The biochemical mechanism of resistance and its reliance on specific host cellular machinery significantly influence whether a gene will function in a new host. For instance, genes conferring resistance via enzymatic inactivation (e.g., β-lactamases) or target protection (e.g., ribosomal protection proteins) showed higher functional compatibility compared to mechanisms like efflux pumps, which often require complex, host-embedded protein systems [80].
Table 1: Functional Success Rates of ARGs by Mechanism and Drug Class (Based on Heterologous Expression in E. coli)
| Target Drug Class | Primary Mechanism(s) | Proportion of Functional Genes (%) | Average Resistance Level (Fold Increase in MIC) |
|---|---|---|---|
| Tetracyclines | Ribosomal protection, Efflux | >80 | Moderate |
| Sulfonamides | Target bypass | >80 | Moderate |
| β-lactams | Enzymatic inactivation | >80 | High |
| Fluoroquinolones | Target protection | >80 | Low |
| Aminoglycosides | Enzymatic modification | Moderate | High |
| Chloramphenicol | Enzymatic inactivation | Moderate | High |
| Trimethoprim | Target bypass | Moderate | High |
| Polymyxins | Target modification | Low | Low |
| Multi-drug | Efflux | Low | Variable |
Optimized Experimental Workflow for Functional Metagenomics
The following workflow integrates best practices for maximizing the recovery of functional ARGs from environmental samples.
Sample Collection and DNA Extraction
- Sample Types: The workflow can be applied to diverse habitats, including soil, sediment, water, and air particulate matter [25].
- Biased Sampling: To increase the likelihood of discovering novel ARGs, target environments with high antibiotic selection pressure, such as effluent discharge points from pharmaceutical manufacturing [79].
- DNA Extraction: Use commercial kits designed for environmental samples (e.g., PowerSoil DNA Isolation Kit) to obtain high-quality, high-molecular-weight DNA. A mix of DNA from multiple samples from the same site (composite sampling) can be used to increase diversity [79].
Library Construction: Maximizing Diversity and Expression
- Vector Selection: Clone metagenomic DNA into suitable expression vectors, such as
pZE21-MCSorpCF430[79]. These vectors typically contain inducible promoters (e.g., lac, T7) to control gene expression and avoid toxicity. - Large vs. Small Insert Sizes: While large-insert libraries (e.g., BACs) are valuable for capturing large gene clusters, small-insert libraries (2-5 kb) are often more effective for single ARG discovery. Smaller inserts reduce host genome complexity, increase library size, and improve the likelihood that the gene is expressed from the vector's promoter without the need for its own regulatory elements [79].
- Multi-Host Screening: To overcome host-specific barriers, employ a multi-host screening approach. Using different surrogate hosts (e.g., different E. coli strains, Pseudomonas putida) can reveal genes that are non-functional in a single standard lab strain due to physiological incompatibilities [80].
Functional Screening and Hit Validation
- Antibiotic Panels: Screen libraries against a panel of antibiotics representing major drug classes (e.g., β-lactams, aminoglycosides, macrolides, tetracyclines, sulfonamides) at concentrations 2-5 times the minimal inhibitory concentration (MIC) of the host strain [80] [79].
- Tiered Screening: Implement a multi-tiered screening process. Initial selection on a single antibiotic concentration is followed by secondary screening to determine the MIC conferred by the cloned DNA [80].
- Sequence-Based Validation: Sequence the insert DNA from resistant clones. Compare the identified open reading frames (ORFs) against resistome databases to determine if the gene is novel or a known variant [79] [34].
The following diagram visualizes this optimized end-to-end workflow.
The Scientist's Toolkit: Essential Reagents and Materials
Table 2: Key Research Reagent Solutions for Functional Metagenomics
| Reagent/Material | Function/Description | Example Product/Citation |
|---|---|---|
| PowerSoil DNA Isolation Kit | Extracts high-quality, PCR-inhibitor-free metagenomic DNA from complex environmental samples. | [79] |
| pZE21-MCS / pCF430 Vectors | Cloning vectors with inducible promoters and multiple cloning sites for constructing small-insert metagenomic libraries. | [79] |
| SmartChip Real-time PCR System | High-throughput qPCR platform for absolute quantification of ARG abundance and diversity in samples prior to library construction. | [25] |
| Restriction Enzymes (PstI, HindIII) | Used for partial digestion of metagenomic DNA to create fragments suitable for library construction. | [79] |
| Surrogate Hosts (E. coli MG1655) | Standard laboratory strain for heterologous expression; using multiple hosts can increase functional gene recovery. | [80] |
| Antibiotic Master Panels | Pre-configured panels of antibiotics from different classes for efficient functional screening of metagenomic libraries. | [80] [79] |
Data Analysis and ARG Characterization
- Resistome Databases: Annotate sequenced hits by comparing them against specialized databases such as the Comprehensive Antibiotic Research Database (CARD) and the Antibiotic Resistance Genes Database (ARDB) [25] [34].
- Genetic Context Analysis: Analyze the DNA flanking the identified ARG for the presence of mobile genetic elements (MGEs) like insertion sequences, transposases, and integrons. This provides insight into the gene's potential for horizontal transfer [79].
- Quantitative Assessment: Use high-throughput quantitative PCR (HT-qPCR) to determine the absolute and relative abundance of discovered ARGs in the original environment, aiding in risk assessment [25]. The absolute abundance is calculated as: Gene absolute abundance = Gene relative abundance × 16S rRNA gene absolute copies [25].
Table 3: Quantification of Environmental ARG Abundance via HT-qPCR
| Measurement Type | Calculation Formula | Significance |
|---|---|---|
| Gene Copy Number | ( 10^{(31 - Ct)/(10/3)} ) | Absolute copy number of a specific ARG in the reaction. |
| Relative Abundance | ( \frac{Gene\ copy\ number}{16S\ rRNA\ gene\ copy\ number} ) | Normalizes ARG abundance to total bacterial abundance. |
| Absolute Abundance | Relative Abundance × 16S rRNA absolute copies | Estimates the total number of ARG copies in the original sample. |
Optimizing functional metagenomics for the heterologous expression of ARGs requires a strategic approach that moves beyond sequence composition considerations. By focusing on sampling from high-pressure environments, employing small-insert libraries, utilizing multiple surrogate hosts, and understanding the constraints imposed by phylogenetic origin and resistance mechanism, researchers can significantly enhance their discovery yield. As the environmental resistome continues to evolve under anthropogenic pressure, these refined methodologies are critical for proactively identifying novel, high-risk resistance genes before they emerge in clinical settings.
Risk Ranking, Clinical Validation, and Comparative Resistomics
The environmental dimension of antimicrobial resistance (AMR) has been increasingly recognized as a critical component under the One Health framework, which emphasizes the interconnectedness of human, animal, and environmental health [81]. Environmental compartments represent the largest reservoir of both known and novel antibiotic resistance genes (ARGs), far exceeding the diversity found in human and animal microbiota [81]. This vast environmental gene pool provides a source from which pathogens can acquire resistance determinants, ultimately impacting clinical treatment outcomes. The Global Research on Antimicrobial Resistance (GRAM) report estimated that antibiotic resistance was linked to approximately 4.95 million deaths in 2019, highlighting the urgent need for effective containment strategies that address all components of the One Health spectrum [81].
Quantitative risk assessment of environmental ARGs presents unique challenges compared to clinical settings, where the direct link to treatment failure provides a clear risk indicator [31]. In environmental contexts, complex microbial community behaviors, horizontal gene transfer (HGT) dynamics, and the extended time frames between ARG presence in the environment and potential human health impacts create substantial methodological hurdles [31]. This technical guide synthesizes current frameworks and methodologies for assessing the health risks posed by environmental ARGs, with particular focus on the critical indicators of mobility potential, host pathogenicity, and clinical relevance that determine their potential to impact human health.
Theoretical Foundations of ARG Risk Assessment
Key Risk Indicators and Their Integration
Contemporary frameworks for ARG risk assessment have evolved to incorporate multiple quantitative indicators that collectively determine the potential health threat posed by individual resistance genes. Zhang et al. (2022) proposed a comprehensive framework based on four essential indicators: human accessibility, mobility, pathogenicity, and clinical availability [82]. This approach recognizes that not all environmentally detected ARGs pose equal threats to human health and enables prioritization of surveillance and mitigation efforts.
Human accessibility refers to the potential for ARG transmission from environmental microbiota to bacteria in humans, which can be assessed by examining ARGs shared between human-associated and environmental habitats [82]. Built environments have been shown to share the most ARGs with human habitats (1,460 genes), followed by aquatic (1,223) and terrestrial (1,193) environments [82]. This indicator reflects the connectivity between environmental reservoirs and human pathogens.
Mobility potential assesses the likelihood of ARG transfer between bacterial cells, primarily through association with mobile genetic elements (MGEs) such as plasmids, transposons, and integrons [82] [31]. The association with plasmids is particularly significant as they facilitate ARG transfer at high rates across phylogenetically diverse bacterial species [31]. Methods for assessing mobility have advanced significantly, with metagenomic assembly now enabling the identification of ARG-carrying contigs (ACCs) that contain both resistance genes and MGE markers [83].
Pathogenicity indicates whether an ARG has been found in human or animal pathogens, creating the potential for direct treatment failure [82]. This parameter requires linking ARGs to their bacterial hosts, which can be achieved through metagenome-assembled genomes (MAGs) or analysis of co-localization patterns on contigs [82] [83].
Clinical relevance considers the current clinical use of antibiotics affected by the ARG, acknowledging that resistance to currently deployed therapeutics poses more immediate threats than resistance to obsolete antibiotics [82]. This indicator connects environmental findings to practical clinical implications.
Quantitative Risk Ranking Frameworks
Operationalizing these risk indicators requires translation into practical ranking systems. A study on wastewater resistomes introduced a hierarchical classification framework that prioritizes ARGs based on their mobility potential percentage (M%), host pathogenicity, and annotation category [83]. This framework defines five risk levels, with Level 1 representing the highest priority threats:
Table 1: ARG Risk Ranking Framework Based on Genetic Context and Host Pathogenicity
| Risk Level | Mobility Potential (M%) | Host Pathogenicity | Annotation Category | Public Health Implication |
|---|---|---|---|---|
| 1 | ≥95% | Pathogenic | Perfect | Current dissemination threat |
| 2 | ≥95% | Pathogenic | Strict | Current dissemination threat |
| 3 | ≥95% | Pathogenic | Loose | Emerging threat |
| 4 | ≥95% | Non-pathogenic | Any | Emerging threat |
| 5 | <95% | Any | Any | Lower risk |
Application of this framework to wastewater treatment plants revealed that among 648 non-redundant ARGs detected, 25% were co-located with MGEs on the same contig, comprising the "pan mobile resistome." Of these, 50 highly mobilized ARGs (M% ≥ 95%) were classified into the four highest risk levels, with 39 ARGs assigned to Levels 1 and 2, representing immediate threats requiring monitoring in downstream environments [83].
Another comprehensive analysis of 4,572 metagenomic samples across six habitat types identified 2,561 ARGs conferring resistance to 24 classes of antibiotics [82]. Quantitative evaluation revealed that only 23.78% of these ARGs posed a health risk, with multidrug resistance genes being disproportionately represented among high-risk ARGs [82]. This demonstrates the importance of risk prioritization, as the majority of environmentally detected ARGs may not present immediate threats to human health.
Methodological Approaches for Risk Assessment
Molecular Detection and Quantification Methods
The selection of appropriate methodologies is critical for accurate risk assessment. Current approaches span a spectrum from targeted detection to comprehensive profiling, each with distinct advantages and limitations for risk assessment applications.
Table 2: Methodological Approaches for ARG Detection and Risk Assessment
| Method | Detection Limit | Risk Assessment Application | Advantages | Limitations |
|---|---|---|---|---|
| PCR/qPCR | 1 gene copy per 10^5-10^7 genomes [31] | Targeted detection of known high-risk ARGs | High sensitivity, quantitative, cost-effective [84] | Limited to predefined targets, no context information [31] |
| HT-qPCR | Similar to PCR [25] | Profiling of predefined ARG panels | High throughput, absolute quantification possible [25] | Limited to known targets, primer-dependent bias [25] |
| Metagenomics (short-read) | ~1 gene copy per 10^3 genomes [31] | Comprehensive resistome profiling | Untargeted, detects novel genes, provides context [84] | Lower sensitivity, computational complexity [84] |
| Metagenomic Assembly | Varies with sequencing depth | Reconstruction of ARG genetic context | Enables mobility assessment via contig analysis [83] | Requires deep sequencing (>60 Gbp for WWTPs) [83] |
| Long-read Sequencing | Similar to short-read | Complete ARG context reconstruction | Resolves complex genomic regions [81] | Higher cost, lower throughput [81] |
For quantitative risk assessment, absolute quantification approaches provide significant advantages. HT-qPCR enables calculation of gene copy numbers using the formula: Gene copy number = 10^((31-Ct)/(10/3)) [25]. Absolute abundance can then be determined by multiplying the relative abundance (ratio of ARG copy number to 16S rRNA gene copy number) by the absolute 16S rRNA gene copies [25]. This absolute quantification is fundamental for comparative risk evaluation across samples and environments.
Metagenomic approaches have evolved to better capture risk-related features. The comprehensive risk index calculation developed by Zhang et al. integrates the relative abundance of total ARG-carrying contigs (ACCs) with those coexisting with MGEs and pathogen-like sequences to generate a single resistome risk index for a metagenomic sample [83]. This enables direct comparison of risk levels across different environments and time points.
Experimental Workflows for Genetic Context Analysis
Determining the genetic context of ARGs is essential for assessing their mobility potential and host association. The following workflow illustrates a standardized pipeline for genetic context analysis from metagenomic samples:
Figure 1: Genetic Context Analysis Workflow. This pipeline enables the assessment of ARG mobility potential and host pathogenicity through metagenomic assembly and contig analysis.
The critical steps in this workflow include:
Deep Metagenomic Sequencing: Adequate sequencing depth is essential for ARG context reconstruction, with recommendations of at least 60 Gbp for wastewater treatment plant samples to achieve comprehensive resistome profiling [83].
Contig Assembly and Annotation: Assembly of short reads into longer contiguous sequences enables analysis of genetic context. Contigs should be annotated for open reading frames (ORFs) using tools like Prokka or similar pipelines [83].
ARG-Carrying Contig (ACC) Identification: ARGs are identified using reference databases (CARD, ResFinder) and their carrying contigs are analyzed for co-localized elements [83]. The mobility potential percentage (M%) is calculated as the ratio of ACCs containing MGEs to total ACCs [83].
Host Pathogenicity Assessment: Metagenome-assembled genomes (MAGs) are reconstructed with quality thresholds (typically >70% completeness, <10% contamination), and their pathogenic potential is assessed using databases of known pathogens [82] [83].
This integrated approach enables the identification of high-risk ARG-MGE combinations that represent the greatest threats for dissemination to pathogens.
Table 3: Essential Research Reagents and Databases for ARG Risk Assessment
| Category | Specific Tools/Reagents | Application in Risk Assessment | Key Features |
|---|---|---|---|
| Reference Databases | CARD [82], ResFinder [85], ARG-OAP [85] | ARG annotation and classification | Curated collections of known ARGs with resistance mechanisms |
| MGE Databases | ISFinder [85], PlasmidFinder, Integrall | Mobile element identification | Catalog of insertion sequences, plasmids, and integrons |
| Pathogen Databases | PATRIC, Virulence Factor Database | Host pathogenicity assessment | Collections of pathogenic bacteria and virulence factors |
| Bioinformatics Tools | fARGene [85], RGI [83], DIAMOND [85] | Novel ARG prediction and annotation | Hidden Markov model-based prediction and rapid sequence alignment |
| Assembly & Binning Tools | MEGAHIT, metaSPAdes, MaxBin | MAG reconstruction from metagenomes | Algorithms for assembling contigs and binning into genomes |
| Quantification Standards | 16S rRNA gene standards [25], spike-in controls [81] | Absolute quantification | Reference materials for normalizing and quantifying gene abundance |
Advanced Concepts and Emerging Challenges
The Latent Resistome: Unexplored Reservoirs of ARGs
Recent research has revealed that established databases capture only a fraction of the environmental resistome. Berglund et al. (2023) demonstrated that latent ARGs—those not present in current resistance gene repositories—are more abundant and diverse than established ARGs across all environments, including human- and animal-associated microbiomes [85]. Analysis of over 10,000 metagenomic samples showed that pan-resistomes (all ARGs in an environment) are heavily dominated by latent ARGs, while core-resistomes (commonly encountered ARGs) comprise both latent and established ARGs [85].
This latent reservoir represents a significant challenge for risk assessment, as these genes constitute a diverse pool from which new resistance determinants can be recruited to pathogens. Importantly, several latent ARGs have been identified in human pathogens and are located on mobile genetic elements, suggesting they may constitute emerging threats [85]. Wastewater microbiomes were identified as particularly concerning, exhibiting surprisingly large pan- and core-resistomes that create high-risk environments for mobilization and promotion of latent ARGs [85].
Integration into Quantitative Microbial Risk Assessment (QMRA)
The integration of ARG mobility data into formal Quantitative Microbial Risk Assessment (QMRA) frameworks represents the cutting edge of environmental AMR risk assessment [31]. QMRA traditionally includes hazard identification, exposure assessment, dose-response analysis, and risk characterization [31]. For ARGs, this framework must be adapted to account for:
- Transfer probabilities between environmental reservoirs and human pathogens
- Dose-response relationships for colonization and infection with resistant bacteria
- Modification of treatment efficacy due to acquired resistance
A key advancement is the recognition that in environmental surveillance, ARG mobility may be a more relevant indicator than ARG-host associations for prioritization [31]. While ARG-host associations provide immediate risk information in clinical settings, environmental ARGs may undergo multiple host transitions before reaching pathogenic hosts capable of infecting humans [31]. Thus, mobility potential serves as a proxy for future dissemination potential in complex environmental systems.
Methodological Gaps and Future Directions
Current risk assessment frameworks face several methodological limitations that require further development:
- Overestimation of risk based on worst-case historical contexts rather than actual genetic contexts in environmental samples [31]
- Incomplete representation of the full resistome due to database biases toward previously characterized genes [85]
- Technical variability in metagenomic approaches that complicates inter-study comparisons [81]
- Limited sensitivity for detecting rare but high-risk ARG variants in complex communities [31]
Addressing these limitations will require standardized protocols for metagenomic analysis, including universal quantification units (e.g., ARG copy per cell), absolute quantification methods, and environmental reference samples to control for technical variability [81]. Additionally, the development of multi-tiered surveillance systems that combine highly sensitive screening methods with high-information contextual analysis represents a promising direction for balancing practical constraints with informational needs [31].
Effective risk assessment of environmental ARGs requires integrated frameworks that move beyond simple quantification to evaluate the potential for human health impact. The combination of mobility potential, host pathogenicity, and clinical relevance provides a robust foundation for prioritizing environmental resistance threats. Methodological advances in metagenomic assembly, genetic context analysis, and quantitative risk indexing now enable researchers to translate complex environmental data into actionable risk rankings.
As surveillance efforts expand, attention to standardized methodologies, absolute quantification, and consideration of both established and latent resistomes will be essential for accurate risk assessment across the One Health spectrum. The frameworks outlined in this technical guide provide a roadmap for researchers, public health officials, and environmental managers to identify and mitigate the most pressing threats in the environmental resistome.
Antimicrobial resistance (AMR) presents a critical global health challenge, largely driven by the dissemination of antibiotic resistance genes (ARGs) across interconnected reservoirs. This technical review employs a One Health framework to conduct a comparative analysis of resistome profiles—the comprehensive collection of ARGs in a given environment—across livestock, soil, water, and human microbiomes. Global surveillance data reveals that tetracycline resistance genes are predominant in livestock gastrointestinal tracts, with tet(W)_1 occurring in 99% of samples [86]. Meanwhile, soil serves as both a historic reservoir and a evolving sink for clinically relevant ARGs, with recent studies showing a significant increase in the abundance and connectivity of high-risk ARGs in soil environments connected to human clinical resistance [87]. The mobility of ARGs through horizontal gene transfer, facilitated by mobile genetic elements, creates a dynamic network of resistance exchange that complicates mitigation efforts. This analysis synthesizes current methodologies for resistome characterization, quantitative findings across reservoirs, and emerging strategies for incorporating mobility assessment into environmental surveillance and risk assessment frameworks to inform evidence-based interventions across One Health sectors.
The antibiotic resistome encompasses all known ARGs, their precursors, and potential resistance mechanisms within microbial communities [9]. This concept has fundamentally shifted our understanding of AMR from a purely clinical concern to an ecological challenge that spans humans, animals, and environmental compartments. Under the One Health approach, which recognizes the interconnectedness of these domains, the resistome is understood as a dynamic network wherein genes circulate among diverse bacterial populations and environments [9] [87].
The environmental dimension of AMR has gained increasing recognition as studies reveal that many ARGs identified in human pathogens originated in environmental bacteria [9] [1]. Soil, for instance, represents a vast reservoir of ancient and diverse ARGs, with resistance determinants found in 30,000-year-old permafrost deposits [88] [1]. However, anthropogenic activities—particularly antibiotic use in human medicine and agriculture—have dramatically altered the natural equilibrium of ARG abundance and distribution [86] [87]. Agricultural and soil environments serve as critical ARG reservoirs, "operating as a link between different ecosystems and enabling the mixing and dissemination of resistance genes" [86].
This review systematically compares resistome profiles across major One Health compartments, examining the quantitative abundance and diversity of ARGs, their mobility potential, and the methodological approaches for characterizing resistome transmission pathways. Understanding these complex interactions is crucial for developing targeted strategies to mitigate the spread of high-risk ARGs across ecological boundaries.
Comparative Resistome Profiles Across One Health Compartments
Livestock Resistomes
Livestock gastrointestinal tracts represent significant reservoirs of ARGs, shaped by decades of antibiotic use in animal agriculture. A global metagenomic analysis of over 5,800 samples revealed widespread and diverse ARGs in livestock microbiomes [86]. The study identified 235 different resistance genes in poultry, 101 in ruminants, and 167 in swine gastrointestinal tracts [86].
Table 1: Prevalence of Key Tetracycline Resistance Genes in Livestock GI Tracts [86]
| ARG | Function | Prevalence in Livestock | Expression Confirmed |
|---|---|---|---|
| tet(W)_1 | Ribosomal protection | 99% | Yes |
| tet(Q)_1 | Ribosomal protection | 93% | Yes |
| tet(O)_1 | Ribosomal protection | 82% | Yes |
| tet(44)_1 | Ribosomal protection | 69% | Yes |
| tet(40)_1 | Efflux pump | Not specified | Expressed in all livestock microbiomes |
Tetracycline resistance genes dominated livestock resistomes, with metatranscriptomic analysis confirming these genes are functionally expressed [86]. The high prevalence correlates with the extensive use of tetracyclines in animal agriculture, creating persistent selective pressure for maintenance and dissemination of these resistance determinants.
Beyond gastrointestinal tracts, livestock-associated environments also harbor diverse resistomes. Raw milk serves as both a carrier and reservoir of ARGs, with one study identifying 31 distinct resistance alleles in raw milk samples from Northwest Xinjiang, reaching abundances as high as 3.70 × 10⁵ copies per gram [29]. The predominant ARGs in raw milk conferred resistance to beta-lactams, tetracyclines, aminoglycosides, and chloramphenicol derivatives [29] [89].
Soil and Water Resistomes
Soil represents a foundational reservoir in the environmental resistome, hosting ancient and diverse ARGs while simultaneously accumulating clinically relevant resistance determinants from anthropogenic sources.
Table 2: Comparative ARG Abundance and Diversity Across Reservoirs
| Compartment | Total ARG Abundance | Diversity (Number of ARG Subtypes) | Dominant ARG Types | Key Drivers |
|---|---|---|---|---|
| Arctic Soils (pristine) | 17.7 ± 5.1 ppm [88] | Lower diversity [88] | Multidrug efflux pumps [87] | Natural microbial community [88] |
| Agricultural Soils | Significantly higher than pristine [88] | Higher diversity [88] | Tetracycline, macrolide [86] | Manure application, antibiotic exposure [86] |
| Livestock Feces | 5.1 × 10³ ppm (pig feces) [88] | 167-235 subtypes [86] | Tetracycline [86] | Antibiotic use, intensive farming [86] |
| River Systems | Varies with anthropogenic impact [9] | Increases downstream [9] | Sulfonamide, tetracycline [9] | WWTP effluent, agricultural runoff [9] |
Global soil analysis reveals a concerning trend of increasing connectivity between soil and human resistomes. A 2025 study examining 3,965 metagenomic datasets found that soil ARG risk has significantly increased over time (2008-2021), with soil sharing 50.9% of its high-risk Rank I ARGs with other habitats, particularly human feces (75.4%), chicken feces (68.3%), and swine feces (53.9%) [87]. This demonstrates soil's role as both sink and source for clinically relevant ARGs.
In aquatic environments, rivers serve as critical dissemination routes for ARGs, with studies showing dramatic increases in ARG abundance and diversity downstream from wastewater treatment plants (WWTPs) and agricultural runoff sites [9]. The river resistome is particularly concerning due to its role as a source for drinking water and agricultural irrigation, creating potential pathways for re-introduction of environmental ARGs into human populations [9].
Human Resistome and Clinical Connections
The human resistome is intrinsically linked to environmental and agricultural reservoirs through multiple exposure pathways. Humans are exposed to environmental ARGs through direct inhalation, ingestion, or contact with contaminated air, food, or water [90]. Quantitative risk assessment frameworks have been developed to calculate ARG intake, incorporating permeability coefficients for different exposure routes [90].
Analysis of clinical E. coli genomes (1985-2023) reveals increasing genetic overlap with soil resistomes over time, suggesting strengthening connections between environmental and human compartments [87]. Significant correlations have been identified between soil ARG risk, potential horizontal gene transfer events, and clinical antibiotic resistance (R² = 0.40-0.89, p < 0.001) [87].
The mobility of ARGs between environmental and human-associated bacteria represents a critical risk factor. A comparison of 45 million genome pairs suggests that cross-habitat horizontal gene transfer is crucial for the connectivity of ARGs between humans and soil [87]. This genetic exchange is facilitated by mobile genetic elements (MGEs) such as plasmids, transposons, and integrons that can transfer ARGs across phylogenetic boundaries [91] [31].
Methodological Approaches for Resistome Analysis
Sampling and DNA Extraction Protocols
Standardized methodologies are essential for robust comparative resistome analysis across different compartments:
Livestock GI Tract Sampling: Fecal samples collected aseptically, immediately frozen on dry ice, and stored at -80°C until DNA extraction [86]. DNA extraction typically uses commercial kits (e.g., FastDNA SPIN Kit) with bead-beating for cell lysis [86].
Soil Sampling: Top 5-cm soil collected from multiple positions at each site, mixed thoroughly, and stored in sterilized containers at -80°C [88]. DNA extraction often employs modified CTAB protocols with lysozyme and protease K treatment for efficient lysis [88].
Raw Milk Sampling: Aseptic collection from bulk storage tanks, flash-freezing within 15 minutes of collection, and maintenance of continuous cryogenic conditions (-20°C) during transport [29] [89].
Water Sampling: Filtration through sterile membranes (0.22 μm) to capture biomass, with membranes then processed for DNA extraction using commercial water DNA isolation kits [9].
ARG Detection and Quantification Methods
High-Throughput Quantitative PCR (HT-qPCR): Enables simultaneous quantification of hundreds of ARG targets using WaferGen SmartChip or similar systems. Typically employs 330+ primer pairs targeting major ARG classes alongside MGEs and 16S rRNA genes for normalization [29] [89]. Detection limit: ~1 gene copy per 10⁵-10⁷ genomes [31].
Metagenomic Sequencing: Provides comprehensive resistome profiling without primer bias. Involves whole-genome shotgun sequencing on Illumina platforms (NovaSeq6000) followed by bioinformatic analysis using tools like ARGs-OAP for annotation [86] [87]. Detection limit: ~1 gene copy per 10³ genomes [31].
Metatranscriptomics: Confirms functional activity of detected ARGs through RNA sequencing rather than DNA-based detection [86].
Figure 1: Experimental Workflow for Resistome Analysis
Bioinformatic Analysis Pipelines
Quality Control: Tools like FLASH (v1.2.7) for merging paired-end reads, followed by filtering of adapters, low-quality sequences, and chimeras [29].
ARG Annotation: Reference databases including SARG3.0, CARD, and ResFinder for comprehensive ARG identification [86] [87]. For risk assessment, Rank I ARGs are identified based on host pathogenicity, gene mobility, and human-associated enrichment [87].
Mobility Assessment: Contig-based analysis to identify ARG associations with MGEs (plasmids, transposons, integrons) [31]. Tools include mlplasmids, MOB-suite, and TnAble [31].
Source Tracking: Fast expectation-maximization for microbial source tracking (FEAST) to quantify ARG sharing between habitats [87].
Statistical Analysis: Multivariate methods including Procrustes analysis, network analysis, and Variance Partitioning Analysis (VPA) to identify drivers of ARG distribution [29] [89].
The Scientist's Toolkit: Essential Research Reagents and Materials
Table 3: Essential Research Reagents for Resistome Analysis
| Category | Specific Items | Function/Application | Examples from Literature |
|---|---|---|---|
| Sampling & Storage | Sterile containers, dry ice, cryogenic storage tubes | Sample integrity preservation during collection and transport | Flash-freezing on dry ice within 15min of collection [29] |
| DNA Extraction | FastDNA SPIN Kit, CTAB reagents, lysozyme, protease K | High-quality DNA extraction from complex matrices | Modified CTAB protocol for liquid substrates [29] [89] |
| Quality Assessment | NanoDrop spectrophotometer, agarose gels, Qubit fluorometer | DNA quality/quantity verification before downstream analysis | A260/A280 >1.8 requirement [29] |
| qPCR Reagents | WaferGen SmartChip, SYBR Green master mixes, 348 primer pairs | High-throughput ARG quantification | 330 ARG targets + 17 MGEs + 16S rRNA [29] |
| Sequencing | Illumina NovaSeq6000, TruSeq DNA PCR-Free Kit | Library preparation and metagenomic sequencing | Paired-end sequencing (2×150bp) [86] [29] |
| Bioinformatic Tools | FLASH, Uparse, ARGs-OAP, FEAST | Data processing and analysis | ARGs-OAP (v3.2.2) for annotation [87] |
ARG Mobility and Risk Assessment Framework
The mobility of ARGs through horizontal gene transfer represents a critical factor in environmental risk assessment [31]. Current frameworks prioritize ARGs based on four key indicators: (1) Circulation between One Health settings; (2) Mobility potential via association with MGEs; (3) Pathogenicity of host bacteria; and (4) Clinical relevance based on treatment failure associations [31].
Rank I ARGs—those identified as highest risk—demonstrate increasing prevalence in soil environments over time, with significant correlations to clinical resistance patterns [87]. The abundance of these high-risk ARGs has shown a significant temporal increase (r = 0.89, p < 0.001), in contrast to total ARG abundance which remains time-independent [87].
Figure 2: ARG Transmission Pathway from Environment to Clinic
Advanced surveillance approaches now aim to integrate ARG mobility quantification into risk assessment models [31]. Methodological innovations include:
- Long-read sequencing (Oxford Nanopore, PacBio) for improved assembly of MGEs carrying ARGs [31]
- Exogenous plasmid capture methods to directly isolate mobile genetic elements [31]
- EpicPCR (emulsion, paired-isolation, and concatenation PCR) for linking ARGs to their bacterial hosts [31]
- Network analysis identifying co-occurrence patterns between ARGs and specific bacterial taxa [29]
Comparative resistome analysis reveals a deeply interconnected network of ARG exchange among livestock, soil, water, and human compartments. The tetracycline resistance genes that dominate livestock microbiomes, the increasing risk profile of soil resistomes, and the aquatic pathways that disseminate ARGs collectively contribute to the circulation of resistance determinants across One Health sectors.
Critical research gaps remain in understanding the selective pressures affecting ARG emergence and transmission, elucidating mechanisms that allow ARGs to overcome taxonomic barriers, and quantifying the actual transmission rates at interface zones [9]. Future surveillance strategies should prioritize integrating ARG mobility assessment into standardized monitoring frameworks and developing quantitative models that connect environmental ARG abundance with clinical resistance outcomes [31].
The complex dynamics of resistome transmission across ecological compartments underscore the necessity of coordinated global action under the One Health framework. Without integrated mitigation strategies that address ARG dissemination across all interconnected reservoirs, the effectiveness of clinical interventions alone will remain limited in confronting the escalating antimicrobial resistance crisis.
Validating ARG Mobility and Transfer Potential in Complex Communities
Antibiotic resistance genes (ARGs) represent a critical global health challenge, undermining the efficacy of antibiotics in human and veterinary medicine [29]. While ARG prevalence in environmental resistomes has been extensively documented, contemporary research emphasizes that mobility potential, rather than mere abundance, serves as the primary determinant of epidemiological risk [31]. Antimicrobial resistance (AMR) driven by ARGs poses multidimensional threats to public health, environmental safety, and food security [29]. The environment provides an immense gene pool from which numerous ARGs can be acquired by pathogens through horizontal gene transfer (HGT) [4]. Current environmental surveillance often overlooks the significance of ARG mobility, limiting risk assessment accuracy [31]. This technical guide provides comprehensive methodologies for validating ARG mobility and transfer potential within complex microbial communities, addressing a crucial knowledge gap in environmental AMR research.
The dissemination of ARGs in environmental compartments differs fundamentally from antibiotic persistence. While antibiotics exert selective pressure by inhibiting susceptible bacteria, ARGs spread independently via HGT mechanisms—conjugation (plasmid transfer), transduction (phage-mediated transfer), and transformation (free DNA uptake) [29]. Mobile genetic elements (MGEs), including plasmids, transposons, integrons, and insertion sequences, play a central role in facilitating horizontal genetic exchange and therefore promote the acquisition and spread of resistance genes [92]. Understanding ARG mobility offers a tractable and pragmatic entry point for identifying high-risk scenarios and moving from unpredictable toward more predictable environmental AMR dynamics [31].
Methodological Framework: Assessing ARG Mobility Potential
Current AMR Surveillance Toolbox: Capabilities and Limitations
Quantitatively evaluating ARG mobility and its subsequent integration into quantitative microbial risk assessment (QMRA) has been a challenge to date [31]. The main environmental AMR surveillance methods currently applied have various limitations when it comes to capturing the mobility potential of ARGs:
- qPCR techniques have high sensitivity (detection limits around 1 gene copy per 10^5 to 10^7 genomes) but do not allow characterization of ARG sequences or their associations with MGEs and bacterial hosts, and are limited to individual targets [31].
- Metagenomic approaches can detect numerous ARGs and MGEs but have limited sensitivity (detection limits around 1 gene copy per 10^3 genomes) and generally focus on simple correlation analysis between ARGs and MGEs, providing limited insights into ARG mobility potential [31].
- Specialized methods like exogenous plasmid capture, inverse PCR, or epicPCR suffer from very low throughput and nontrivial analyst training requirements, making them incompatible with broad-based surveillance [31].
Table 1: Comparison of Major Methodological Approaches for ARG Mobility Assessment
| Method | Throughput | Sensitivity | Mobility Information | Implementation Complexity |
|---|---|---|---|---|
| qPCR | High | High (1 copy/10^5-10^7 genomes) | None | Low |
| Metagenomics | Medium | Low (1 copy/10^3 genomes) | Correlation-based | Medium |
| Long-read sequencing | Low | Medium | Direct contextual evidence | High |
| Exogenous plasmid capture | Very low | Variable | Functional validation | Very high |
| Inverse PCR | Very low | High | Specific association | High |
| epicPCR | Low | High | Host association | High |
Methodological Advances for Quantifying ARG Mobility
Recent advances in molecular techniques and bioinformatic tools have significantly enhanced our ability to characterize ARG mobility in complex environments:
- Long-read sequencing technologies enable complete assembly of MGEs, allowing direct observation of ARG genetic context and association with plasmids, transposons, and other MGEs [31].
- Improved bioinformatic pipelines now allow contig-based analysis and more accurate identification of ARG-MGE associations through specialized databases and algorithms [31].
- PCR-based genotype association assays provide targeted assessment of specific ARG-MGE linkages with higher throughput than traditional methods [31].
- Metagenome-assembled genomes (MAGs) permit the identification of bacterial hosts carrying ARGs and their associated MGEs, offering insights into potential transmission pathways [4].
These novel approaches are reaching the quantitative and qualitative information necessary to characterize ARGs and their observable mobility at the level required for efficient integration into QMRAs [31]. A study of global wastewater treatment plants demonstrated that 57% of 1,112 recovered high-quality genomes possessed putatively mobile ARGs, and ARG abundance positively correlated with the presence of MGEs [4].
Workflow for Comprehensive ARG Mobility Analysis
Key Experimental Protocols for Mobility Validation
Integrated Metagenomic Framework for ARG-MGE Association
This protocol provides a standardized workflow for assessing ARG mobility potential in complex environmental samples, combining molecular and computational approaches:
Sample Collection and Processing:
- Collect environmental samples (e.g., activated sludge, soil, raw milk) using sterile techniques to prevent cross-contamination [4] [29].
- For liquid samples, concentrate microbial biomass via centrifugation (8,000 × g for 10 min at 4°C).
- Extract genomic DNA using modified CTAB protocol optimized for environmental samples, with verification of DNA purity (A260/A280 >1.8) [29].
- Include blank controls (sterile water) and environmental controls treated in parallel to monitor contamination.
Library Preparation and Sequencing:
- For short-read sequencing: Fragment DNA to 350-500 bp, then prepare libraries using Illumina-compatible kits [4].
- For long-read sequencing: Use high-molecular-weight DNA without fragmentation for Oxford Nanopore or PacBio libraries [31].
- Employ dual sequencing approaches where resources allow, enabling hybrid assembly for improved contiguity.
Bioinformatic Analysis:
- Quality filter raw reads using Trimmomatic or similar tools (parameters: LEADING:20, TRAILING:20, SLIDINGWINDOW:4:20, MINLEN:50).
- Perform hybrid assembly using metaSPAdes or Unicycler with default parameters.
- Predict open reading frames (ORFs) using Prodigal with meta-mode enabled.
- Annotate ARGs using ABRicate against CARD, ARDB, or ResFinder databases with 80% identity and 80% coverage thresholds [4].
- Identify MGEs using MobileElementFinder, ISfinder, and integron databases [31] [92].
- Reconstruct metagenome-assembled genomes (MAGs) using MetaBAT2, CheckM for quality assessment (completeness >70%, contamination <10%).
- Determine ARG-MGE associations through proximity analysis (genes located within 10 kb on same contig) and cluster analysis [4].
Exogenous Plasmid Capture for Functional Validation
This protocol enables experimental validation of conjugative potential from environmental samples:
Sample Preparation and Donor Selection:
- Prepare environmental sample suspensions in phosphate-buffered saline (PBS).
- Select appropriate recipient strains (e.g., rifampicin-resistant Escherichia coli or Pseudomonas putida).
- Use selective media with antibiotics targeting the ARG of interest and counterselective agents against donor strains.
Mating Assay Procedure:
- Mix donor and recipient cells at equal ratios (typically 1:1) with total cell density ~10^9 CFU/mL.
- Incubate mating mixture on filters placed on non-selective media for 16-24 hours at optimal growth temperature.
- Resuspend cells and plate on selective media to enumerate transconjugants.
- Calculate conjugation frequency as number of transconjugants per recipient cell.
- Include controls: donors and recipients alone on selective media to verify counterselection.
Transconjugant Analysis:
- Confirm plasmid acquisition in transconjugants via PCR and S1-PFGE.
- Test for maintenance and stability of acquired plasmids through serial passage.
- Sequence plasmids from transconjugants to compare with environmental metagenomic assemblies.
Table 2: Quantitative Metrics for ARG Mobility Risk Assessment
| Risk Indicator | Measurement Approach | Threshold Values | Interpretation |
|---|---|---|---|
| MGE Association Frequency | Proportion of ARG-contigs containing MGEs | High risk: >50% Moderate: 20-50% Low: <20% | Direct measure of mobilization potential |
| Plasmid Association | ARG localization on plasmid sequences | High risk: Plasmid-borne Low risk: Chromosomal | Conjugation potential |
| ARG-MGE Co-occurrence | Network analysis of ARG-MGE correlations | Significant: Spearman's ρ > 0.6, p < 0.01 | Indirect evidence of mobility |
| Conjugation Frequency | Exogenous plasmid capture assays | High: >10^-4 Transconjugants/recipient Moderate: 10^-4-10^-6 Low: <10^-6 | Functional validation of transfer |
| Host Range | Diversity of bacterial taxa carrying ARG-MGE unit | Broad: Multiple bacterial classes Narrow: Single taxon | Dissemination potential across pathogens |
Table 3: Essential Research Reagents and Computational Tools for ARG Mobility Studies
| Category | Specific Tools/Reagents | Application | Key Features |
|---|---|---|---|
| Molecular Biology Kits | FastDNA SPIN Kit for Soil | DNA extraction from complex matrices | Optimized for environmental samples with inhibitors |
| TruSeq DNA PCR-Free Library Prep Kit | Sequencing library preparation | Minimizes amplification bias | |
| Reference Databases | CARD, ResFinder | ARG annotation | Curated collections of resistance determinants |
| ISfinder, INTEGRALL | MGE identification | Comprehensive mobile element databases | |
| PlasmidFinder | Plasmid replication typing | Identification of plasmid incompatibility groups | |
| Bioinformatic Tools | metaSPAdes, Unicycler | Metagenomic assembly | Handles complex community sequencing data |
| ABRicate, DeepARG | ARG screening | Rapid annotation of resistance genes | |
| MobileElementFinder | MGE detection | Comprehensive mobile genetic element annotation | |
| CheckM, GTDB-Tk | Genome quality and taxonomy | Assessment of MAG quality and classification | |
| Experimental Materials | Rifampicin-resistant E. coli strains | Recipient cells in mating assays | Counterselection in conjugation experiments |
| Membrane filters (0.22 μm) | Solid support for bacterial conjugation | Facilitates cell-to-cell contact |
MGE-Mediated ARG Transfer Mechanisms
Data Interpretation and Integration into Risk Assessment Frameworks
From Mobility Data to Risk Prioritization
Interpreting ARG mobility data requires integration of multiple lines of evidence to assign meaningful risk rankings. Zhang et al. proposed four key indicators to rank individual ARGs: a) Circulation: Is the ARG shared between different One Health settings and does it seem increased in abundances due to human activities?; b) Mobility: Has the ARG been reported as encoded on a mobile genetic element that increases its likelihood of transfer to a pathogen? c) Pathogenicity: Has the ARG been found in human or animal pathogens?; d) Clinical relevance: Has the ARG been related to worsened treatment outcome? [31]. These factors are reasonably easy to assess with currently available databases, allowing assignment of risk ranks to individual ARGs [31].
A crucial limitation of conventional AMR risk analysis is that it does not take the genetic and bacterial host context of the ARGs in the surveyed samples into account, but rather assesses risk based on worst-case historical genetic contexts [31]. This can result in overestimation of potential epidemiological AMR risk in certain environments, potentially leading to flawed prioritization and mitigation measure selection [31]. To determine realized quantitative risks, mobility and bacterial host information need to be integrated into quantitative microbial risk assessment (QMRA) or other modeling frameworks [31].
Contextual Factors Influencing Mobility Potential
Multiple environmental and biological factors influence ARG mobility potential in complex communities:
- Bacterial community composition: Resistome variations appear to be driven by a complex combination of stochastic processes and deterministic abiotic factors [4]. Studies of global wastewater treatment plants revealed that ARG composition strongly correlates with bacterial taxonomic composition, with Chloroflexi, Acidobacteria and Deltaproteobacteria being major ARG carriers [4].
- Environmental parameters: Factors such as temperature, pH, and nutrient availability can significantly impact conjugation frequencies and transposition rates [4].
- Antibiotic selective pressure: Subinhibitory antibiotic concentrations can promote horizontal gene transfer by increasing expression of conjugation machinery and stress response pathways [29].
- MGE compatibility: The host range of plasmids and other MGEs determines their ability to disseminate ARGs across taxonomic boundaries.
In wastewater treatment plants, which represent critical ARG reservoirs, a core set of 20 ARGs was present in all facilities surveyed globally, accounting for 83.8% of total ARG abundance [4]. The three most abundant ARGs were TetracyclineResistanceMFSEffluxPump (15.2%), ClassB (13.5%), and vanT gene in the vanG cluster (11.4%), which respectively confer Tetracycline, Beta-lactam, and Glycopeptide resistance [4]. Understanding these patterns and their mobility potential is essential for targeted intervention strategies.
Validating ARG mobility and transfer potential in complex communities requires integrated approaches that combine molecular detection, computational prediction, and functional validation. Recent methodological advances in detecting ARG mobility, relevant databases, and improved quantitative microbial risk assessment frameworks make the integration of ARG mobility into environmental AMR surveillance and risk assessment now feasible [31]. As resistome research continues to evolve, the field must move beyond simple ARG quantification toward contextual analysis that incorporates mobility potential, host associations, and transfer dynamics. This paradigm shift will enable more accurate risk assessment and targeted interventions to curb the spread of antimicrobial resistance through environmental pathways.
The relentless evolution of antibiotic resistance represents a critical threat to global public health, rendering life-saving treatments ineffective and causing millions of deaths annually. Traditional antibiotic development has operated in a reactive manner, optimizing compounds against resistance mechanisms that have already emerged in clinical settings. This approach has proven insufficient, with resistance often developing rapidly after a new drug's introduction. In recent years, a paradigm shift toward proactive drug design has gained traction, centered on exploiting the environmental resistome—the vast collection of all antibiotic resistance genes (ARGs) and their precursors in natural microbial communities—as an early warning system [1].
This approach is grounded in the understanding that many clinically relevant resistance genes, including those conferring resistance to beta-lactams, aminoglycosides, and glycopeptides, originated in environmental microbiomes long before they appeared in pathogens [93] [1]. Natural environments, particularly soil, are the site of ancient and ongoing antimicrobial warfare between microbes, resulting in an immense diversity of antibiotics and corresponding resistance mechanisms. By systematically mining this environmental resistome, researchers can identify resistance vulnerabilities for antibiotic candidates before they enter clinical use, enabling the proactive design of compounds that evade these anticipated threats [94]. This case study explores the implementation of this strategy using the antibiotic albicidin as a model, detailing the methodological framework, experimental findings, and implications for future antibiotic development.
The Albicidin Model: A Proof of Concept
Albicidin, a potent DNA gyrase inhibitor produced by the sugarcane pathogen Xanthomonas albilineans, served as an ideal candidate to validate the resistome-guided approach. As a novel antibiotic class with no history of clinical use, its most immediate resistance threats were expected to originate from environmental reservoirs rather than pre-adapted clinical strains [93]. The overall workflow, detailed in the diagram below, involved large-scale metagenomic screening to identify resistance genes, functional characterization of their mechanisms, and use of this information to guide the synthesis of optimized analogs.
Experimental Protocol: Identifying the Albicidin Resistome
Metagenomic Library Construction and Screening:
- Soil DNA Extraction: Microbial DNA was extracted from diverse natural soil microbiomes, compiling a total of approximately 3.5 terabase pairs (Tbp) of genetic material, equivalent to roughly 700,000 bacterial genomes [93] [94].
- Cosmid Library Construction: The extracted DNA was cloned into a cosmid vector with an average insert size of ~35 Kbp and hosted in Escherichia coli [93].
- Functional Selection: The entire library was plated on growth media containing albicidin at 4× its minimal inhibitory concentration (MIC) against the E. coli host. Resistant colonies were isolated for further analysis [93].
Gene Identification and Validation:
- Subcloning Pipeline: Cosmids from resistant clones were subjected to a rapid subcloning pipeline. DNA was fragmented into ~1-4 Kbp pieces, transformed into E. coli, and put through another round of albicidin selection to isolate the specific resistance-conferring sequences [93].
- Sequencing and Bioinformatic Analysis: Plasmids from resistant subclones were pooled and sequenced using Illumina technology. Resistance genes were identified as those with the highest read coverage in the original cosmid insert sequences [93].
Key Findings from Resistome Screening
The environmental screen identified a diverse array of albicidin resistance genes, revealing eight distinct resistance gene classes. The table below summarizes the identified gene classes, their frequencies, and their primary mechanisms of action (MOA).
Table 1: Albicidin Resistance Genes Identified from Environmental Metagenomic Screening
| Resistance Gene Class | Number of Variants Found | Primary Mechanism of Action | Average Fold Increase in MIC |
|---|---|---|---|
| AraC family proteins | 19 | Antibiotic sequestration | ≥16 |
| HlyD family transporters | 8 | Drug efflux | ≥16 |
| RecA recombinases | 6 | Cross-resistance (target-based) | ≤8 |
| Hydrolases | 4 | Antibiotic degradation | ≥16 |
| MerR family protein | 1 | Antibiotic sequestration | ≥16 |
| Pentapeptide repeat protein | 1 | Cross-resistance (target-based) | ≥16 |
| Glutathione S-transferase | 1 | Antibiotic sequestration | ≤8 |
| Monooxygenase | 1 | Antibiotic modification | ≤8 |
This diversity was striking, as only four of these resistance classes (AraC, hydrolases, MerR, and pentapeptide repeat protein) had been previously identified in cultured bacteria [93]. The screen successfully uncovered novel and unusual resistance mechanisms that would have been missed by conventional screening methods.
Mechanism of Action Analysis: Representatives of each resistance class were analyzed to determine their biochemical MOA:
- Degradation/Modification: Cell extracts from clones expressing hydrolase or monooxygenase genes were depleted in albicidin and contained novel mass spectrometry (MS) features. Hydrolases produced cleavage products, while monooxygenases added a hydroxyl group to the albicidin molecule [93].
- Efflux: Clones with HlyD family transporters showed reduced intracellular albicidin and increased antibiotic levels in the media, consistent with active efflux [93].
- Sequestration: Clones encoding AraC, glutathione S-transferase, and MerR proteins retained more albicidin within the cell pellet, suggesting a binding and sequestration mechanism [93].
Quantitative Profiling and Resistome Risk Assessment
Methodological Advances for Quantitative Analysis
Translating environmental surveillance data into quantifiable risk requires moving beyond relative abundance measurements. Quantitative Microbiome Profiling (QMP) addresses this by combining amplicon sequencing with 16S rRNA qPCR to estimate absolute microbial cell counts, thereby correcting for variations in microbial load across samples [95]. This approach, when paired with absolute resistome profiling via high-throughput qPCR, provides robust data suitable for Quantitative Microbial Risk Assessment (QMRA), a framework essential for quantifying environmental ARG exposure and transmission risks [95].
The analysis of such quantitative data is further enhanced by using Hill numbers for diversity characterization. Unlike traditional indices like Shannon or Simpson, Hill numbers provide a unified framework that measures diversity in intuitive "effective numbers of species" and allows sensitivity to rare or abundant species to be tuned with a single parameter [95].
Global Resistome Distribution and Habitat Connectivity
Large-scale benchmarking analyses of global resistomes reveal distinct patterns of ARG distribution across habitats, which is critical for understanding transmission risks. One comprehensive analysis of 1,723 metagenomic datasets from 13 different habitats—including livestock feces, human feces, wastewater, and natural environments—provided a quantitative overview of this distribution [96].
Table 2: Global Resistome Profile Across Major Habitats (Based on 1,723 Metagenomes)
| Habitat Category | Key ARG Families Identified | Noteworthy Characteristics |
|---|---|---|
| Pharmaceutical Pollution | Sulphonamides, Aminoglycosides, Quinolones, Beta-lactams | Exceptional abundance and diversity of ARGs, including last-resort antibiotics |
| Wastewater/Sludge | Multidrug, Glycopeptide, Beta-lactams | High abundance and diversity; on par with human gut resistome |
| Human Feces | Multidrug, Glycopeptide, Beta-lactams | High abundance but limited taxonomic diversity |
| Livestock Feces (Chicken, Swine, Cattle) | Sulfonamide, Tetracycline | High abundance, shaped by veterinary antibiotic use |
| Natural Soil & Water | Varied, but generally low | High taxonomic diversity but low abundance of known ARGs |
| Marine Water | Varied, but generally low | Low abundance and diversity of known ARGs |
| Air (Beijing Smog) | Carbapenems (including OXA-types), Multidrug | High richness of ARGs, including last-resort types |
Key findings from this benchmarking include:
- Wastewater and WWTPs were characterized as reservoirs of more diverse ARG genotypes than any other habitat, including human and livestock feces [96].
- Fecal samples, while highly abundant in ARGs, showed lower ARG diversity than wastewater [96].
- Airborne resistomes, particularly in smog, can carry a high richness of ARGs, including genes conferring resistance to last-resort carbapenems [72].
- Bacterial taxonomy composition was significantly correlated with resistome composition across most habitats, indicating the importance of host-microbe relationships in resistance dissemination [96].
The Scientist's Toolkit: Essential Reagents and Methods
The implementation of a resistome-guided development pipeline relies on a specific set of reagents, tools, and methodologies. The following table outlines key components of the research toolkit as applied in the albicidin case study and related environmental resistome work.
Table 3: Research Reagent Solutions for Resistome-Guided Antibiotic Development
| Tool/Reagent | Function/Application |
|---|---|
| Cosmid Vectors (e.g., pCC1FOS) | Construction of large-insert metagenomic libraries for functional screening [93]. |
| Illumina Sequencing Platforms | High-throughput sequencing for resistance gene identification and metagenomic profiling [93] [72]. |
| High-Throughput qPCR (WaferGen SmartChip) | Absolute quantification of hundreds of ARGs and mobile genetic elements (MGEs) in environmental samples [95] [29]. |
| 16S rRNA qPCR Primers (e.g., 1055f-1392r) | Estimation of absolute bacterial cell counts for Quantitative Microbiome Profiling (QMP) [95]. |
| SsoAdvanced Universal SYBR Green Supermix | Sensitive detection for qPCR-based quantification of 16S rRNA genes and ARGs [95]. |
| FastDNA SPIN Kit for Soil | Efficient DNA extraction from complex environmental matrices like soil and sludge [95] [29]. |
| Comprehensive Antibiotic Resistance Database (CARD) | Reference database for bioinformatic annotation of identified resistance genes [1]. |
The albicidin case study demonstrates a robust, broadly applicable pipeline for proactively addressing antibiotic resistance. By leveraging the environmental resistome as an early warning system, researchers can identify resistance vulnerabilities before clinical deployment and use this information to strategically design optimized antibiotic analogs. This approach, which directly couples metagenomic resistance surveillance to medicinal chemistry, represents a significant advance over traditional reactive development paradigms [93] [94].
Future work in this field should focus on several key areas:
- Integration of Mobility and Risk Assessment: Greater emphasis is needed on linking ARGs with their mobile genetic elements (MGEs) to better quantify dissemination potential and integrate this information into Quantitative Microbial Risk Assessment (QMRA) frameworks [31].
- Expanded Surveillance: Applying this platform to other promising antibiotic candidates in development will be crucial for building a more resilient arsenal against resistant pathogens.
- Methodological Standardization: Widespread adoption of quantitative profiling methods and unified diversity metrics, like Hill numbers, will improve the comparability and reliability of environmental resistome studies [95].
The integration of environmental resistome guidance into industrial drug development programs holds the promise of generating antibiotics that are more resilient to resistance, potentially extending their clinical lifespans and improving our ability to combat the ongoing antimicrobial resistance crisis [94].
Benchmarking Metagenomic Methods Against Traditional Culture-Based Techniques
The escalating global health crisis of antimicrobial resistance (AMR) necessitates robust surveillance strategies to monitor the prevalence and dissemination of antibiotic resistance genes (ARGs). The environmental resistome—the collection of all ARGs in a given environment—is now recognized as a significant reservoir for resistance determinants that can transfer to human pathogens. This dynamic underpins the critical "One Health" framework, which acknowledges the interconnectedness of human, animal, and environmental health [40] [97]. Accurately profiling this resistome is fundamental for risk assessment and intervention.
For decades, traditional culture-based techniques formed the cornerstone of AMR surveillance. However, the emergence of metagenomic sequencing, which allows for the untargeted analysis of genetic material directly from environmental samples, presents a paradigm shift. This technical guide provides an in-depth benchmarking of these two approaches within the context of environmental ARG research, detailing their methodologies, comparative performance, and appropriate applications for a scientific audience.
The core distinction between these methods lies in their approach: culture-based methods are targeted and dependent on microbial growth, while metagenomics is comprehensive and sequence-based.
Traditional Culture-Based Techniques
Culture-based methods involve isolating viable bacteria from a sample and determining their resistance profiles.
Experimental Protocol: A typical workflow for environmental sampling (e.g., wastewater) is as follows [98]:
- Sample Collection: Grab samples are collected from the environment (e.g., 50-500 mL of wastewater), transported on ice, and processed within hours.
- Isolation of Bacteria: Samples are filtered, and the biomass is cultivated on selective media containing antibiotics to isolate antibiotic-resistant bacteria (ARB).
- Phenotypic Characterization: Isolates are subjected to antimicrobial susceptibility testing (AST), such as disk diffusion or broth microdilution, to determine the minimum inhibitory concentration (MIC) and define resistance profiles.
- Genotypic Characterization (Downstream): DNA is extracted from purified isolates. Key resistance genes (e.g.,
blaCTX-Mfor ESBL,mecAfor methicillin resistance) are typically confirmed using polymerase chain reaction (PCR) and Sanger sequencing [97].
Limitations: This approach is biased towards the small fraction (typically <1%) of bacteria that can be cultivated in the laboratory [97]. It provides limited throughput and cannot detect novel or unexpected ARGs, offering an incomplete picture of the resistome.
Metagenomic Sequencing Techniques
Metagenomics bypasses cultivation to sequence all the DNA in a sample, allowing for a comprehensive profile of ARGs and their genomic context.
Experimental Protocol: A standardized workflow for quantitative metagenomics is detailed below [99]:
- Sample Collection & DNA Extraction: Environmental samples (e.g., water, soil, sludge) are collected and subjected to direct total DNA extraction using kits such as the FastDNA Spin Kit for Soil.
- Spiking of Internal Standards: To enable absolute quantification, synthetic DNA standards (e.g., "meta sequins") are spiked into the sample DNA extract at known concentrations before sequencing [99].
- Library Preparation & Sequencing: DNA libraries are prepared and sequenced on a high-throughput platform like Illumina. A mean sequencing depth of ~94 gigabases (Gb) is recommended for sensitive detection in complex matrices like wastewater [99].
- Bioinformatic Analysis: Sequencing reads are processed through pipelines that involve:
- Quality Control & Trimming: Using tools like FastQC and Trimmomatic.
- Assembly: De novo or reference-based assembly of reads into longer contigs.
- Annotation: Contigs and reads are aligned against ARG databases (e.g., ResFinder, SARG, CARD) to identify and quantify ARGs. Mobile genetic elements (MGEs) and taxonomic assignments are also analyzed.
Limitations: Metagenomics has higher detection limits than PCR-based methods (approximately 1 gene copy/μL extract versus 1-10 copies for ddPCR) and is semi-quantitative without internal standards [99]. Its success is also dependent on the completeness and accuracy of reference databases [100].
The following diagram illustrates the core workflows and key decision points when choosing between these methodologies for environmental resistome research.
Quantitative Benchmarking of Method Performance
Direct comparisons of metagenomics and culture-based methods reveal significant differences in their capabilities and outputs. The table below summarizes the comparative analysis of these techniques alongside high-throughput qPCR (HT-qPCR), another common molecular method.
Table 1: Comparative Performance of ARG Detection and Characterization Methods
| Parameter | Traditional Culture-Based | High-Throughput qPCR (HT-qPCR) | Metagenomic Sequencing |
|---|---|---|---|
| Basis of Detection | Growth of viable bacteria on selective media [97] | Primer-based amplification of known DNA sequences [100] | Sequencing of all extracted DNA [97] |
| Throughput & Scope | Low; targets cultivable ARB | Medium; simultaneously detects hundreds of pre-defined ARGs & MGEs [100] | High; detects all known and novel ARGs in a single run [97] |
| Sensitivity | High for targeted, cultivable organisms | Very high (detection limit: ~1-10 gene copies) [100] | Lower than qPCR (detection limit: ~1.3x10³ gene copies/μL; ~1 gene copy/10³ genomes) [31] [99] |
| Quantification | Quantitative for cultivable fractions (CFU/mL) | Absolute quantification of targeted genes [100] | Semi-quantitative (relative abundance); requires internal standards (e.g., sequins) for absolute quantification [99] |
| Host Linkage | Directly links ARG to a viable, cultivable host organism | No host information [100] | Provides probabilistic host assignment via bioinformatic analysis [31] |
| Mobility Context | Requires separate plasmid conjugation experiments | Can co-detected targeted MGEs, but no genetic linkage [100] | Reveals genetic context (e.g., ARG association with plasmids, integrons) [31] [97] |
| Key Advantage | Confirms viability and phenotype; gold standard for AST | Highly sensitive and quantitative for predefined targets | Cultivation-independent; comprehensive and untargeted discovery [97] |
| Primary Limitation | Miss >99% of uncultivable bacteria; low throughput [97] | Limited to known genes; no genetic context or host data [100] | Higher cost; complex data analysis; dependent on database quality [100] |
Integrated Experimental Protocols for Environmental Resistome Profiling
To achieve a holistic understanding, modern studies often employ an integrated approach. The following protocol, synthesizing methodologies from recent studies, outlines how to combine these techniques for a comprehensive analysis of an environmental sample (e.g., wastewater).
Table 2: Essential Research Reagent Solutions for Integrated ARG Profiling
| Item | Function/Description | Exemplar Product/Citation |
|---|---|---|
| FastDNA Spin Kit for Soil | Efficiently extracts DNA from complex environmental matrices with tough-to-lyse microorganisms. | MP Biomedicals (cited in [99]) |
| Selective Culture Media | Agar plates containing specific antibiotics for isolating viable antibiotic-resistant bacteria (ARB). | Mueller-Hinton Agar with antibiotics (implied in [98]) |
| Meta Sequin Standards | Synthetic DNA oligonucleotides spiked into samples as internal controls for absolute quantification in metagenomics. | "Mixture A" from the Garvan Institute [99] |
| ARG Reference Databases | Curated collections of known ARG sequences essential for bioinformatic annotation of metagenomic data. | ResFinder [70], SARG [87], CARD |
| Droplet Digital PCR (ddPCR) | Used for ultra-sensitive, absolute quantification of specific, high-priority ARGs (e.g., sul1, vanA). |
Bio-Rad QX200 system [99] |
Detailed Integrated Workflow
Sample Collection and Processing:
- Collect representative environmental samples (e.g., 500 mL of wastewater influent) in sterile containers [98].
- Split the sample: one portion for culture-based analysis, one for DNA extraction.
Parallel Analysis Tracks:
- Culture-Based Track:
- Serially dilute the sample and plate onto selective media containing a range of antibiotics (e.g., carbapenems, 3rd generation cephalosporins) [98].
- Incubate and enumerate colonies to quantify ARB.
- Perform AST on isolates using broth microdilution to determine MICs.
- Extract genomic DNA from purified isolates and perform PCR for common ARGs (e.g.,
blaCTX-M,blaNDM) [98] [97].
- Metagenomic Track:
- Concentrate biomass by vacuum filtration onto 0.45μm filters [99].
- Extract total genomic DNA using a dedicated kit for environmental samples.
- Spike a known concentration of meta sequin standards into the purified DNA extract [99].
- Prepare sequencing libraries and sequence on an Illumina platform to a recommended depth of ~100 Gb/sample for complex matrices [99].
- Culture-Based Track:
Data Integration and Analysis:
- Culture Data: Report ARB concentrations (CFU/mL) and the prevalence of specific resistance phenotypes/genotypes in isolates.
- Metagenomic Data:
- Use bioinformatic tools to quantify the absolute abundance of ARGs (copies/μL) by normalizing to the sequin standards [99].
- Analyze the co-occurrence of ARGs with MGEs (e.g., plasmids, integrons) and assess the taxonomic composition of the community.
- Calculate risk indices based on the abundance of high-risk ARGs (Rank I ARGs) and their mobility [31] [87].
Both culture-based and metagenomic methods are indispensable tools in environmental resistome research, yet they answer fundamentally different questions. Culture-based techniques remain the gold standard for confirming the viability and pathogenic potential of antibiotic-resistant bacteria, providing critical data for clinical risk assessment. In contrast, metagenomics unveils the vast, hidden diversity of the resistome, offering unparalleled insights into the genetic potential for resistance, including the mechanisms of horizontal gene transfer that drive its spread.
The choice between methods is not a matter of superiority but of objective. For monitoring specific, known pathogens and their phenotypic resistance, culture-based methods are optimal. For discovering the full scope of ARGs, understanding dissemination risks via MGEs, and tracking the flow of resistance across One Health compartments, metagenomics is transformative. An integrated approach, leveraging the strengths of both, provides the most robust framework for assessing the prevalence and risk of ARGs in the environment, thereby informing effective public health interventions to mitigate the global AMR crisis.
Conclusion
The study of the environmental resistome reveals a complex and interconnected landscape where antibiotic resistance genes circulate and evolve. Key takeaways include the ubiquitous presence of diverse ARGs in hotspots like wastewater and farms, the critical role of mobile genetic elements in dissemination, and the power of metagenomics and AI for surveillance. A proactive, One Health approach is paramount. Future efforts must focus on standardizing methodologies, expanding global monitoring, and integrating environmental resistome data directly into the antibiotic development pipeline to create evasive therapies. By understanding and anticipating resistance from the environment, we can develop more resilient treatment strategies and safeguard public health for the future.
References
- 1. Antibiotic resistance in the environment [https://www.nature.com/articles/s41579-021-00649-x]
- 2. An eco-evolutionary perspective on antimicrobial ... [https://pmc.ncbi.nlm.nih.gov/articles/PMC11719859/]
- 3. Environmental occurrence of antibiotic resistance, control ... [https://www.sciencedirect.com/science/article/pii/S2405665024001410]
- 4. Global diversity and distribution of antibiotic resistance ... [https://www.nature.com/articles/s41467-025-59019-3]
- 5. A Review on the Prevalence and Treatment of Antibiotic ... [https://pmc.ncbi.nlm.nih.gov/articles/PMC12031161/]
- 6. Comprehensive genome catalog analysis of the resistome ... [https://www.nature.com/articles/s41522-025-00746-2]
- 7. Global livestock resistome: Antibiotic resistance is ... [https://amr.solutions/2025/08/15/global-livestock-resistome-antibiotic-resistance-is-widespread/]
- 8. Environmental drivers of the resistome across the Baltic Sea [https://microbiomejournal.biomedcentral.com/articles/10.1186/s40168-025-02086-x]
- 9. Antibiotic resistome from the One-Health perspective [https://pmc.ncbi.nlm.nih.gov/articles/PMC8080597/]
- 10. The Role of Wastewater Treatment Plants in Dissemination of ... [https://pmc.ncbi.nlm.nih.gov/articles/PMC11274174/]
- 11. Functional resistomes in municipal wastewater treatment ... [https://www.sciencedirect.com/science/article/pii/S0043135425015660]
- 12. 水产养殖环境中抗生素抗性基因(ARGs) 研究进展 [https://www.schinafish.cn/cn/article/doi/10.12131/20210207]
- 13. 植物源有机物料添加对农田土壤抗生素抗性基因扩散影响 ... [http://soils.issas.ac.cn/html/tr/2025/1/tr202401150024.htm]
- 14. 废水排放对近海环境中抗生素抗性基因和微生物群落的影响 [https://www.hjkx.ac.cn/hjkx/ch/html/20220921.htm]
- 15. Species-resolved profiling of antibiotic resistance genes in ... [https://www.nature.com/articles/s41467-025-57088-y]
- 16. Experimental evolution as an efficient tool to dissect ... [https://www.sciencedirect.com/science/article/abs/pii/S1368764614000041]
- 17. Adaptive Laboratory Evolution of Antibiotic Resistance ... [https://pmc.ncbi.nlm.nih.gov/articles/PMC5425606/]
- 18. Dominant resistance and negative epistasis can limit the co ... [https://pubmed.ncbi.nlm.nih.gov/32139686/]
- 19. Analysis of Antibiotic Resistance Genes (ARGs) across ... [https://pmc.ncbi.nlm.nih.gov/articles/PMC11429446/]
- 20. Biotic and abiotic factors distinctly drive contrasting ... [https://www.nature.com/articles/s43705-021-00012-4]
- 21. Environmental microbiome diversity and stability is a ... [https://www.nature.com/articles/s42003-024-06338-8]
- 22. Accelerated spread of antibiotic resistance genes (ARGs ... [https://www.sciencedirect.com/science/article/abs/pii/S0043135422010065]
- 23. Exploring diversity patterns and driving mechanisms of the ... [https://www.sciencedirect.com/science/article/abs/pii/S030438942300016X]
- 24. Contamination Characteristics of Antibiotic Resistance Genes ... [https://pmc.ncbi.nlm.nih.gov/articles/PMC11728509/]
- 25. A database on the abundance of environmental antibiotic ... [https://pmc.ncbi.nlm.nih.gov/articles/PMC10899624/]
- 26. Antibiotic Selection Pressure Determination through ... [https://pmc.ncbi.nlm.nih.gov/articles/PMC4649198/]
- 27. Environmental resistomes and antimicrobial resistance [https://pubmed.ncbi.nlm.nih.gov/41015591/]
- 28. One Health, One Microbiome [https://microbiomejournal.biomedcentral.com/articles/10.1186/s40168-025-02231-6]
- 29. Prevalence of antibiotic resistance genes its association ... [https://www.frontiersin.org/journals/microbiology/articles/10.3389/fmicb.2025.1595051/full]
- 30. the L-ARRAP for long-read metagenomic profiling [https://pubmed.ncbi.nlm.nih.gov/41066697/]
- 31. Towards the integration of antibiotic resistance gene ... [https://www.nature.com/articles/s44259-025-00154-8]
- 32. Resistome Flux in the Environment: A 3Es and 3Ds ... [https://www.sciencedirect.com/science/article/pii/S3050641725000369]
- 33. Leveraging artificial intelligence for One Health ... [https://pmc.ncbi.nlm.nih.gov/articles/PMC12532937/]
- 34. Metagenomic Approaches to Analyze Antimicrobial ... [https://www.frontiersin.org/journals/genetics/articles/10.3389/fgene.2020.575592/full]
- 35. 基于功能宏基因组学挖掘抗生素耐药基因研究进展 - 生物技术通报 [https://biotech.aiijournal.com/CN/10.13560/j.cnki.biotech.bull.1985.2022-0537]
- 36. 基于宏基因组技术解析南极不同纬度地区土壤抗生素抗性 ... [https://actamicro.ijournals.cn/html/actamicrocn/2021/11/20211130.htm]
- 37. Quantifying antibiotic resistome risks across environmental ... [https://pmc.ncbi.nlm.nih.gov/articles/PMC12510455/]
- 38. ResistoXplorer: a web-based tool for visual, statistical and ... [https://pmc.ncbi.nlm.nih.gov/articles/PMC7991225/]
- 39. Comprehensive whole metagenomics analysis uncovers ... [https://www.frontiersin.org/journals/microbiology/articles/10.3389/fmicb.2025.1649872/full]
- 40. Beyond the Resistome: Molecular Insights, Emerging ... [https://pmc.ncbi.nlm.nih.gov/articles/PMC12561093/]
- 41. Long-read metagenomic sequencing reveals shifts in ... [https://microbiomejournal.biomedcentral.com/articles/10.1186/s40168-021-01216-5]
- 42. ARGem: a new metagenomics pipeline for antibiotic ... [https://pmc.ncbi.nlm.nih.gov/articles/PMC10558085/]
- 43. Investigation of mobile genetic elements and their association ... [https://journals.plos.org/plosone/article?id=10.1371/journal.pone.0330304]
- 44. ARG Antibiotic Resistance Gene Analysis Service [https://www.cd-genomics.com/arg-analysis.html]
- 45. DeepMobilome: predicting mobile genetic elements using ... [https://pmc.ncbi.nlm.nih.gov/articles/PMC12414478/]
- 46. how mobile genetic elements drive horizontal gene transfer ... [https://pmc.ncbi.nlm.nih.gov/articles/PMC9393566/]
- 47. Epidemiological factors associated with the prevalence of ... [https://pmc.ncbi.nlm.nih.gov/articles/PMC12232692/]
- 48. Current examining methods and mathematical models of ... [https://pmc.ncbi.nlm.nih.gov/articles/PMC11025395/]
- 49. Microbial communities and mobile genetic elements ... [https://www.sciencedirect.com/science/article/abs/pii/S0269749124017330]
- 50. Spatial mapping of mobile genetic elements and their ... [https://www.nature.com/articles/s41564-024-01735-5]
- 51. Machine Learning for Antimicrobial Resistance Prediction [https://pmc.ncbi.nlm.nih.gov/articles/PMC9491192/]
- 52. Beyond the Resistome: Molecular Insights, Emerging Therapies, and Environmental Drivers of Antibiotic Resistance | MDPI [https://www.mdpi.com/2079-6382/14/10/995]
- 53. Identification of discriminatory antibiotic resistance genes ... [https://microbiomejournal.biomedcentral.com/articles/10.1186/s40168-019-0735-1]
- 54. Application of next-generation sequencing to identify different ... [https://pmc.ncbi.nlm.nih.gov/articles/PMC10859930/]
- 55. Artificial intelligence-driven microbiome data analysis for ... [https://pmc.ncbi.nlm.nih.gov/articles/PMC10834752/]
- 56. DRAMMA: a multifaceted machine learning approach for ... [https://pmc.ncbi.nlm.nih.gov/articles/PMC11887096/]
- 57. Exploration of machine learning algorithms for predicting ... [https://www.sciencedirect.com/science/article/abs/pii/S0048969722033083]
- 58. Environmental risk characterization and ecological process determination of bacterial antibiotic resistome in lake sediments - PubMed [https://pubmed.ncbi.nlm.nih.gov/33385921/]
- 59. Next-Generation Sequencing (NGS) | Explore the technology [https://www.illumina.com/science/technology/next-generation-sequencing.html]
- 60. Metagenomic analysis of human, animal, and ... [https://www.nature.com/articles/s41598-025-90777-8]
- 61. The Environmental Lifecycle of Antibiotics and Resistance ... [https://pmc.ncbi.nlm.nih.gov/articles/PMC12472320/]
- 62. Assessment of global health risk of antibiotic resistance ... [https://www.nature.com/articles/s41467-022-29283-8]
- 63. A Resistome Roadmap: From the Human Body to Pristine ... [https://pmc.ncbi.nlm.nih.gov/articles/PMC9134733/]
- 64. The increase in wastewater-sourced resistome elevated ... [https://www.sciencedirect.com/science/article/pii/S0160412025005203]
- 65. Improved quantitative microbiome profiling for environmental ... [https://environmentalmicrobiome.biomedcentral.com/articles/10.1186/s40793-021-00391-0]
- 66. Metagenomic assemblies tend to break around antibiotic ... [https://bmcgenomics.biomedcentral.com/articles/10.1186/s12864-024-10876-0]
- 67. Metagenomic co-assembly uncovers mobile antibiotic ... [https://www.nature.com/articles/s43247-025-02381-3]
- 68. Critical evaluation of short, long, and hybrid assembly ... - PMC [https://pmc.ncbi.nlm.nih.gov/articles/PMC7881036/]
- 69. High-quality genome assembly enables prediction of allele ... [https://pmc.ncbi.nlm.nih.gov/articles/PMC11060683/]
- 70. Geographics and bacterial networks differently shape the ... [https://www.nature.com/articles/s41467-025-66070-7]
- 71. Inter-plasmid transfer of antibiotic resistance genes ... [https://pmc.ncbi.nlm.nih.gov/articles/PMC10881300/]
- 72. The structure and diversity of human, animal and ... - Microbiome [https://microbiomejournal.biomedcentral.com/articles/10.1186/s40168-016-0199-5]
- 73. New and traditional methods for antibiotic resistance genes ... [https://pmc.ncbi.nlm.nih.gov/articles/PMC9845729/]
- 74. An antiplasmid system drives antibiotic resistance gene ... [https://www.nature.com/articles/s41467-024-48219-y]
- 75. NCRD: A non-redundant comprehensive database for ... - PMC [https://pmc.ncbi.nlm.nih.gov/articles/PMC10590964/]
- 76. Towards the definition of an antibiotic resistome signature ... [https://www.sciencedirect.com/science/article/pii/S0269749124011382]
- 77. Metagenomic comparison of the faecal and environmental ... [https://pmc.ncbi.nlm.nih.gov/articles/PMC10712031/]
- 78. Mobilome-driven segregation of the resistome in biological ... [https://elifesciences.org/articles/81196]
- 79. Functional Repertoire of Antibiotic Resistance Genes in ... [https://pmc.ncbi.nlm.nih.gov/articles/PMC5776109/]
- 80. Biochemical mechanisms determine the functional ... [https://www.nature.com/articles/s41467-018-02944-3]
- 81. Roadmap to tackle antibiotic resistance in the environment ... [https://pmc.ncbi.nlm.nih.gov/articles/PMC10989945/]
- 82. Assessment of global health risk of antibiotic resistance ... [https://pmc.ncbi.nlm.nih.gov/articles/PMC8943045/]
- 83. The Assessment of the Risk Ranking and Mobility Potential ... [https://www.mdpi.com/2071-1050/14/21/14292]
- 84. A Practical Framework for Environmental Antibiotic ... [https://www.mdpi.com/2079-6382/14/8/840]
- 85. Latent antibiotic resistance genes are abundant, diverse, and ... [https://microbiomejournal.biomedcentral.com/articles/10.1186/s40168-023-01479-0]
- 86. Resistome Analysis of Global Livestock and Soil Microbiomes [https://pmc.ncbi.nlm.nih.gov/articles/PMC9300982/]
- 87. Global soil antibiotic resistance genes are associated with ... [https://www.nature.com/articles/s41467-025-61606-3]
- 88. Comparative analysis of characteristics of antibiotic ... [https://www.sciencedirect.com/science/article/abs/pii/S0304389424005223]
- 89. Prevalence of antibiotic resistance genes its association with ... [https://pmc.ncbi.nlm.nih.gov/articles/PMC12289685/]
- 90. Evaluating human exposure to antibiotic resistance genes [https://pmc.ncbi.nlm.nih.gov/articles/PMC11895025/]
- 91. Antibiotics, Resistome and Resistance Mechanisms [https://www.frontiersin.org/journals/microbiology/articles/10.3389/fmicb.2018.02066/full]
- 92. Mobile Genetic Elements Associated with Antimicrobial ... [https://pmc.ncbi.nlm.nih.gov/articles/PMC6148190/]
- 93. Environmental resistome–guided development of resistance ... [https://pmc.ncbi.nlm.nih.gov/articles/PMC12130845/]
- 94. New tool helps predict antibiotic resistance [https://www.rockefeller.edu/news/38082-new-tool-helps-predict-antibiotic-resistance/]
- 95. Improved quantitative microbiome profiling for ... [https://pmc.ncbi.nlm.nih.gov/articles/PMC8600772/]
- 96. Distinction and connectivity across diverse habitats ... [https://www.sciencedirect.com/science/article/abs/pii/S004313542300310X]
- 97. Metagenomics as a Transformative Tool for Antibiotic ... [https://pmc.ncbi.nlm.nih.gov/articles/PMC11939754/]
- 98. Integrated metagenomic, culture-based, and whole ... [https://www.sciencedirect.com/science/article/pii/S1438463925001464]
- 99. Evaluating Quantitative Metagenomics for Environmental ... [https://pmc.ncbi.nlm.nih.gov/articles/PMC11966778/]
- 100. Quantitative comparison of HT-qPCR/16S rRNA ... [https://www.sciencedirect.com/science/article/abs/pii/S0304389425028237]